
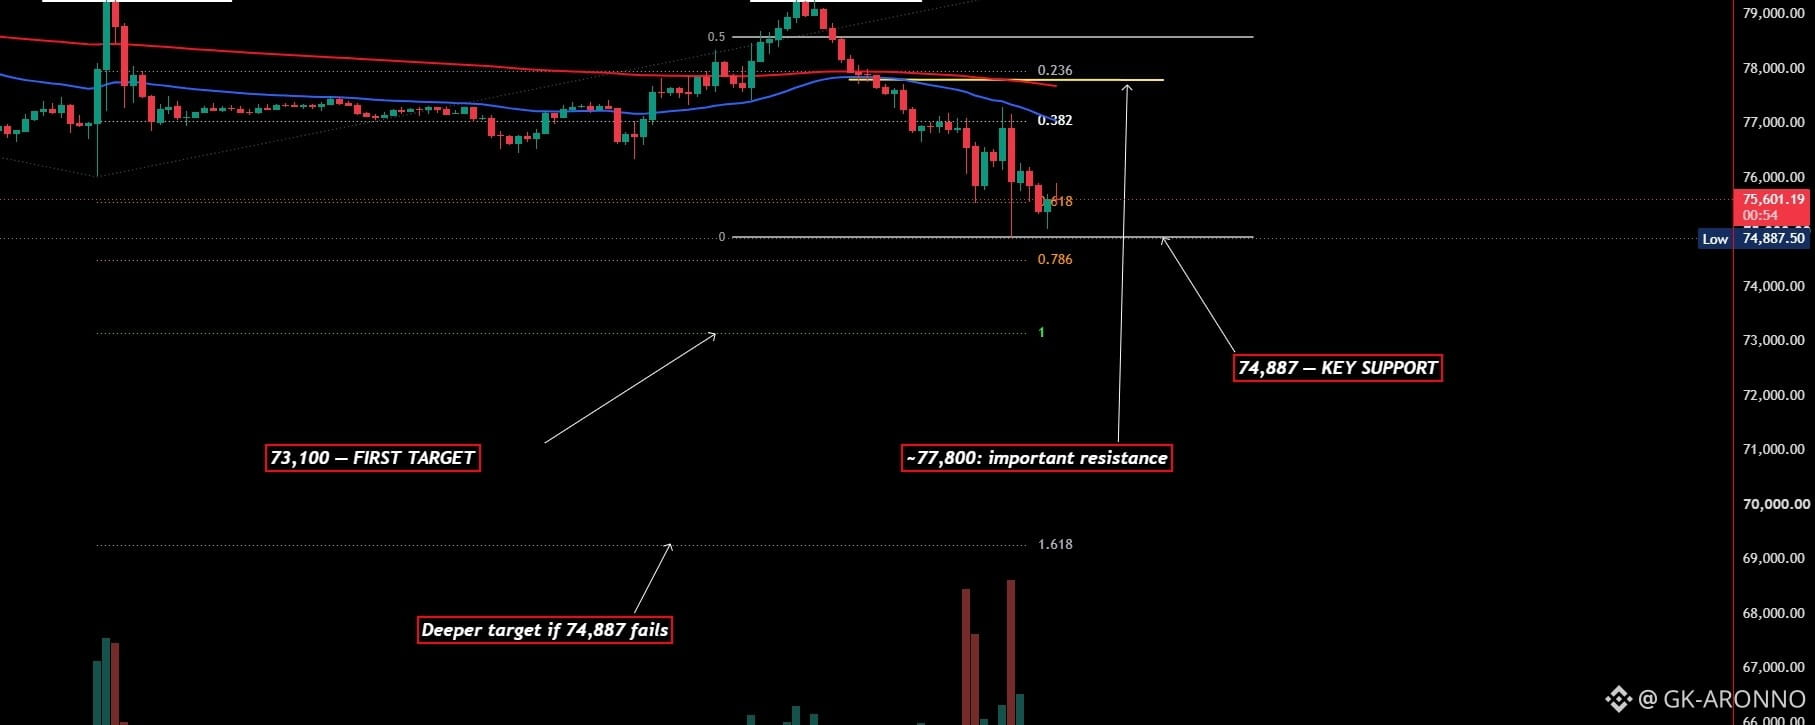

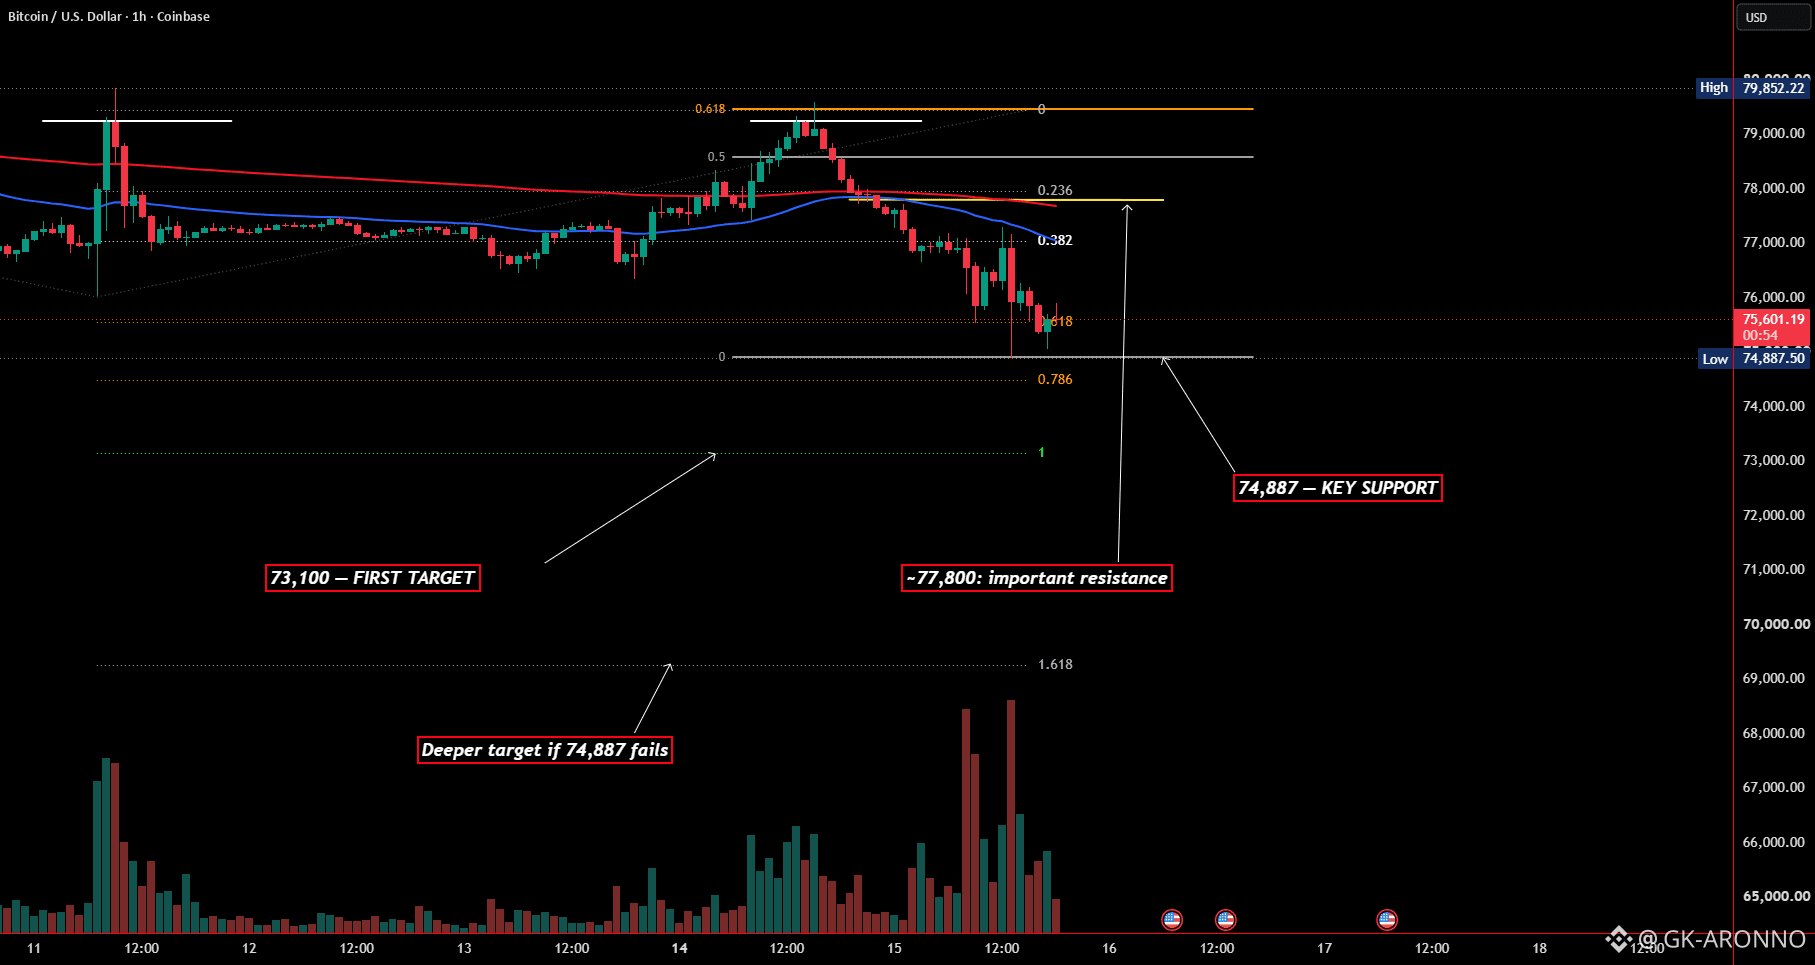
After pushing up toward $79,852, BTC was rejected and has been working its way lower. On the 1-hour chart, price has now reached the 0.618 Fibonacci area, with $74,887 sitting underneath as the key support level.
This is where things get interesting.
If $74,887 holds, I’d be watching to see if Bitcoin can stabilize and work its way back toward $77,800, which is an important resistance area. A reclaim there could put the recent highs back into focus.
But if $74,887 breaks and fails to recover, the chart opens up toward $73,100 first, with the deeper Fibonacci extension sitting around $69,200.
For me, this is less about guessing the next move and more about watching how price reacts at these levels.
Support holds → watch the reaction.
Support fails → watch the downside targets.
