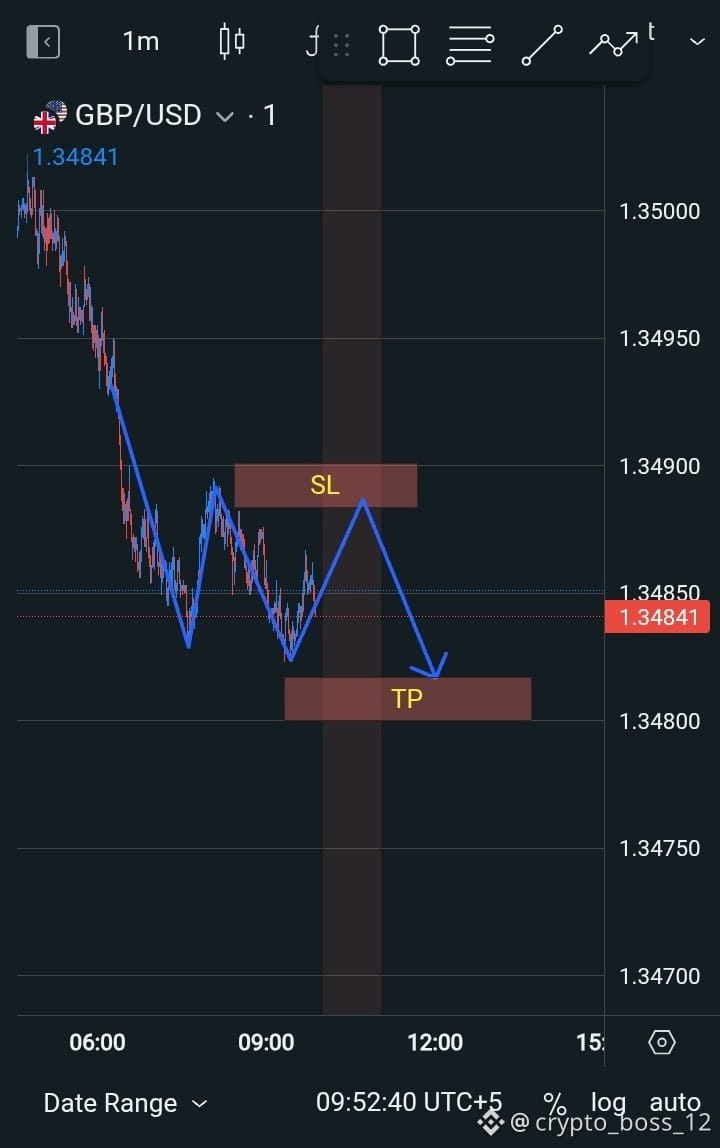
Here is the explanation of the technical analysis shown in the GBP/USD chart:
Market Overview
* Currency Pair & Timeframe: GBP/USD on a 1-minute (1m) chart.
* Pattern: Bearish Trend Continuation / Double Top (or Lower High) Resistance Rejection.
Key Analysis Components
* Market Structure: The market experienced a strong downtrend from 1.35000 down to around 1.34800, followed by a corrective bounce. The blue zigzag line projects a lower-high formation, indicating continuing bearish momentum.
* Stop Loss (SL) Zone: The upper shaded box labeled SL (around 1.34880 – 1.34900) acts as a key resistance level. The analysis expects price to test this supply zone, fail to break higher, and reverse downwards. Placing the Stop Loss above this zone manages risk if the price breaks out upward.
* Take Profit (TP) Target: The lower shaded box labeled TP (around 1.34800 – 1.34810) represents the recent low support level, serving as the projected profit-taking target.
Summary
This setup represents a Bearish Sell Limit / Retest Trade. The trader anticipates that price will make a minor pull-up into the SL (Resistance) zone to pick up sell liquidity, reject that level, and drop toward the TP (Support) zone.
Market Overview
* Currency Pair & Timeframe: GBP/USD on a 1-minute (1m) chart.
* Pattern: Bearish Trend Continuation / Double Top (or Lower High) Resistance Rejection.
Key Analysis Components
* Market Structure: The market experienced a strong downtrend from 1.35000 down to around 1.34800, followed by a corrective bounce. The blue zigzag line projects a lower-high formation, indicating continuing bearish momentum.
* Stop Loss (SL) Zone: The upper shaded box labeled SL (around 1.34880 – 1.34900) acts as a key resistance level. The analysis expects price to test this supply zone, fail to break higher, and reverse downwards. Placing the Stop Loss above this zone manages risk if the price breaks out upward.
* Take Profit (TP) Target: The lower shaded box labeled TP (around 1.34800 – 1.34810) represents the recent low support level, serving as the projected profit-taking target.
Summary
This setup represents a Bearish Sell Limit / Retest Trade. The trader anticipates that price will make a minor pull-up into the SL (Resistance) zone to pick up sell liquidity, reject that level, and drop toward the TP (Support) zone.