$GSB
📊 GSB/USDT — Quick Chart Analysis
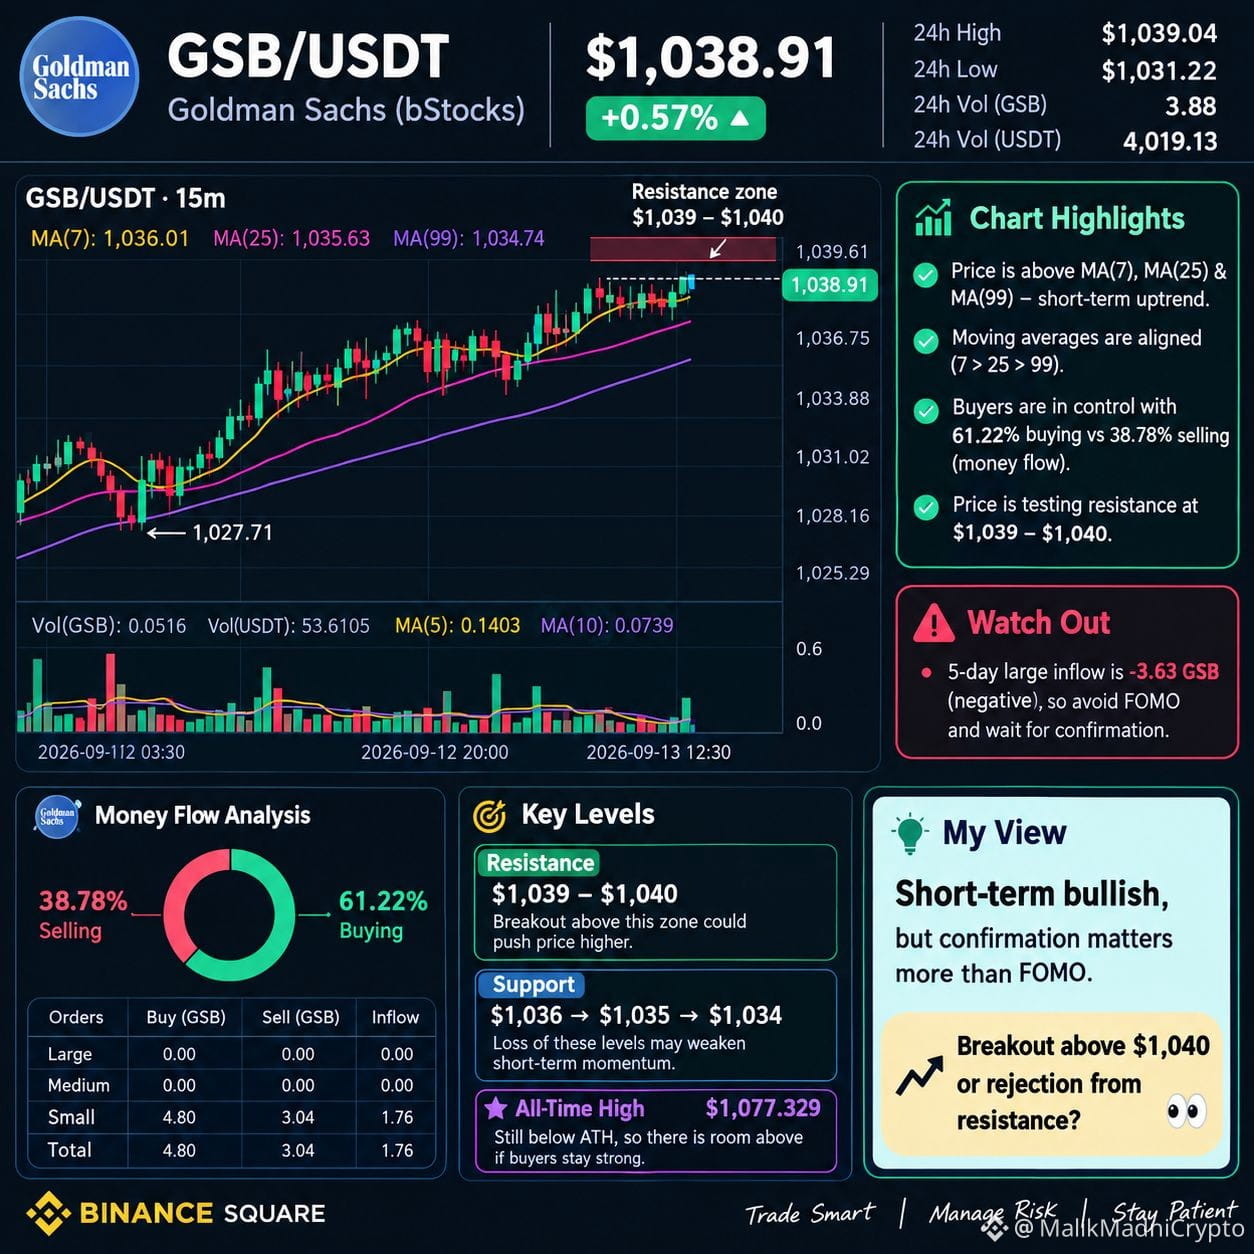
Goldman Sachs (GSB) is showing short-term bullish strength, but price is now testing an important resistance zone. 👀
💰 Current Price: $1,038.91
📈 24H Change: +0.57%
🎯 24H High: $1,039.04
📉 24H Low: $1,031.22
🔎 What Is the Chart Telling Us?
🔹 On the 15M chart, price is holding above MA(7), MA(25), and MA(99) — a positive sign for the short-term trend.
🔹 Moving Averages:
🟡 MA7: $1,036.01
🩷 MA25: $1,035.63
🟣 MA99: $1,034.74
The moving averages are aligned positively, showing that buyers currently have control of the short-term trend. 📈
🔹 Money Flow: 🟢 Buying: 61.22%
🔴 Selling: 38.78%
Buyers have the advantage, but there is one important warning. ⚠️
🔸 5-Day Large Inflow: -3.63 GSB
Large-order activity is still negative, while recent buying is mainly coming from smaller orders. So, don't chase the price blindly.
🎯 Key Levels I'm Watching
🔴 Resistance: $1,039–$1,040
A clean breakout and hold above $1,040 could give buyers more confidence and potentially push the price higher. 🚀
🟢 Support: $1,036 → $1,035 → $1,034
If price loses these levels, short-term bullish momentum could weaken. ⚠️
📌 All-Time High: $1,077.329
GSB is still below its ATH, so there is room for further upside — but first, buyers need to conquer the $1,039–$1,040 resistance zone.
🧠 My View
🟢 Short-term bullish, but confirmation matters more than FOMO.
I would watch how price behaves around $1,040 before making a decision.
🔥 Your Turn!
If GSB breaks above $1,040, what is your next target? 🎯
💬 Comment your target — $1,050, $1,060, or even higher? 👀📈
Let's see whose prediction comes closest! 🔥
#GSB #GoldmanSachs #GSBUSDT #Crypto #Binance #BinanceSquare #TechnicalAnalysis #Altcoins #CryptoTrading #trading
📊 GSB/USDT — Quick Chart Analysis
Goldman Sachs (GSB) is showing short-term bullish strength, but price is now testing an important resistance zone. 👀
💰 Current Price: $1,038.91
📈 24H Change: +0.57%
🎯 24H High: $1,039.04
📉 24H Low: $1,031.22
🔎 What Is the Chart Telling Us?
🔹 On the 15M chart, price is holding above MA(7), MA(25), and MA(99) — a positive sign for the short-term trend.
🔹 Moving Averages:
🟡 MA7: $1,036.01
🩷 MA25: $1,035.63
🟣 MA99: $1,034.74
The moving averages are aligned positively, showing that buyers currently have control of the short-term trend. 📈
🔹 Money Flow: 🟢 Buying: 61.22%
🔴 Selling: 38.78%
Buyers have the advantage, but there is one important warning. ⚠️
🔸 5-Day Large Inflow: -3.63 GSB
Large-order activity is still negative, while recent buying is mainly coming from smaller orders. So, don't chase the price blindly.
🎯 Key Levels I'm Watching
🔴 Resistance: $1,039–$1,040
A clean breakout and hold above $1,040 could give buyers more confidence and potentially push the price higher. 🚀
🟢 Support: $1,036 → $1,035 → $1,034
If price loses these levels, short-term bullish momentum could weaken. ⚠️
📌 All-Time High: $1,077.329
GSB is still below its ATH, so there is room for further upside — but first, buyers need to conquer the $1,039–$1,040 resistance zone.
🧠 My View
🟢 Short-term bullish, but confirmation matters more than FOMO.
I would watch how price behaves around $1,040 before making a decision.
🔥 Your Turn!
If GSB breaks above $1,040, what is your next target? 🎯
💬 Comment your target — $1,050, $1,060, or even higher? 👀📈
Let's see whose prediction comes closest! 🔥
#GSB #GoldmanSachs #GSBUSDT #Crypto #Binance #BinanceSquare #TechnicalAnalysis #Altcoins #CryptoTrading #trading