⚡ $ZEC THE CHART JUST WOKE UP! 🐻➡️🐂
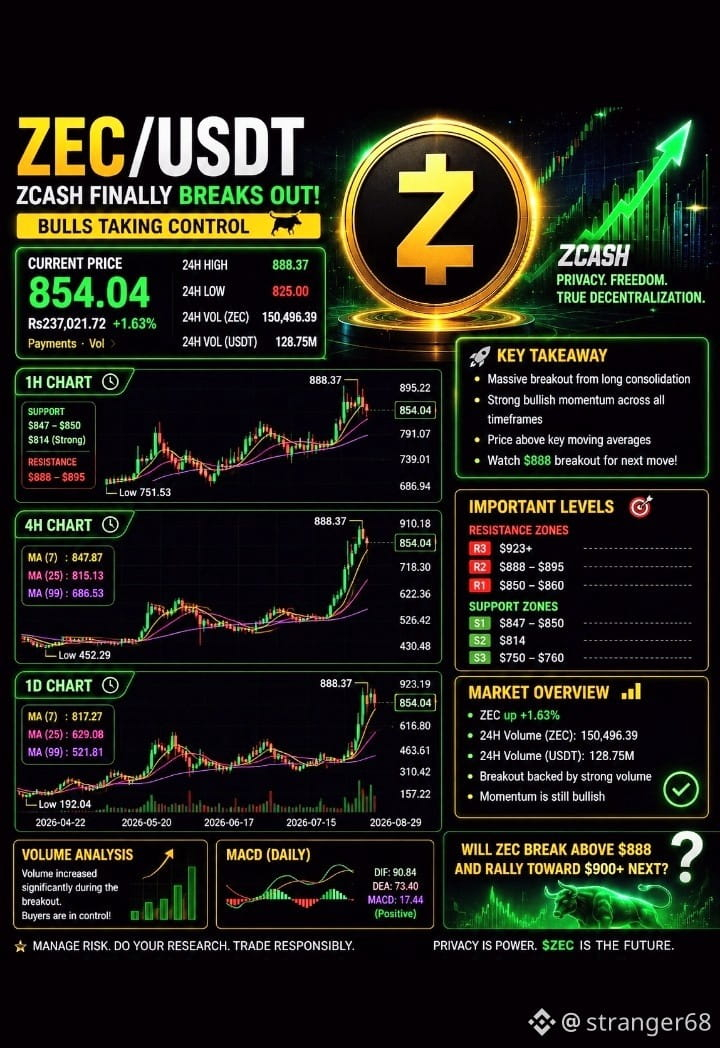
A major trend shift is visible across the 1H, 4H and 1D charts. After spending weeks building a base, price has surged to around $855, with the recent high reaching $888.37. 🚀📈
🕐 1H | Short-Term Battle
Price is pulling back slightly after testing the highs.
🟢 Support: $847–$850
🟢 Stronger support: ~$814
🔴 Resistance: $888–$895
The 1H moving averages are still positioned positively, but buyers need to defend the recent breakout zone.
🔥 4H | Momentum Remains Strong
The 4H chart shows a powerful breakout from the $450–$500 region.
📌 MA(7): $847.87
📌 MA(25): $815.13
📌 MA(99): $686.53
That structure remains bullish while price holds above the short-term averages. A clean break through $888–$910 could bring fresh momentum. 🚀
🌐 1D | BIG TREND REVERSAL?
The daily chart is the most interesting part.
Price has climbed dramatically from around $192 and is now trading far above the displayed MA(7), MA(25), and MA(99).
📊 MA(7): $817.27
📊 MA(25): $629.08
📊 MA(99): $521.81
MACD is also positive, adding another bullish signal. 📈⚡
⚠️ BUT: After such a huge rally, volatility can be extreme. Losing $814 could trigger a deeper cooling phase.
🎯 Levels I'm watching:
$888 → $910 → $923+
💡 The big question now isn't whether the breakout happened — it's whether buyers can turn this explosive move into a sustained trend.
🔥 Can the bulls push through $888 and take ZEC toward $900+ next?
#ZEC #CryptoTrading #Altcoins 🚀📊
#BitcoinSpotETFEnds9DayInflowStreak #XRPETFsBiggestWeeklyHaulOf2026 #KoreaSingleStockLeveragedETFTradingFalls #GoldFalls3.24%ThisWeek
A major trend shift is visible across the 1H, 4H and 1D charts. After spending weeks building a base, price has surged to around $855, with the recent high reaching $888.37. 🚀📈
🕐 1H | Short-Term Battle
Price is pulling back slightly after testing the highs.
🟢 Support: $847–$850
🟢 Stronger support: ~$814
🔴 Resistance: $888–$895
The 1H moving averages are still positioned positively, but buyers need to defend the recent breakout zone.
🔥 4H | Momentum Remains Strong
The 4H chart shows a powerful breakout from the $450–$500 region.
📌 MA(7): $847.87
📌 MA(25): $815.13
📌 MA(99): $686.53
That structure remains bullish while price holds above the short-term averages. A clean break through $888–$910 could bring fresh momentum. 🚀
🌐 1D | BIG TREND REVERSAL?
The daily chart is the most interesting part.
Price has climbed dramatically from around $192 and is now trading far above the displayed MA(7), MA(25), and MA(99).
📊 MA(7): $817.27
📊 MA(25): $629.08
📊 MA(99): $521.81
MACD is also positive, adding another bullish signal. 📈⚡
⚠️ BUT: After such a huge rally, volatility can be extreme. Losing $814 could trigger a deeper cooling phase.
🎯 Levels I'm watching:
$888 → $910 → $923+
💡 The big question now isn't whether the breakout happened — it's whether buyers can turn this explosive move into a sustained trend.
🔥 Can the bulls push through $888 and take ZEC toward $900+ next?
#ZEC #CryptoTrading #Altcoins 🚀📊
#BitcoinSpotETFEnds9DayInflowStreak #XRPETFsBiggestWeeklyHaulOf2026 #KoreaSingleStockLeveragedETFTradingFalls #GoldFalls3.24%ThisWeek