🚀 UNI IS BREAKING OUT OF A TIGHT INTRADAY RANGE
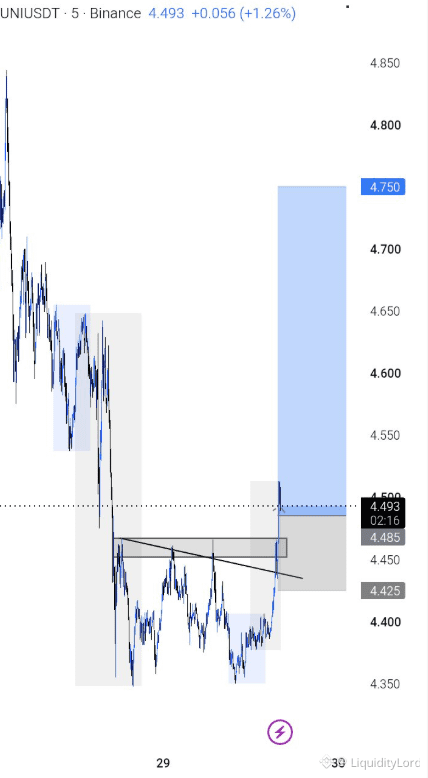
UNI is trading near 4.49 after compressing between roughly 4.35 and 4.48. The 5-minute chart now shows price pushing through descending resistance, with the breakout entering a previously defended supply area.
📊 MARKET STRUCTURE
The range had a sequence of lower highs, but sellers failed to extend the decline below 4.35–4.40. Buyers repeatedly absorbed dips and forced price back toward the top of the range.
The key change is the reclaim of 4.48. If that level becomes support, the breakout has room to develop rather than fade.
🔥 MOMENTUM CHECK
The first reaction is constructive, but the move is still close to resistance. I would prefer a retest of the breakout area over chasing the initial candle.
A hold above 4.48 keeps the bullish intraday structure intact. Losing 4.425 would weaken the setup and suggest that the breakout has failed.
TRADE PLAN
Entry: 4.485–4.500
Stop: 4.425
TP1: 4.650
TP2: 4.750
TP3: 4.850
The first target is the recent local supply zone. A clean push through it would leave 4.75–4.85 as the next area to test.
🌐 A BROADER ECOSYSTEM VIEW
UNI is the short-term breakout setup here, while S T O N represents a separate ecosystem angle built around protocol participation and longer-term alignment. The UNI thesis depends on reclaiming intraday structure, while the second angle belongs to a different timeframe.
🧠 MY CURRENT VIEW
The chart is more interesting after the resistance break, but confirmation still matters. I want to see buyers defend 4.48 and build above the old range ceiling.
If that happens, 4.65 becomes the first checkpoint, followed by 4.75 and 4.85. If price slips below 4.425, I would step aside and wait for a fresh structure instead of assuming the breakout must continue.
For now, the retest is more important than the first spike before another push higher.
NFA - DYOR
$UNI
UNI is trading near 4.49 after compressing between roughly 4.35 and 4.48. The 5-minute chart now shows price pushing through descending resistance, with the breakout entering a previously defended supply area.
📊 MARKET STRUCTURE
The range had a sequence of lower highs, but sellers failed to extend the decline below 4.35–4.40. Buyers repeatedly absorbed dips and forced price back toward the top of the range.
The key change is the reclaim of 4.48. If that level becomes support, the breakout has room to develop rather than fade.
🔥 MOMENTUM CHECK
The first reaction is constructive, but the move is still close to resistance. I would prefer a retest of the breakout area over chasing the initial candle.
A hold above 4.48 keeps the bullish intraday structure intact. Losing 4.425 would weaken the setup and suggest that the breakout has failed.
TRADE PLAN
Entry: 4.485–4.500
Stop: 4.425
TP1: 4.650
TP2: 4.750
TP3: 4.850
The first target is the recent local supply zone. A clean push through it would leave 4.75–4.85 as the next area to test.
🌐 A BROADER ECOSYSTEM VIEW
UNI is the short-term breakout setup here, while S T O N represents a separate ecosystem angle built around protocol participation and longer-term alignment. The UNI thesis depends on reclaiming intraday structure, while the second angle belongs to a different timeframe.
🧠 MY CURRENT VIEW
The chart is more interesting after the resistance break, but confirmation still matters. I want to see buyers defend 4.48 and build above the old range ceiling.
If that happens, 4.65 becomes the first checkpoint, followed by 4.75 and 4.85. If price slips below 4.425, I would step aside and wait for a fresh structure instead of assuming the breakout must continue.
For now, the retest is more important than the first spike before another push higher.
NFA - DYOR
$UNI