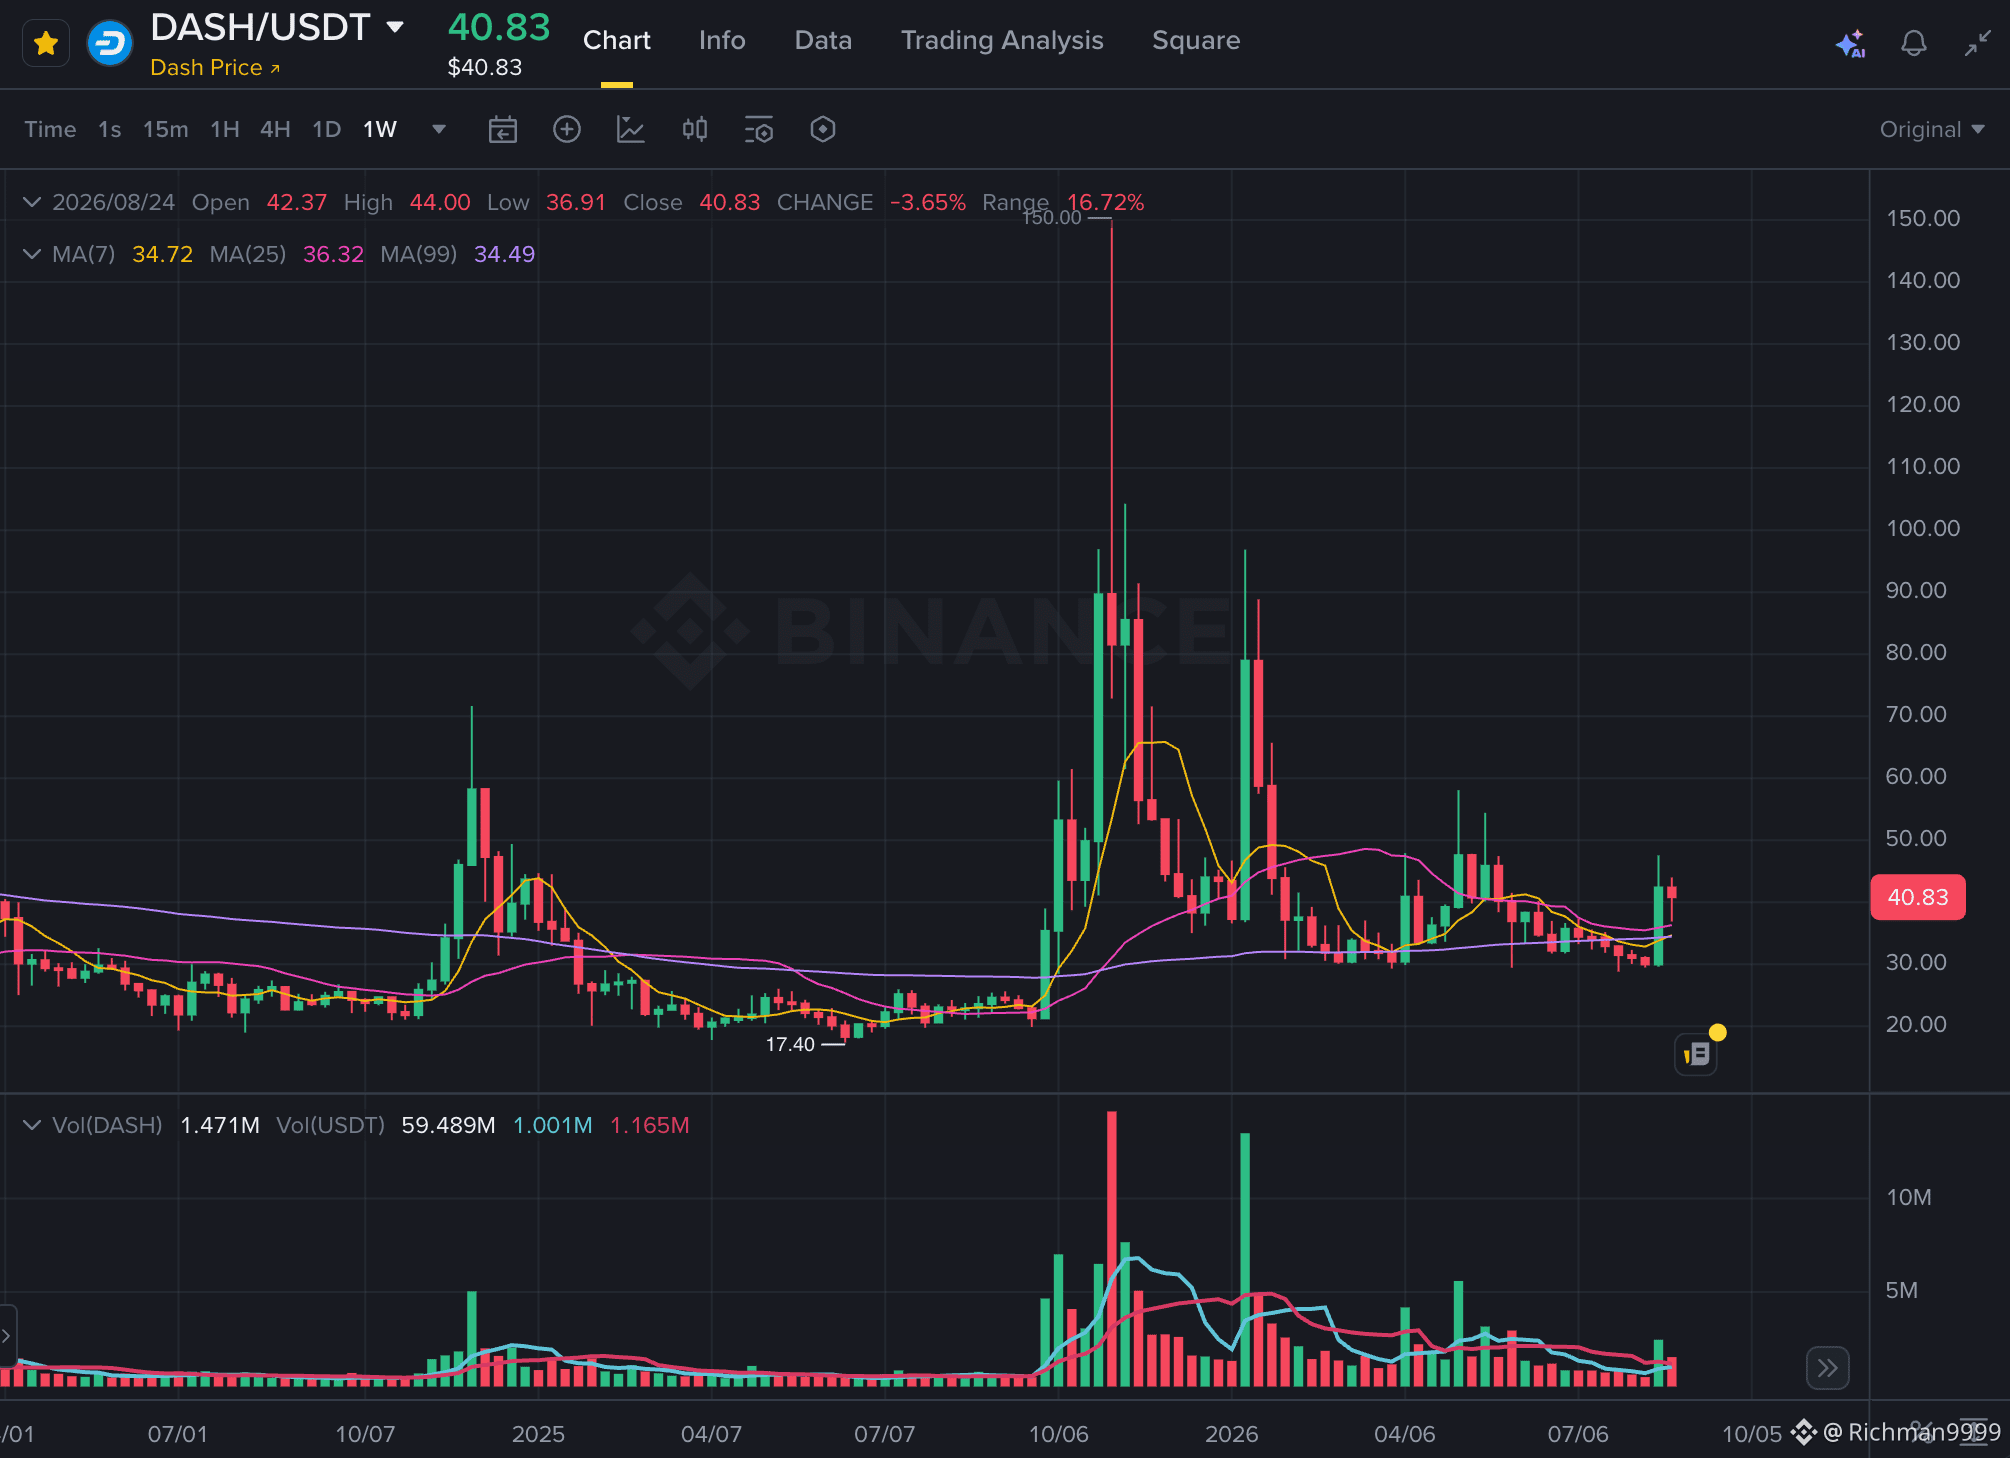
📊 $DASH /USDT — 1W Chart Analysis (Price Action + Volume Profile)
Pair: DASH/USDT | TF: Weekly
Current Price: ~$40.83
Macro Picture
DASH ran a parabolic pump to $150 wick high, then a secondary lower high near $95–100
Months of downtrend compressed price back toward the $28–30 base
Now bouncing off that base, pushing back above key moving averages (MA7/25/99 cluster at $34.5–36.5)
Price Action (Weekly)
✅ Price reclaimed and holds above all three major MAs → bullish bias
✅ MA(7) turning up, crossing above MA(99) → early trend flip signal
⚠️ Still trading inside a wide range — not yet a confirmed breakout
Volume Profile
Huge supply cluster at the top ($95–150) = heavy overhead resistance
Volume dried up during the long correction → healthy accumulation at the base
Current weekly volume (1.47M DASH) ticking up with the bounce → buyers returning
Key Levels
🟢 Support: $34.50–36.50 (MA cluster) | $28–30 (range low)
🔴 Resistance: $48–50 (local high) | $60–65 (breakdown zone)
📌 Trade Plan (Swing / Range-Low Reversal)
Entry: $38.50–40.00 (pullback into rising support)
SL: $33.80 (below MA cluster)
TP1: $48.00 → TP2: $60.00
R:R: ~1:2.5 to TP1, ~1:5 to TP2
Tip: Add on a confirmed weekly close above $50; invalidate below $33.80
⚠️ Not financial advice — manage risk, size positions properly.
$DASH #Crypto #BinanceSquare #PriceAction #Altcoins
Pair: DASH/USDT | TF: Weekly
Current Price: ~$40.83
Macro Picture
DASH ran a parabolic pump to $150 wick high, then a secondary lower high near $95–100
Months of downtrend compressed price back toward the $28–30 base
Now bouncing off that base, pushing back above key moving averages (MA7/25/99 cluster at $34.5–36.5)
Price Action (Weekly)
✅ Price reclaimed and holds above all three major MAs → bullish bias
✅ MA(7) turning up, crossing above MA(99) → early trend flip signal
⚠️ Still trading inside a wide range — not yet a confirmed breakout
Volume Profile
Huge supply cluster at the top ($95–150) = heavy overhead resistance
Volume dried up during the long correction → healthy accumulation at the base
Current weekly volume (1.47M DASH) ticking up with the bounce → buyers returning
Key Levels
🟢 Support: $34.50–36.50 (MA cluster) | $28–30 (range low)
🔴 Resistance: $48–50 (local high) | $60–65 (breakdown zone)
📌 Trade Plan (Swing / Range-Low Reversal)
Entry: $38.50–40.00 (pullback into rising support)
SL: $33.80 (below MA cluster)
TP1: $48.00 → TP2: $60.00
R:R: ~1:2.5 to TP1, ~1:5 to TP2
Tip: Add on a confirmed weekly close above $50; invalidate below $33.80
⚠️ Not financial advice — manage risk, size positions properly.
$DASH #Crypto #BinanceSquare #PriceAction #Altcoins