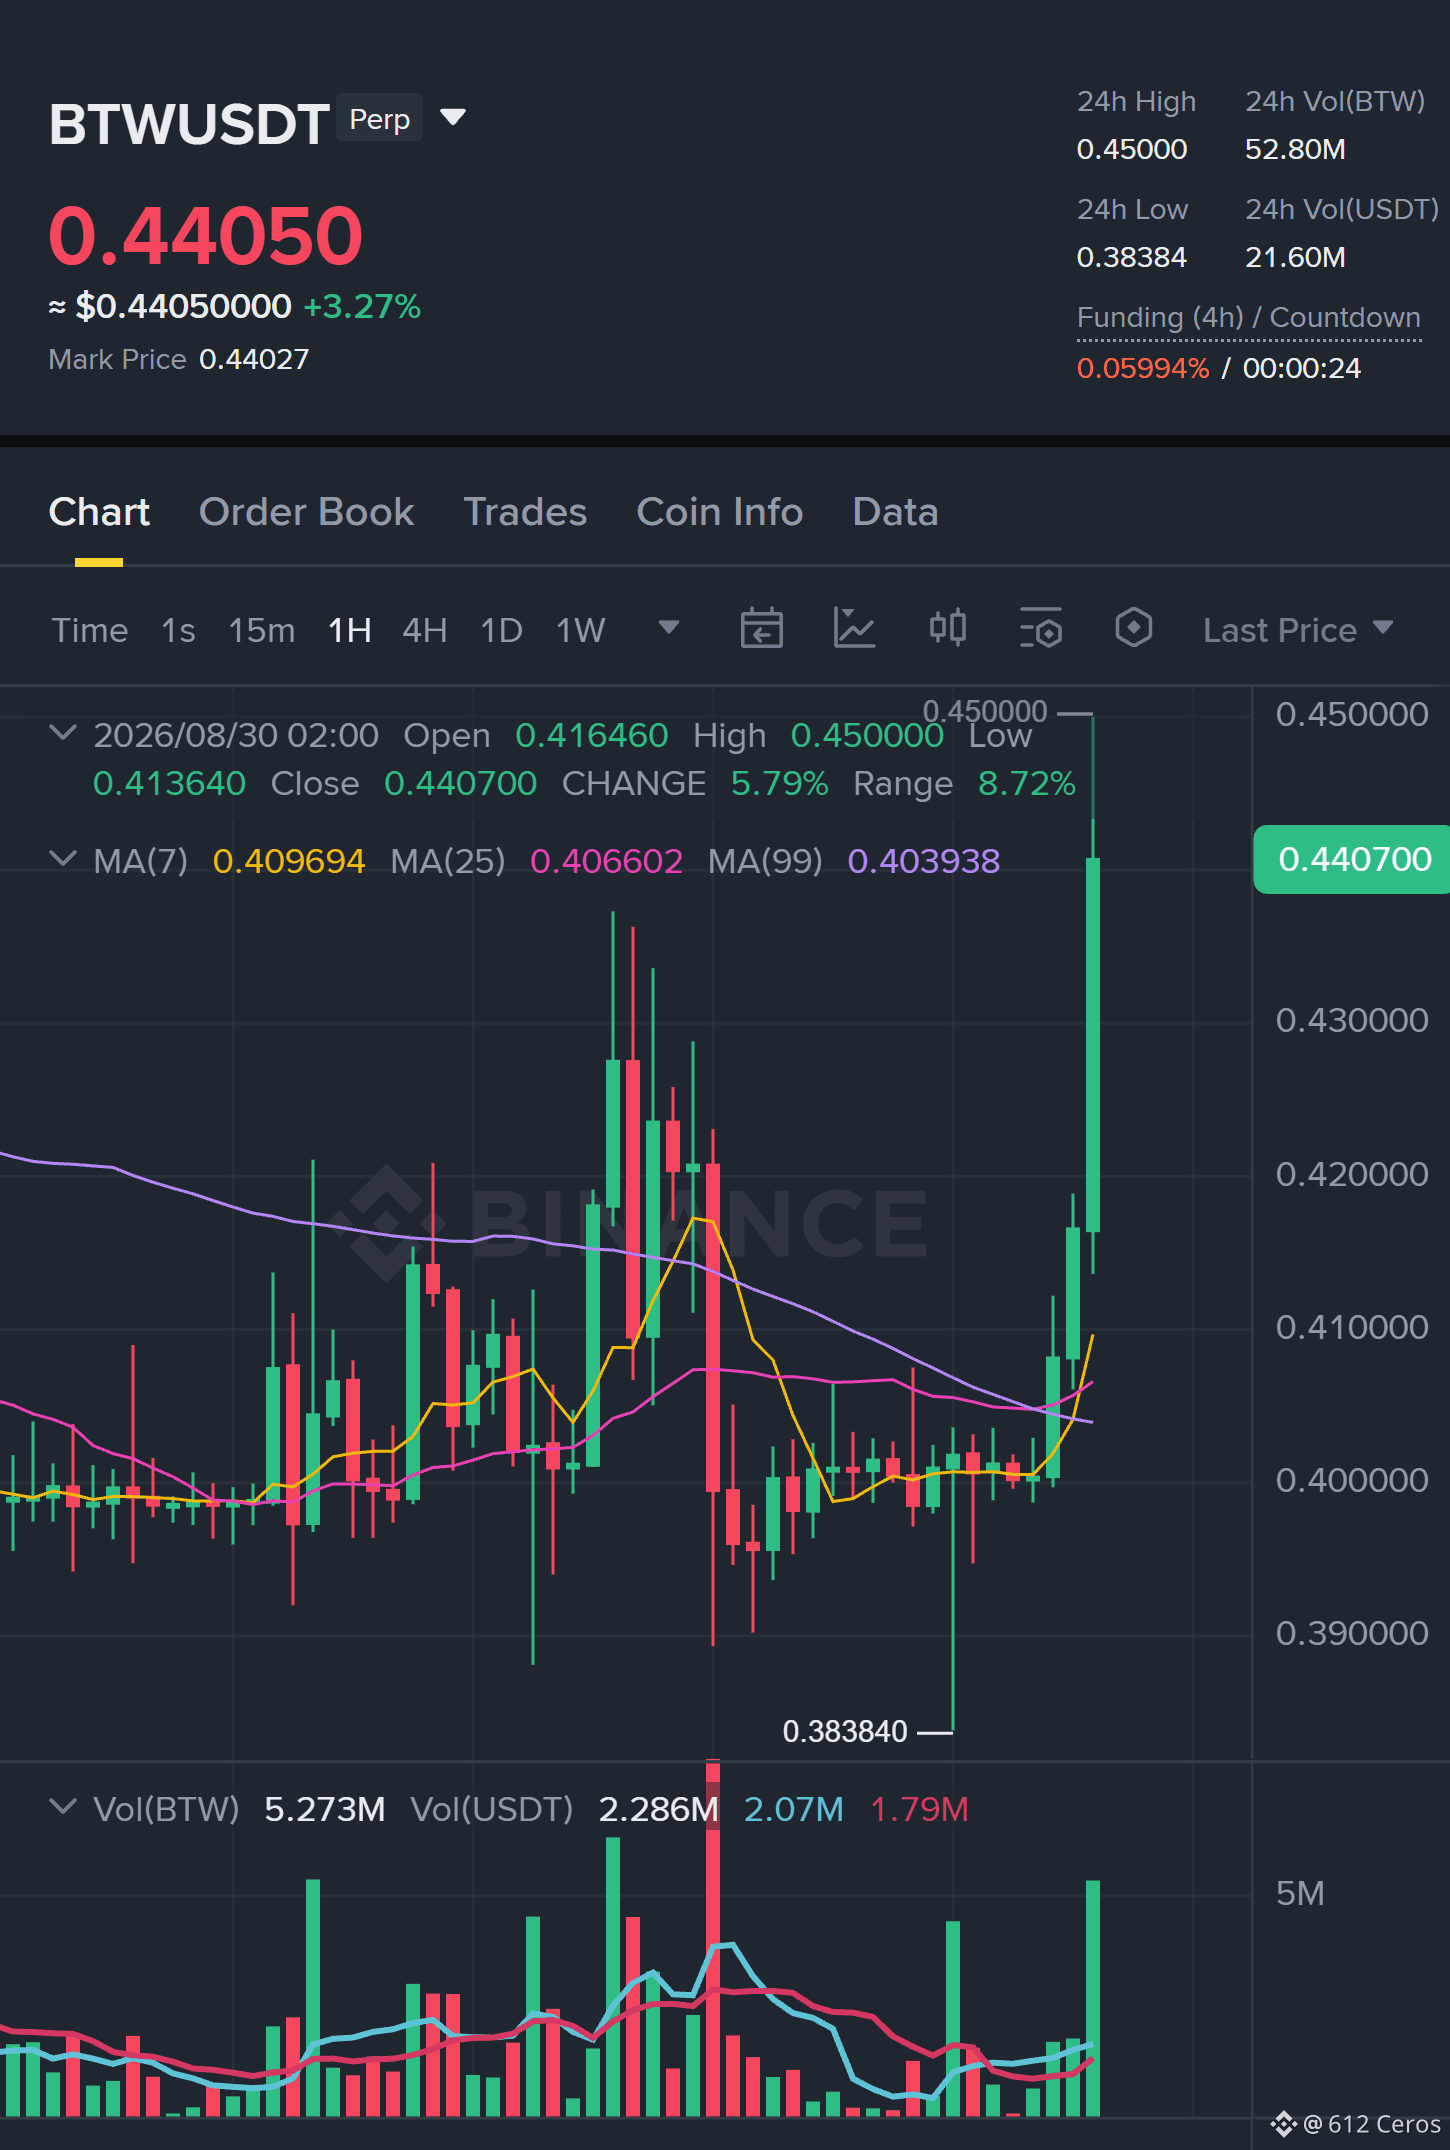
Everyone is staring at the 15-minute RSI screaming 78, but the real signal is hiding in the 4-hour structure.
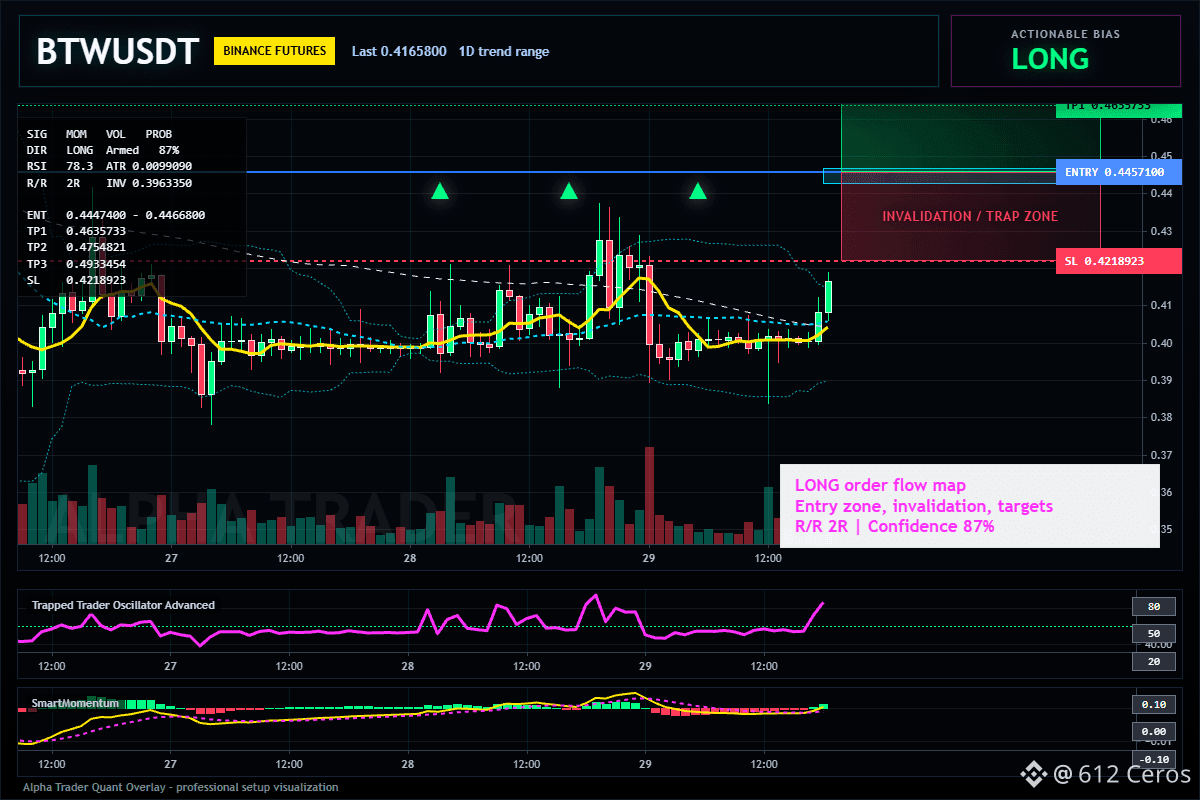
$BTW /USDT - 🟢 LONG · Conf 87%
Trade Plan:
Entry: 0.4447400 – 0.4466800
SL: 0.4218923
TP1: 0.4635733
TP2: 0.4754821
TP3: 0.4933454
Why this setup?
Why now? The local trend is your friend here, but the exhaustion is real. The 4-hour momentum says LONG with an 87% confidence score, yet the RSI on the 15-minute chart is already overheated at 78.34. This is a classic "trend continuation vs. sharp pullback" zone.
- The setup is Armed: entry at 0.4457100, with a tight window between 0.4447400 and 0.4466800.
- First target sits at 0.4635733 (a solid 4% move), but the bigger prize is TP2 at 0.4754821.
- The risk is defined: stop loss at 0.4218923. That is a 5.3% risk for a potential 6.7% reward on TP1. The math works, but only if you respect the invalidation level at 0.3963350.
- This is a trend-following bet, not a counter-trend gamble. The daily timeframe is in a range, so do not expect a straight line up. Volatility (ATR 1h) is 0.009909, meaning the candles are moving fast. If you hesitate, the entry window closes.
The edge is 3.8, which is significant. The market is giving you a chance to ride the 4-hour wave, but the 15-minute heat warns that the first push might be choppy. Patience for the pullback into the entry zone is key.
Debate:
Are you buying the 4-hour breakout at 0.4457, or waiting for the 15-minute RSI to cool down before you pull the trigger? Which camp are you in?
Click here to view the chart 👇️
⚠️ Personal market analysis only. NFA — manage risk and DYOR.
$BTW /USDT - 🟢 LONG · Conf 87%
Trade Plan:
Entry: 0.4447400 – 0.4466800
SL: 0.4218923
TP1: 0.4635733
TP2: 0.4754821
TP3: 0.4933454
Why this setup?
Why now? The local trend is your friend here, but the exhaustion is real. The 4-hour momentum says LONG with an 87% confidence score, yet the RSI on the 15-minute chart is already overheated at 78.34. This is a classic "trend continuation vs. sharp pullback" zone.
- The setup is Armed: entry at 0.4457100, with a tight window between 0.4447400 and 0.4466800.
- First target sits at 0.4635733 (a solid 4% move), but the bigger prize is TP2 at 0.4754821.
- The risk is defined: stop loss at 0.4218923. That is a 5.3% risk for a potential 6.7% reward on TP1. The math works, but only if you respect the invalidation level at 0.3963350.
- This is a trend-following bet, not a counter-trend gamble. The daily timeframe is in a range, so do not expect a straight line up. Volatility (ATR 1h) is 0.009909, meaning the candles are moving fast. If you hesitate, the entry window closes.
The edge is 3.8, which is significant. The market is giving you a chance to ride the 4-hour wave, but the 15-minute heat warns that the first push might be choppy. Patience for the pullback into the entry zone is key.
Debate:
Are you buying the 4-hour breakout at 0.4457, or waiting for the 15-minute RSI to cool down before you pull the trigger? Which camp are you in?
Click here to view the chart 👇️
⚠️ Personal market analysis only. NFA — manage risk and DYOR.