$NIL 🚨 This chart is showing a serious change in character.
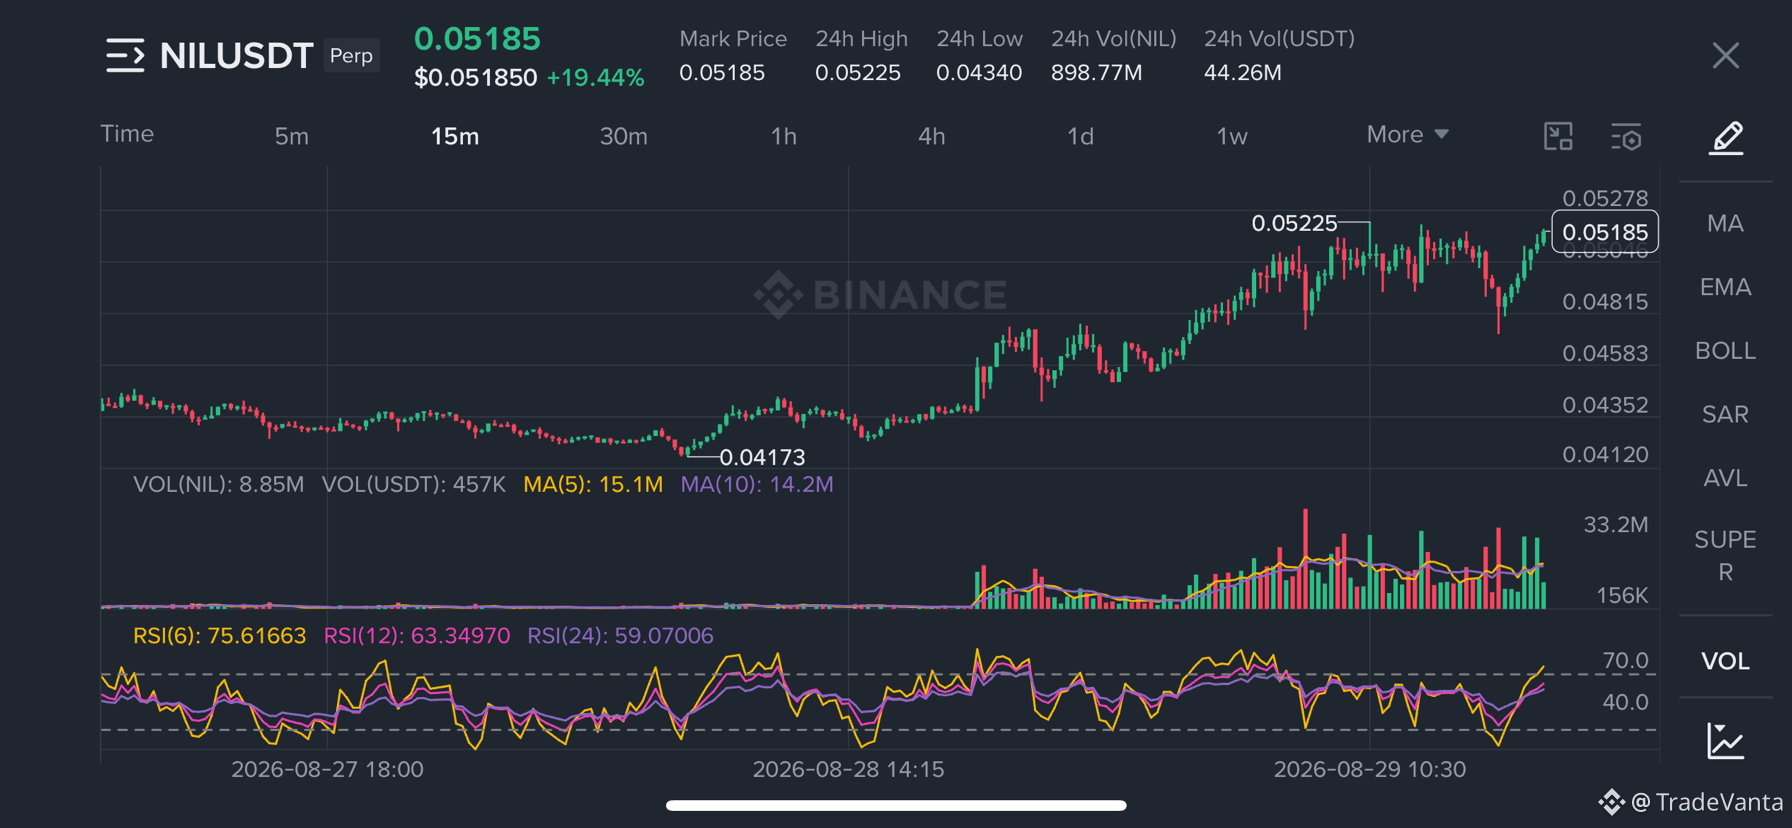
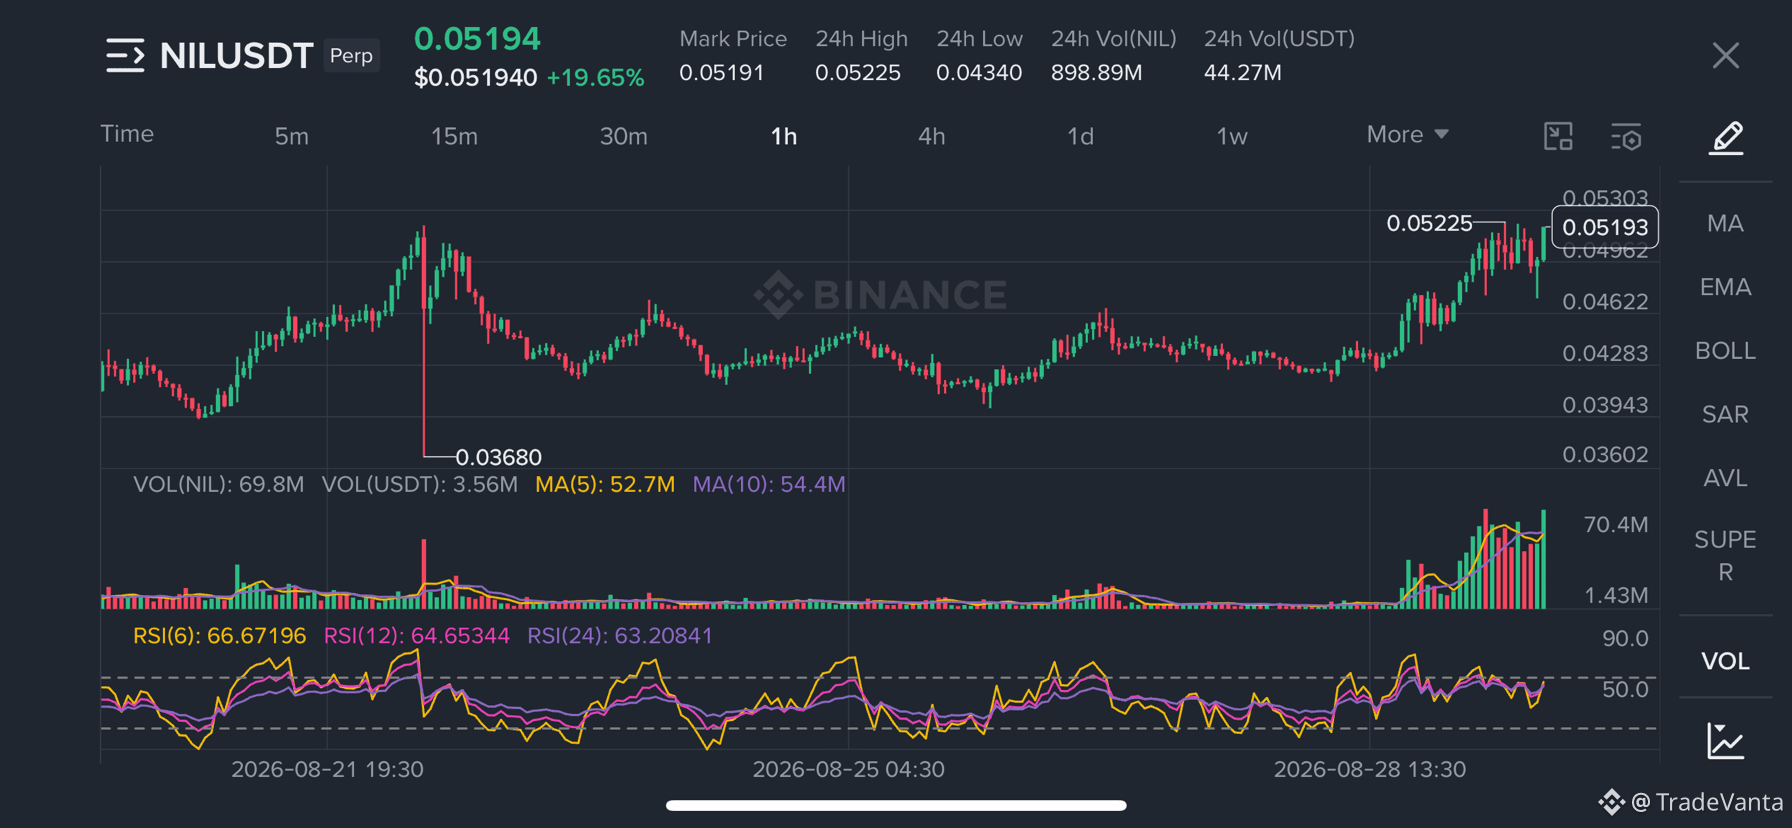
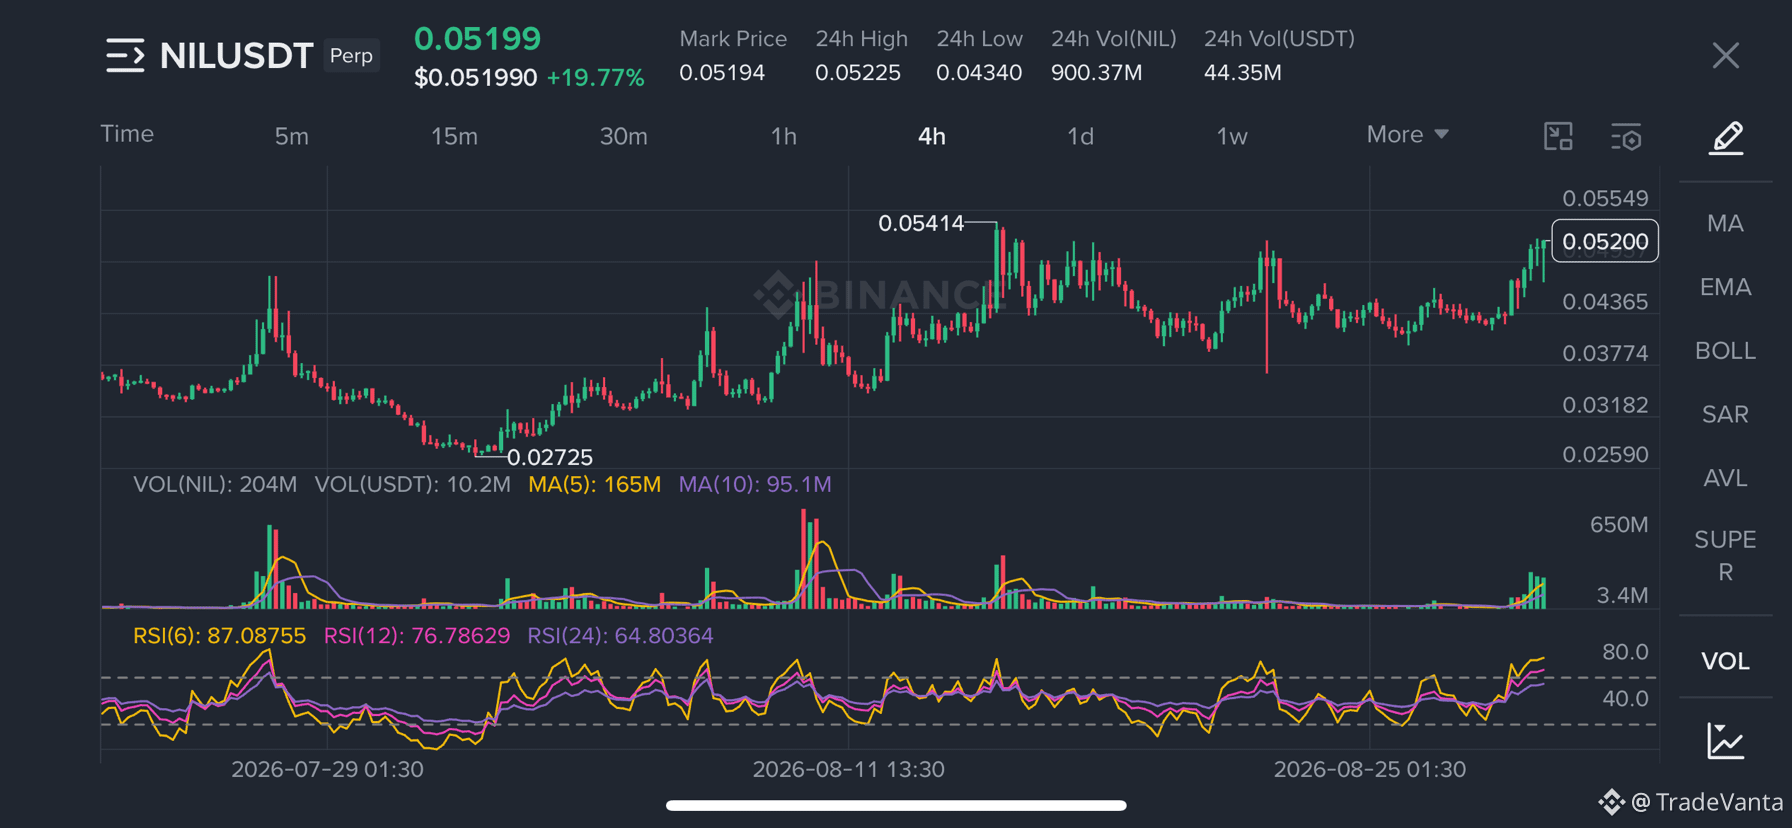
After spending weeks mostly ranging between roughly $0.04 and $0.05, NILUSDT has suddenly pushed into the $0.052 area, with the 1h and 4h charts showing strong green candles and a noticeable expansion in volume. The 4h RSI is already above 80, while the 15m RSI is also elevated — a sign that momentum is strong, but the move is getting stretched. 🔥
The interesting part is that price is now testing the recent highs around $0.05225–$0.05414. That zone could determine whether this becomes a sustained breakout or simply another rejection.
When momentum gets this hot, the key observation isn't how fast price can rise it's whether buyers can hold the new territory without immediately giving it back.
Watch $4 $CLO
After spending weeks mostly ranging between roughly $0.04 and $0.05, NILUSDT has suddenly pushed into the $0.052 area, with the 1h and 4h charts showing strong green candles and a noticeable expansion in volume. The 4h RSI is already above 80, while the 15m RSI is also elevated — a sign that momentum is strong, but the move is getting stretched. 🔥
The interesting part is that price is now testing the recent highs around $0.05225–$0.05414. That zone could determine whether this becomes a sustained breakout or simply another rejection.
When momentum gets this hot, the key observation isn't how fast price can rise it's whether buyers can hold the new territory without immediately giving it back.
Watch $4 $CLO