📊 Crypto Chart Analysis for Beginners | DUSK/USDT Technical Breakdown
Are green and red candles leaving you confused? Let's break down the DUSK/USDT 30-minute chart using simple levels and clear structure!
---
📈 Market Summary:
• Coin: DUSK / USDT
• Current Price: $0.0674 (-6.78%)
• 24h High / Low: $0.0729 / $0.0664
• 24h Volume: 11.39M DUSK (~$796.3K USDT)
---
📉 Chart Analysis:
1. Moving Averages (MA):
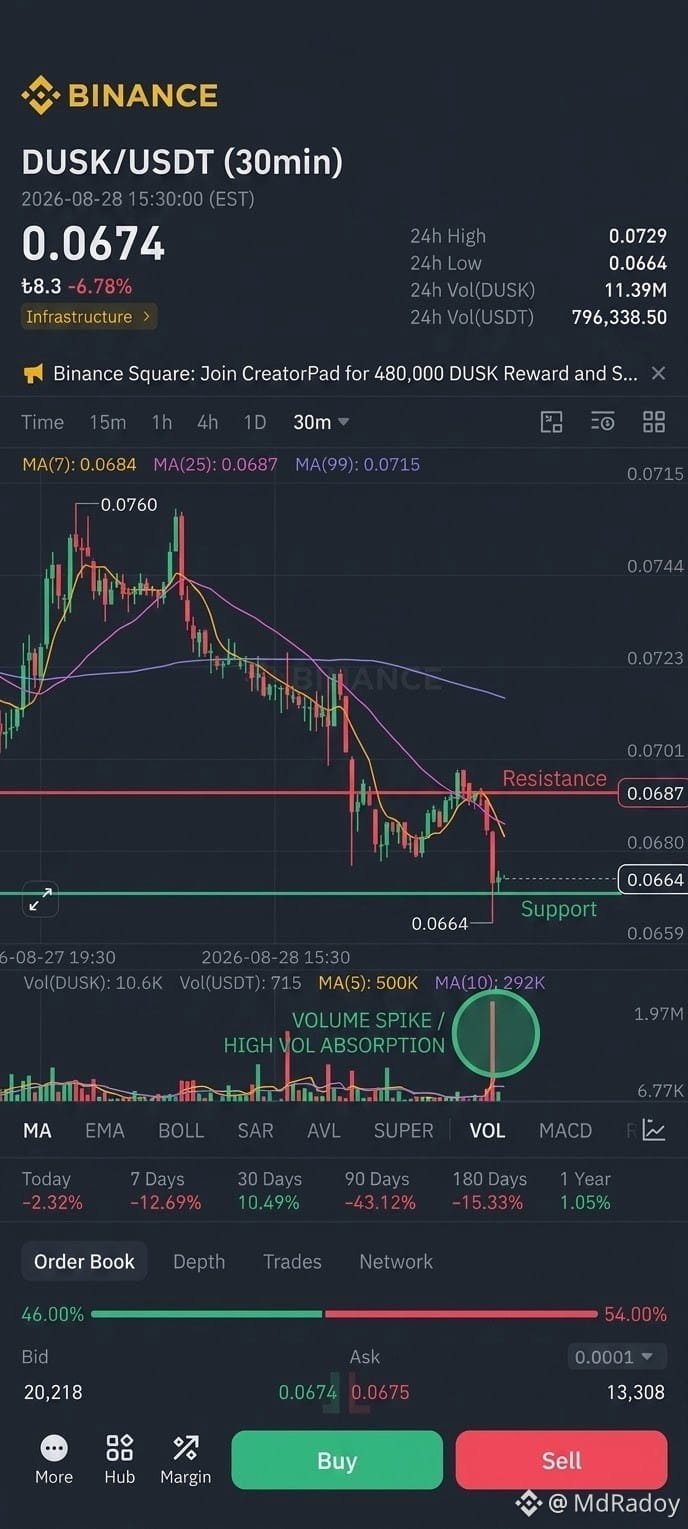
Price is currently trading below key short & mid-term moving averages (MA7: $0.0684, MA25: $0.0687, MA99: $0.0715). The cross down of MA7 & MA25 below MA99 indicates short-term bearish pressure.
2. Volume Absorption:
A massive red volume spike pushed the price down to the 24-hour low at $0.0664. However, the lower wick on the candlestick suggests buyers are attempting to absorb selling pressure at this support zone.
3. Key Levels to Watch:
• 🟢 Strong Support: $0.0664 (24h Low)
• 🟧 Key Resistance: $0.0687 (MA25 Level)
• 🔴 Major Resistance: $0.0715 (MA99 Level)
---
🎯 Short-Term Trade Strategy:
• Safe Entry (Breakout Play):
Wait for a 30m candle close above $0.0687. A successful retest opens a long setup toward $0.0700, $0.0715, and $0.0740 with a Stop Loss below $0.0660.
• High-Risk Entry (Dip Scalp):
Aggressive traders can play a quick rebound off the $0.0664 support level with a strict Stop Loss at $0.0658.
---
💬 What’s Your Take?
Will DUSK hold the $0.0664 support level for a bounce, or are we heading lower? Drop your thoughts below! 👇
#DUSK #CryptoTrading #TechnicalAnalysis
$DUSK
#BinanceSquare #CryptoAnalysis #TradingStrategy
(⚠️ Disclaimer: Educational content only, not financial advice. Always DO YOUR OWN RESEARCH (DYOR) and manage risk properly before entering any trade.)
Are green and red candles leaving you confused? Let's break down the DUSK/USDT 30-minute chart using simple levels and clear structure!
---
📈 Market Summary:
• Coin: DUSK / USDT
• Current Price: $0.0674 (-6.78%)
• 24h High / Low: $0.0729 / $0.0664
• 24h Volume: 11.39M DUSK (~$796.3K USDT)
---
📉 Chart Analysis:
1. Moving Averages (MA):
Price is currently trading below key short & mid-term moving averages (MA7: $0.0684, MA25: $0.0687, MA99: $0.0715). The cross down of MA7 & MA25 below MA99 indicates short-term bearish pressure.
2. Volume Absorption:
A massive red volume spike pushed the price down to the 24-hour low at $0.0664. However, the lower wick on the candlestick suggests buyers are attempting to absorb selling pressure at this support zone.
3. Key Levels to Watch:
• 🟢 Strong Support: $0.0664 (24h Low)
• 🟧 Key Resistance: $0.0687 (MA25 Level)
• 🔴 Major Resistance: $0.0715 (MA99 Level)
---
🎯 Short-Term Trade Strategy:
• Safe Entry (Breakout Play):
Wait for a 30m candle close above $0.0687. A successful retest opens a long setup toward $0.0700, $0.0715, and $0.0740 with a Stop Loss below $0.0660.
• High-Risk Entry (Dip Scalp):
Aggressive traders can play a quick rebound off the $0.0664 support level with a strict Stop Loss at $0.0658.
---
💬 What’s Your Take?
Will DUSK hold the $0.0664 support level for a bounce, or are we heading lower? Drop your thoughts below! 👇
#DUSK #CryptoTrading #TechnicalAnalysis
$DUSK
#BinanceSquare #CryptoAnalysis #TradingStrategy
(⚠️ Disclaimer: Educational content only, not financial advice. Always DO YOUR OWN RESEARCH (DYOR) and manage risk properly before entering any trade.)