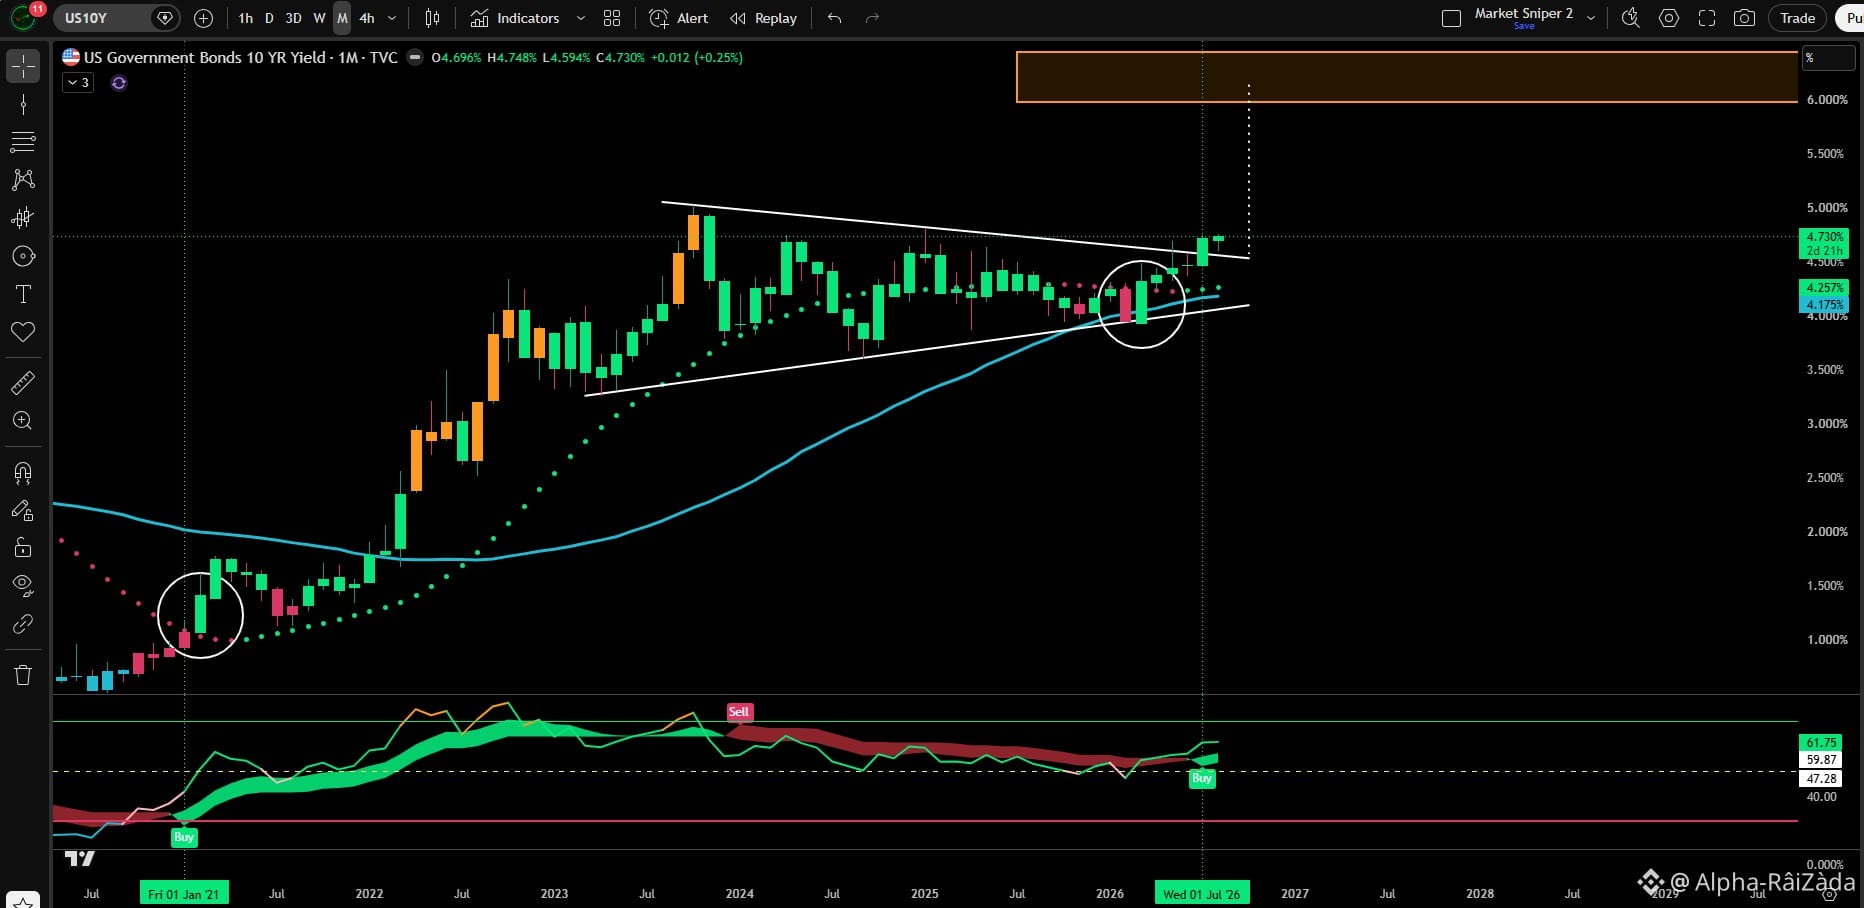
📈 🇺🇸 U.S. 10Y YIELD — BULLISH MONTHLY STRUCTURE
The U.S. 10-Year Treasury yield continues to show a bullish setup on the monthly chart.
🔥 Signals: • Bullish engulfing candle
• Monthly close above the downward trendline
• RSI has triggered a buy signal
📊 Current Yield: ~4.73%
🎯 Long-Term Watch: 6.00%
Historically, the previous RSI buy signal was followed by a move from roughly 1% to 5% over the next ~1,000 days.
⚠️ A move toward 6% is a scenario, not a certainty. Rising yields could have major implications for $XAU, BTC and $SPX, so keep an eye on rates.
🥇 $XAU | ₿ $BTC | 📈 $SPX
#XAU #BTC #SPX #TreasuryYields
The U.S. 10-Year Treasury yield continues to show a bullish setup on the monthly chart.
🔥 Signals: • Bullish engulfing candle
• Monthly close above the downward trendline
• RSI has triggered a buy signal
📊 Current Yield: ~4.73%
🎯 Long-Term Watch: 6.00%
Historically, the previous RSI buy signal was followed by a move from roughly 1% to 5% over the next ~1,000 days.
⚠️ A move toward 6% is a scenario, not a certainty. Rising yields could have major implications for $XAU, BTC and $SPX, so keep an eye on rates.
🥇 $XAU | ₿ $BTC | 📈 $SPX
#XAU #BTC #SPX #TreasuryYields