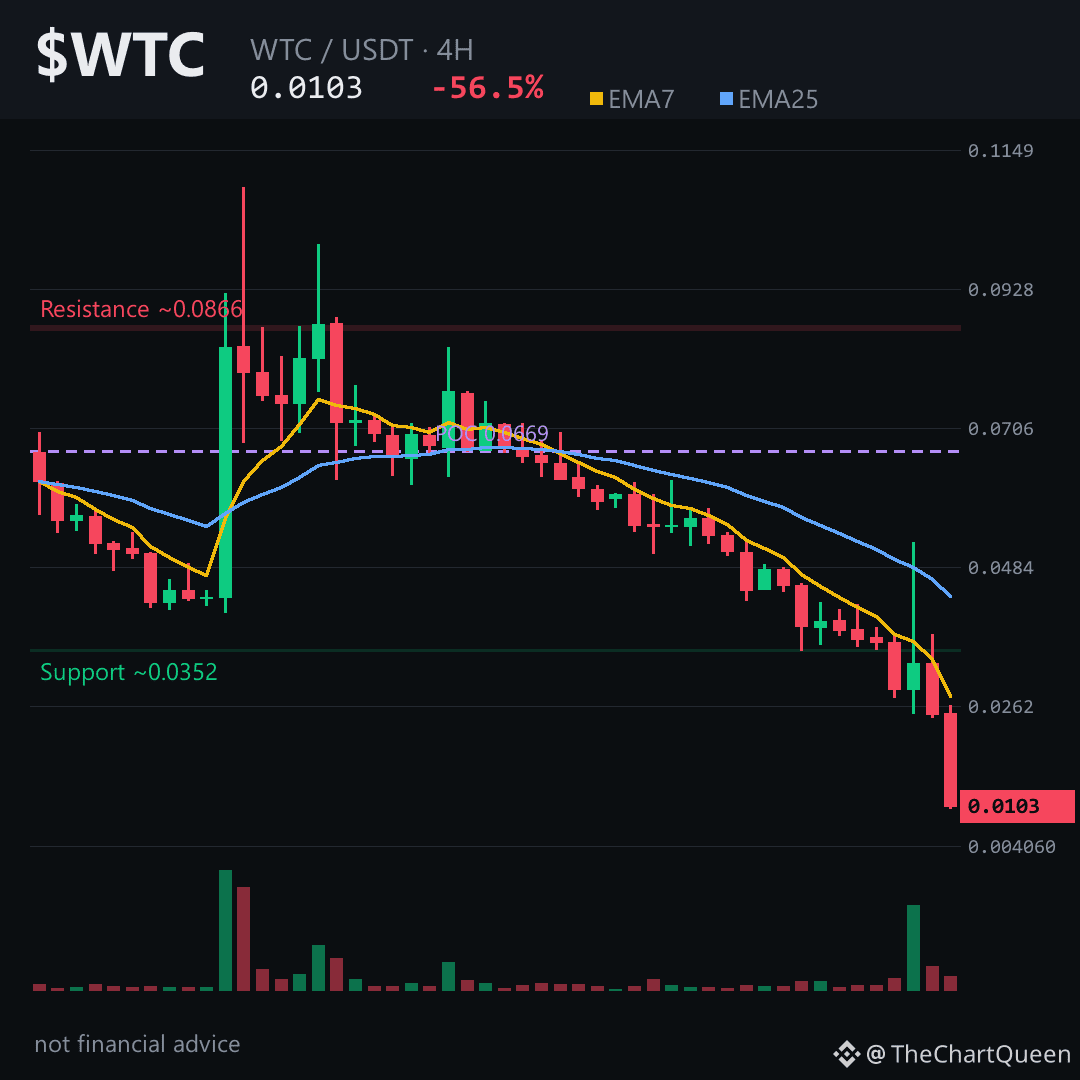
The 1‑day pivot around 0.0105 is already crumbling under a sea of red candles.
Read the hidden trap 👇
Price is stuck in a deep‑oversold zone (RSI ≈ 21) and the 7‑EMA sits well below the 25‑EMA, yet funding is neutral – no fee is rewarding longs to step in. The daily bearish FVG between 0.0577 and 0.0540 confirms sellers are still in control.
If $WTC slips through the ~0.0105 pivot and pierces the ~0.0113 invalidation, the next leg could head toward the ~0.0088 objective zone. Tap $WTC to pull up the chart and see these levels yourself.
My read: the bearish swing remains intact; a breach below the 0.0088 area would signal a deeper collapse.
Follow me for the next breakdown analysis when $WTC tests the 0.0113 barrier – I’ll break down what that move means.
What level do you think will hold WTC first, the 0.0105 area or the 0.0113 barrier? 👇
⚠️ Not financial advice. DYOR.
#WTC #Crypto #BinanceSquare #TopLoser
Read the hidden trap 👇
Price is stuck in a deep‑oversold zone (RSI ≈ 21) and the 7‑EMA sits well below the 25‑EMA, yet funding is neutral – no fee is rewarding longs to step in. The daily bearish FVG between 0.0577 and 0.0540 confirms sellers are still in control.
If $WTC slips through the ~0.0105 pivot and pierces the ~0.0113 invalidation, the next leg could head toward the ~0.0088 objective zone. Tap $WTC to pull up the chart and see these levels yourself.
My read: the bearish swing remains intact; a breach below the 0.0088 area would signal a deeper collapse.
Follow me for the next breakdown analysis when $WTC tests the 0.0113 barrier – I’ll break down what that move means.
What level do you think will hold WTC first, the 0.0105 area or the 0.0113 barrier? 👇
⚠️ Not financial advice. DYOR.
#WTC #Crypto #BinanceSquare #TopLoser