$BTC 3D TF
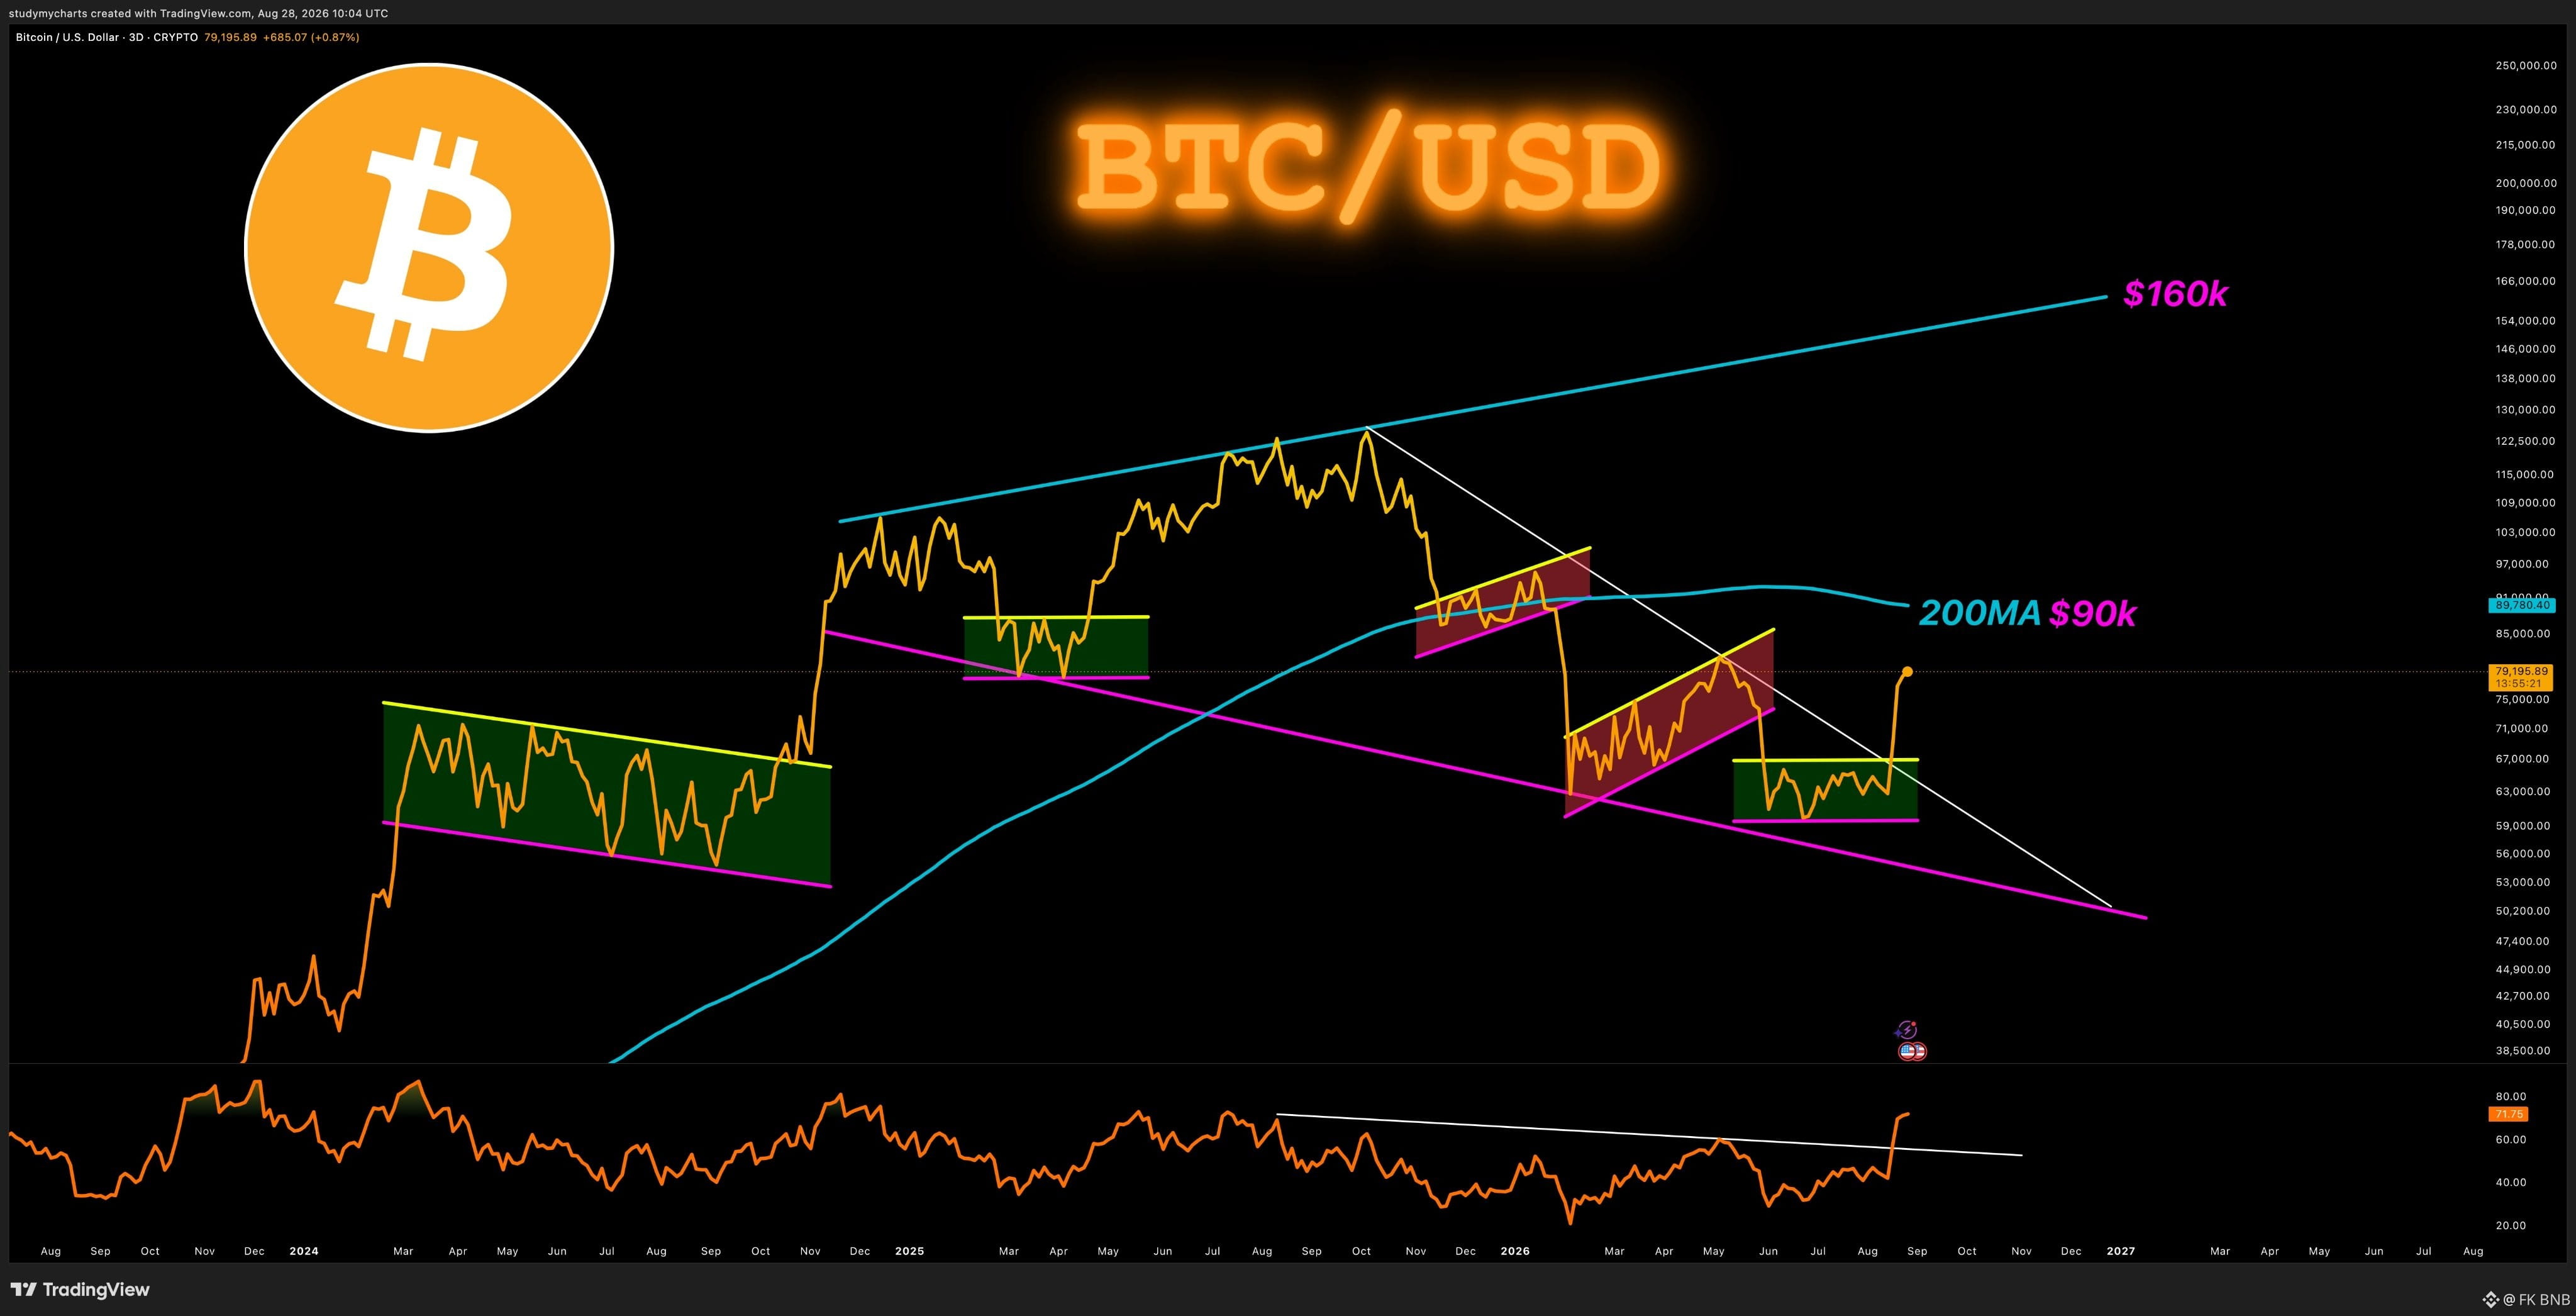
the lows have now printed a proper accumulation box, same green structure as the ranges that launched the previous legs
and price has broken out of it, straight through the white diagonal from the $126k top
RSI broke its descending trendline at the same time, momentum confirming
the sequence on this chart has repeated all cycle, green box → breakout → leg up
next level is the 200MA at $90k, above it the trendline runs to $160k
same structure, new leg
the lows have now printed a proper accumulation box, same green structure as the ranges that launched the previous legs
and price has broken out of it, straight through the white diagonal from the $126k top
RSI broke its descending trendline at the same time, momentum confirming
the sequence on this chart has repeated all cycle, green box → breakout → leg up
next level is the 200MA at $90k, above it the trendline runs to $160k
same structure, new leg