#cryptotradingpro #BTC
🔥$BTC /USD (4H): Market Overview and Key Levels
Bitcoin continues to push towards the psychological level of $80,000, but the momentum is fading on the 4-hour timeframe and the risk of a local correction is looming.
📊 What indicators and metrics show:
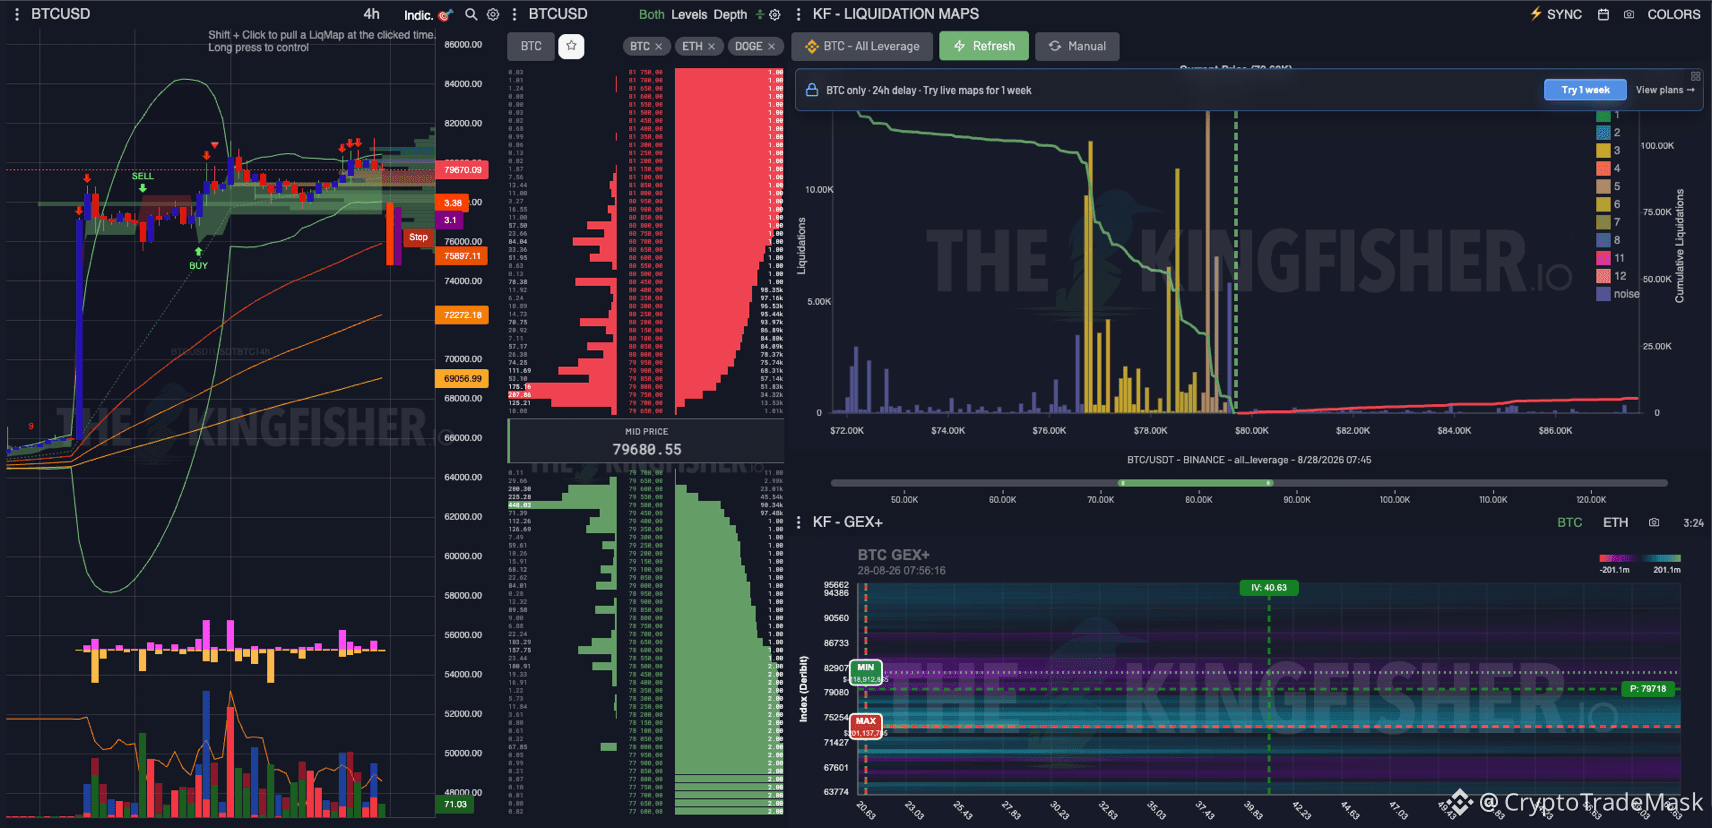
➡️ Price chart: Rebound from the upper Bollinger band + local sell signals near the resistance of $80,000–$81,500.
➡️ Liquidation Map: The main pool of short liquidity has already been removed. Instead, a massive cascade of long stops has accumulated from below in the range of $76,500–$79,000 and below in the $72,000–$75,000 zone. The market loves to go for liquidity.
➡️ Gamma Exposure (GEX+): The maximum gamma point is located in the $75,250 area, which acts as a strong magnet in case of a pullback.
🚦 Movement scenarios:
🔴 Priority (Liquidity withdrawal): A drop to $76,500 - $77,000 to knock out long players with shoulders. With a deeper drop, a test of the $75,000 - $75,500 support zone, where you should look for reversal setups.
🟢 Alternative (Breakthrough): A confident consolidation of the 4H candle above $80,200 will cancel the correction scenario and open the way to $82,000+.
⚠️ Summary: It is unprofitable to enter a long with the current risk/reward. The optimal strategy is to wait for the market to unload through the Liquidity Sweep in the $75,500–$77,000 zone and only then look for entry points with a short stop.
🔥$BTC /USD (4H): Market Overview and Key Levels
Bitcoin continues to push towards the psychological level of $80,000, but the momentum is fading on the 4-hour timeframe and the risk of a local correction is looming.
📊 What indicators and metrics show:
➡️ Price chart: Rebound from the upper Bollinger band + local sell signals near the resistance of $80,000–$81,500.
➡️ Liquidation Map: The main pool of short liquidity has already been removed. Instead, a massive cascade of long stops has accumulated from below in the range of $76,500–$79,000 and below in the $72,000–$75,000 zone. The market loves to go for liquidity.
➡️ Gamma Exposure (GEX+): The maximum gamma point is located in the $75,250 area, which acts as a strong magnet in case of a pullback.
🚦 Movement scenarios:
🔴 Priority (Liquidity withdrawal): A drop to $76,500 - $77,000 to knock out long players with shoulders. With a deeper drop, a test of the $75,000 - $75,500 support zone, where you should look for reversal setups.
🟢 Alternative (Breakthrough): A confident consolidation of the 4H candle above $80,200 will cancel the correction scenario and open the way to $82,000+.
⚠️ Summary: It is unprofitable to enter a long with the current risk/reward. The optimal strategy is to wait for the market to unload through the Liquidity Sweep in the $75,500–$77,000 zone and only then look for entry points with a short stop.