🚀 $SOL Bulls Are Testing the Breakout Zone — Can This Rally Continue? 🔥
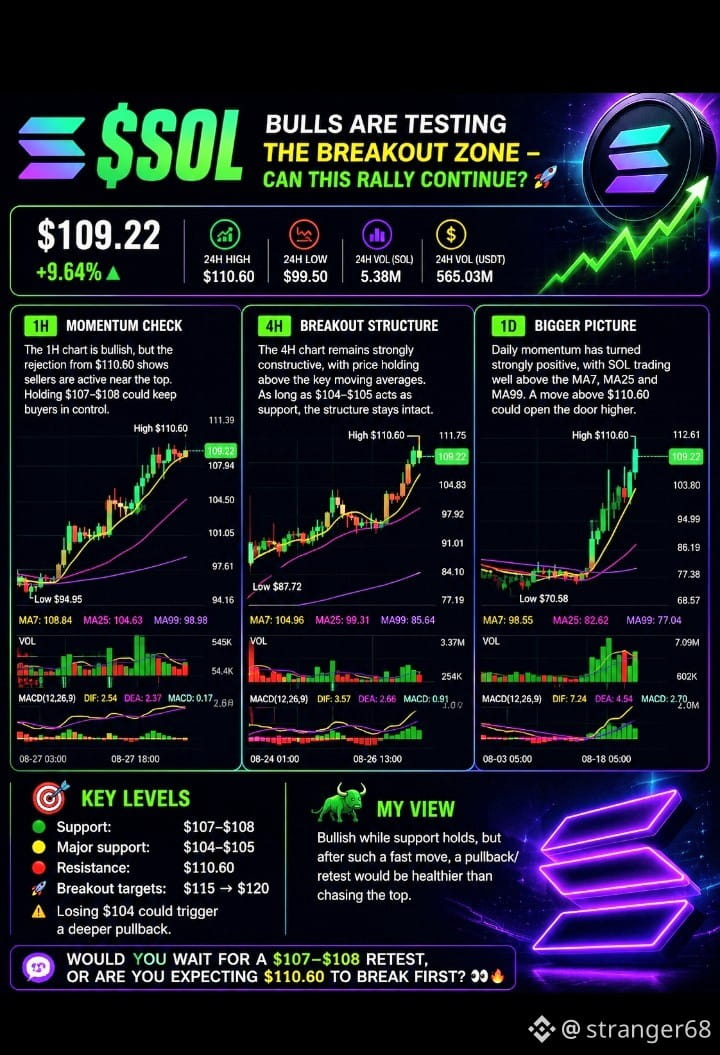
$SOL is showing strong bullish momentum, with price around $109.22 after a sharp move from the $70.58 area. Volume has expanded heavily, while all three timeframes are showing improving momentum. 📈
⏱️ 1H — Momentum Check
The 1H chart is bullish, but the rejection from $110.60 shows sellers are active near the top. Holding $107–$108 could keep buyers in control and give SOL another shot at the resistance. 👀
📊 4H — Breakout Structure
The 4H chart remains strongly constructive, with price holding above the key moving averages. As long as $104–$105 acts as support, the current bullish structure remains intact. 🔥
🌍 1D — Bigger Picture
Daily momentum has turned strongly positive, with SOL trading well above the MA7, MA25 and MA99. A sustained move above $110.60 could open the door toward $115–$120. 🚀
🎯 Key Levels
🟢 Support: $107–$108
🟡 Major support: $104–$105
🔴 Resistance: $110.60
🚀 Breakout targets: $115 → $120
⚠️ Losing $104 could trigger a deeper pullback.
📈 My view: Bullish while support holds, but after such a fast move, a pullback/retest would be healthier than chasing the top.
Would you wait for a $107–$108 retest, or are you expecting $110.60 to break first? 👀🔥
#XRPLeadsCryptoPullbackDropsNearly7% #ChinaOpposesUSProposed7.5%Tariff #DollarPostsBiggestGainInNearlyFourWeeks #BankOfKoreaHikesRatesTo3%
$SOL is showing strong bullish momentum, with price around $109.22 after a sharp move from the $70.58 area. Volume has expanded heavily, while all three timeframes are showing improving momentum. 📈
⏱️ 1H — Momentum Check
The 1H chart is bullish, but the rejection from $110.60 shows sellers are active near the top. Holding $107–$108 could keep buyers in control and give SOL another shot at the resistance. 👀
📊 4H — Breakout Structure
The 4H chart remains strongly constructive, with price holding above the key moving averages. As long as $104–$105 acts as support, the current bullish structure remains intact. 🔥
🌍 1D — Bigger Picture
Daily momentum has turned strongly positive, with SOL trading well above the MA7, MA25 and MA99. A sustained move above $110.60 could open the door toward $115–$120. 🚀
🎯 Key Levels
🟢 Support: $107–$108
🟡 Major support: $104–$105
🔴 Resistance: $110.60
🚀 Breakout targets: $115 → $120
⚠️ Losing $104 could trigger a deeper pullback.
📈 My view: Bullish while support holds, but after such a fast move, a pullback/retest would be healthier than chasing the top.
Would you wait for a $107–$108 retest, or are you expecting $110.60 to break first? 👀🔥
#XRPLeadsCryptoPullbackDropsNearly7% #ChinaOpposesUSProposed7.5%Tariff #DollarPostsBiggestGainInNearlyFourWeeks #BankOfKoreaHikesRatesTo3%