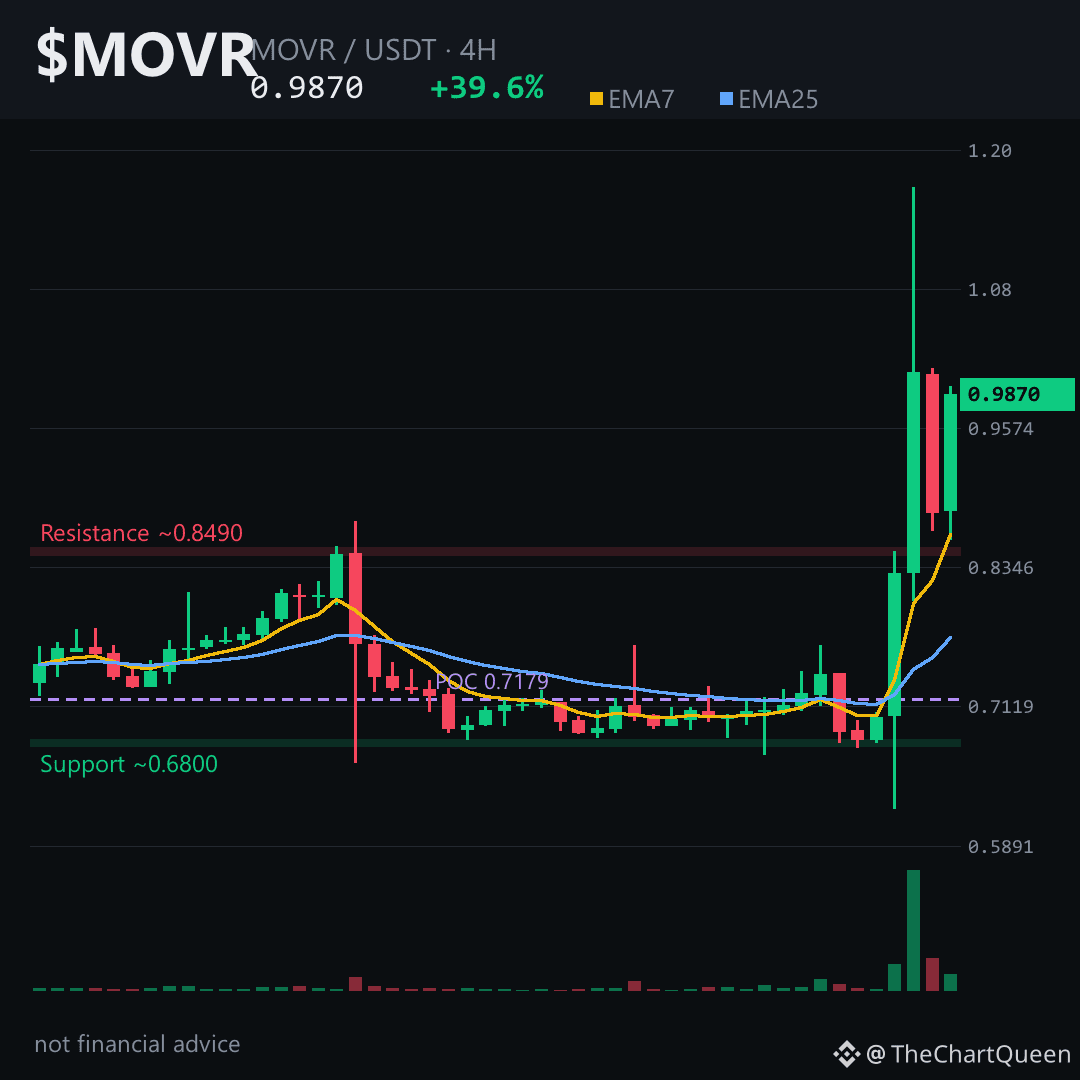
A 39% 24h surge left $MOVR teetering on a thin 0.98 band.
If the next candle wipes that floor, the story changes fast 👇
Price is riding a bullish 4‑hour EMA crossover (EMA7 ≈ 0.86 vs EMA25 ≈ 0.77) and RSI sits near 70, but funding is positive and the long/short ratio sits at 1.32 – longs are paying to stay in, a warning that leverage is humming. A slip below the 0.93‑zone could erase today’s gains.
On the 4H chart the current area hovers around the 0.98 zone.
The read crumbles if $MOVR falls through the ~0.93 level on a 4H close.
If it holds, the next target is the ~1.07 objective zone. Tap $MOVR to pull up the chart and eyeball those levels yourself.
My read: the market is testing the ceiling; a break toward 1.07 would confirm strength, while a dip under 0.93 flips the bias bearish.
Follow me for the next update when MOVR tests either side of that range – I’ll break down what the move means for the longer swing.
Which zone are you watching on MOVR? 👇
⚠️ Not financial advice. DYOR.
#MOVR #Crypto #BinanceSquare #TopGainer
If the next candle wipes that floor, the story changes fast 👇
Price is riding a bullish 4‑hour EMA crossover (EMA7 ≈ 0.86 vs EMA25 ≈ 0.77) and RSI sits near 70, but funding is positive and the long/short ratio sits at 1.32 – longs are paying to stay in, a warning that leverage is humming. A slip below the 0.93‑zone could erase today’s gains.
On the 4H chart the current area hovers around the 0.98 zone.
The read crumbles if $MOVR falls through the ~0.93 level on a 4H close.
If it holds, the next target is the ~1.07 objective zone. Tap $MOVR to pull up the chart and eyeball those levels yourself.
My read: the market is testing the ceiling; a break toward 1.07 would confirm strength, while a dip under 0.93 flips the bias bearish.
Follow me for the next update when MOVR tests either side of that range – I’ll break down what the move means for the longer swing.
Which zone are you watching on MOVR? 👇
⚠️ Not financial advice. DYOR.
#MOVR #Crypto #BinanceSquare #TopGainer