$ETH Latest Analysis: Testing Key Levels and Seeking a Direction
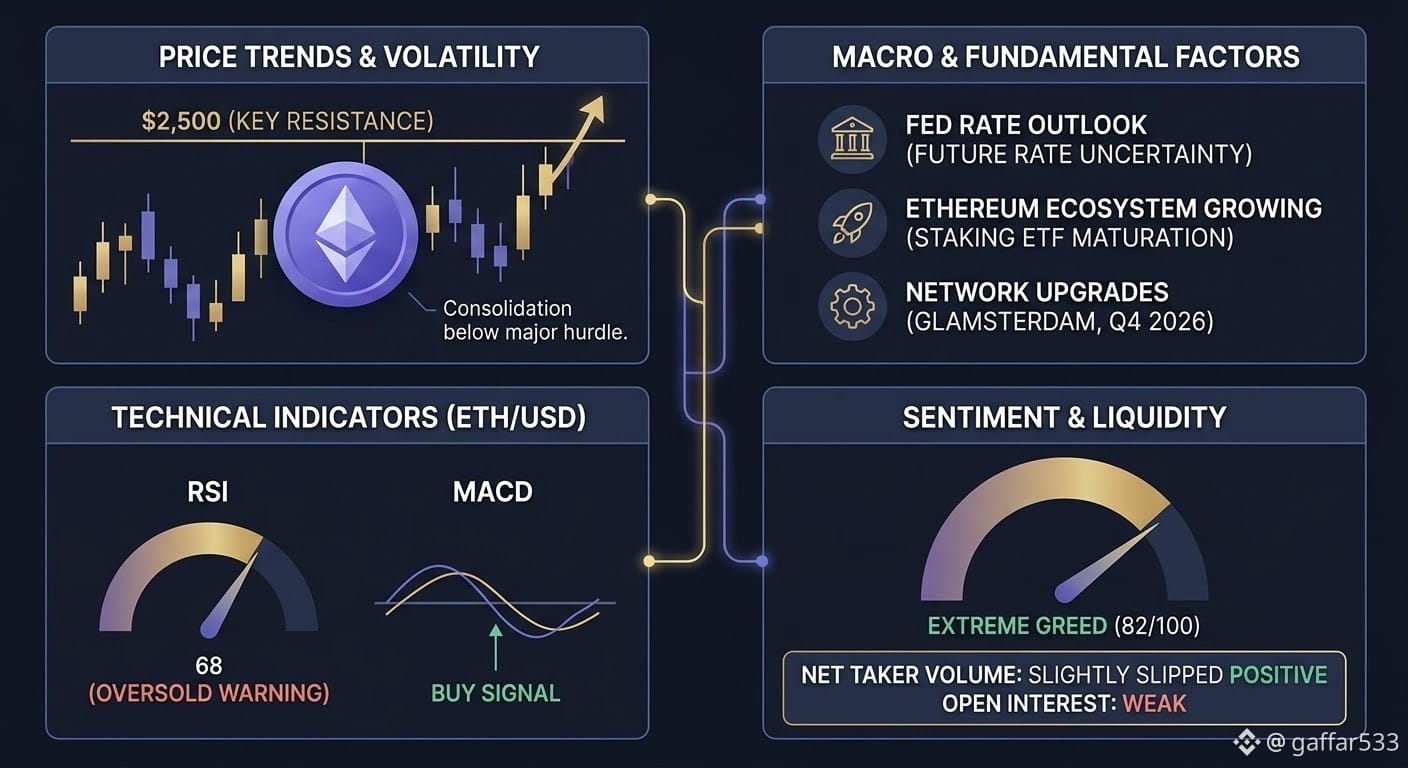
As of late August 2026, Ethereum is navigating a critical juncture. After recent volatility, the price is consolidating just below a significant resistance zone, around $2,500. This period of sideways movement follows a larger weekly breakout that has shifted the near-term outlook from cautious to cautiously bullish.
Key Technical Observations:
Resistance at $2,500: The most important immediate milestone. Multiple technical and psychological factors align at this level. A decisive, high-volume close above it could trigger a strong leg up, potentially targeting $2,800 or higher.
Support at $2,431 & $1,927: Should a pullback occur, the $2,431 level (a prior key indicator) acts as the first line of defense. Below that, the $1,927 area (near the 100-day moving average) provides significant structural support.
Mixed Indicators: Recent technical reads, including the MACD, suggest a 'buy' signal, while others like the RSI hint that the asset might be temporarily 'overbought', calling for patience.
Macro and Fundamental Factors:
While Bitcoin recently stole the spotlight by breaching $80,000, Ethereum is benefiting from its own ecosystem maturation. Recent rebrands of ETH ETFs to highlight staking yield and international progress in ETF regulation (e.g., Thailand) are long-term positives, signaling growing institutional demand. Furthermore, the constant evolution of the network, including the upcoming Glamsterdam upgrade, keeps the narrative of continuous improvement alive.
Outlook:
Ethereum is in a wait-and-see phase. We anticipate increased volatility around the $2,500 test. Traders should watch for a confirmation break with strong volume. The market sentiment is leaning bullish, but profit-taking or a fail at key resistance remains a risk.
Ethereum (ETH) Market Context Diagram
(Note: This diagram is for illustrative purposes and does not represent real-time data.)
#Ethereum #ETH🔥🔥🔥🔥🔥🔥 #ETHETFS
As of late August 2026, Ethereum is navigating a critical juncture. After recent volatility, the price is consolidating just below a significant resistance zone, around $2,500. This period of sideways movement follows a larger weekly breakout that has shifted the near-term outlook from cautious to cautiously bullish.
Key Technical Observations:
Resistance at $2,500: The most important immediate milestone. Multiple technical and psychological factors align at this level. A decisive, high-volume close above it could trigger a strong leg up, potentially targeting $2,800 or higher.
Support at $2,431 & $1,927: Should a pullback occur, the $2,431 level (a prior key indicator) acts as the first line of defense. Below that, the $1,927 area (near the 100-day moving average) provides significant structural support.
Mixed Indicators: Recent technical reads, including the MACD, suggest a 'buy' signal, while others like the RSI hint that the asset might be temporarily 'overbought', calling for patience.
Macro and Fundamental Factors:
While Bitcoin recently stole the spotlight by breaching $80,000, Ethereum is benefiting from its own ecosystem maturation. Recent rebrands of ETH ETFs to highlight staking yield and international progress in ETF regulation (e.g., Thailand) are long-term positives, signaling growing institutional demand. Furthermore, the constant evolution of the network, including the upcoming Glamsterdam upgrade, keeps the narrative of continuous improvement alive.
Outlook:
Ethereum is in a wait-and-see phase. We anticipate increased volatility around the $2,500 test. Traders should watch for a confirmation break with strong volume. The market sentiment is leaning bullish, but profit-taking or a fail at key resistance remains a risk.
Ethereum (ETH) Market Context Diagram
(Note: This diagram is for illustrative purposes and does not represent real-time data.)
#Ethereum #ETH🔥🔥🔥🔥🔥🔥 #ETHETFS