🚀 LINK IS HOLDING A MAJOR BREAKOUT
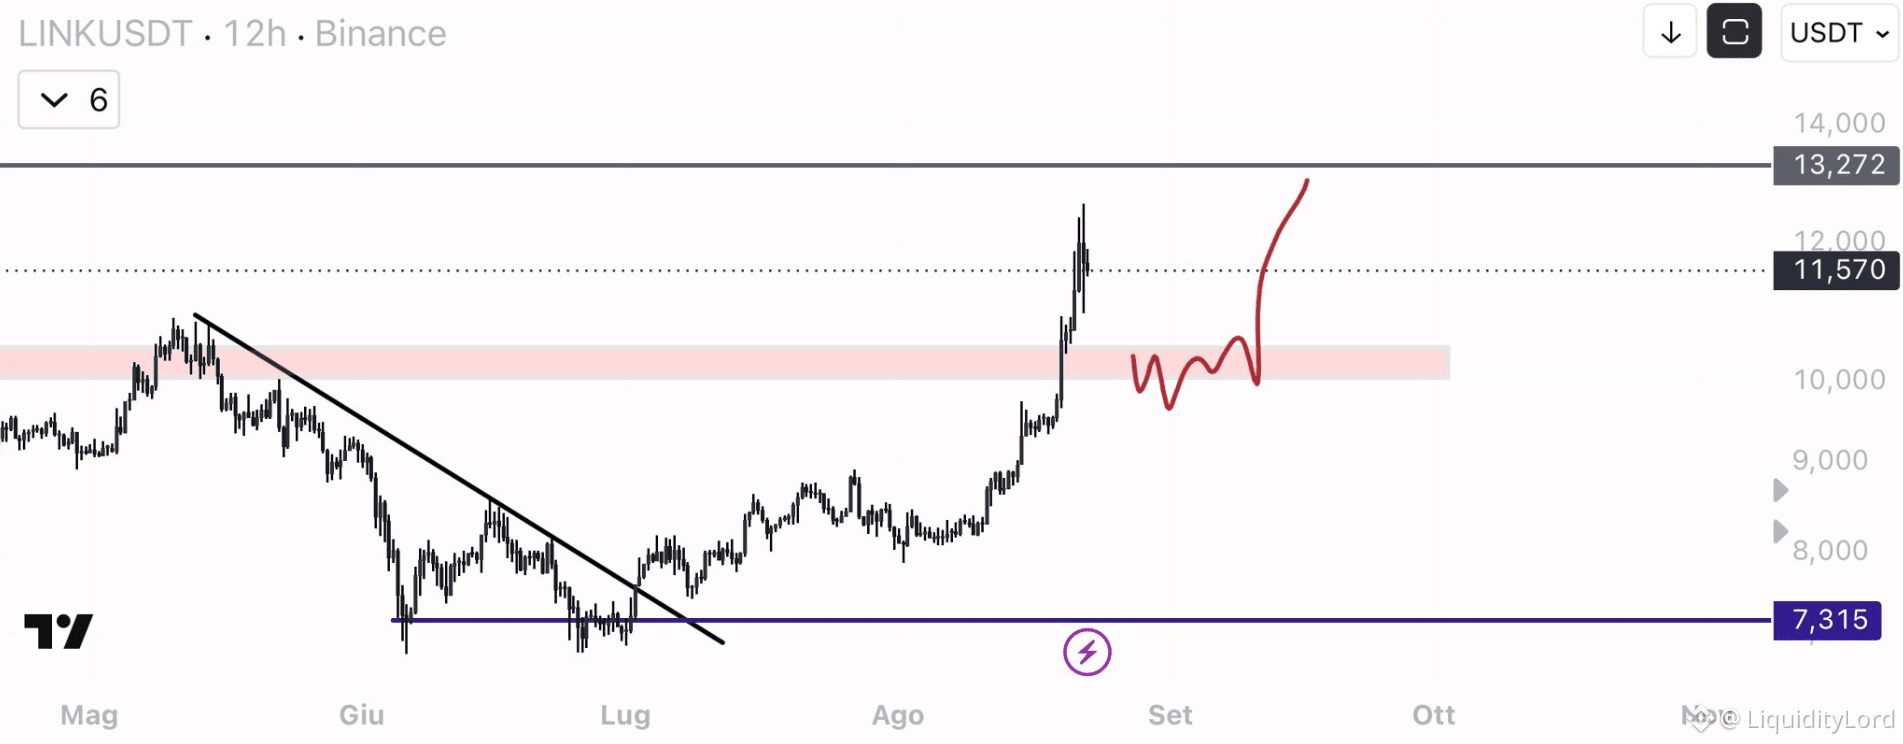
LINK trades near 11.57 after a powerful move from the 7.31 base. The 12h chart shows a clear reversal: price broke the descending trendline, reclaimed the 10.0-10.4 zone and accelerated toward 12.0. Now the key question is whether the breakout can become support.
📊 STRUCTURE CHECK
The main area to watch is 10.0-10.4. After such a sharp expansion, a pullback into this zone would be constructive if buyers defend it. The 11.57 area is the immediate reaction point, but chasing the vertical move is not my preference.
🎯 TARGET MAP
- TP1: 12.00
- TP2: 12.60
- TP3: 13.27
- Stop Loss: 9.80
TP1 is the nearby psychological resistance. TP2 is the next extension, while 13.27 is the major marked resistance. A clean move through each level would confirm continued momentum.
⚠ INVALIDATION
The setup weakens if LINK loses 10.0 and turns the breakout zone back into resistance. Below 9.80, the continuation thesis is invalidated and 9.0 could become the next downside area.
⚙ EXECUTION VIEW
STONfi is relevant to execution, not the LINK thesis. Competitive RFQ resolvers can compete for quotes across fragmented liquidity, while Omniston uses HTLC-style settlement for cross-chain execution.
🔎 MY PLAN
I would rather see a controlled retracement toward 10.0-10.4 than chase 11.57. If buyers defend that zone and reclaim the local high, the path toward 12.0 and 12.6 becomes cleaner.
A direct break above 12.0 with strong volume could accelerate the move toward 13.27, but after a vertical rally the probability of a sharp pullback also rises.
The key is acceptance, not excitement. If the old resistance becomes support, the structure shifts from recovery into continuation.
STONfi can improve execution efficiency, but it does not change the technical thesis. For LINK, I want confirmation before getting aggressive.
NFA - DYOR Stay selective
$LINK
LINK trades near 11.57 after a powerful move from the 7.31 base. The 12h chart shows a clear reversal: price broke the descending trendline, reclaimed the 10.0-10.4 zone and accelerated toward 12.0. Now the key question is whether the breakout can become support.
📊 STRUCTURE CHECK
The main area to watch is 10.0-10.4. After such a sharp expansion, a pullback into this zone would be constructive if buyers defend it. The 11.57 area is the immediate reaction point, but chasing the vertical move is not my preference.
🎯 TARGET MAP
- TP1: 12.00
- TP2: 12.60
- TP3: 13.27
- Stop Loss: 9.80
TP1 is the nearby psychological resistance. TP2 is the next extension, while 13.27 is the major marked resistance. A clean move through each level would confirm continued momentum.
⚠ INVALIDATION
The setup weakens if LINK loses 10.0 and turns the breakout zone back into resistance. Below 9.80, the continuation thesis is invalidated and 9.0 could become the next downside area.
⚙ EXECUTION VIEW
STONfi is relevant to execution, not the LINK thesis. Competitive RFQ resolvers can compete for quotes across fragmented liquidity, while Omniston uses HTLC-style settlement for cross-chain execution.
🔎 MY PLAN
I would rather see a controlled retracement toward 10.0-10.4 than chase 11.57. If buyers defend that zone and reclaim the local high, the path toward 12.0 and 12.6 becomes cleaner.
A direct break above 12.0 with strong volume could accelerate the move toward 13.27, but after a vertical rally the probability of a sharp pullback also rises.
The key is acceptance, not excitement. If the old resistance becomes support, the structure shifts from recovery into continuation.
STONfi can improve execution efficiency, but it does not change the technical thesis. For LINK, I want confirmation before getting aggressive.
NFA - DYOR Stay selective
$LINK