$HEMI HEMIUSDT Price Analysis: Symmetrical Triangle Breakout, Demand Zone & Key Levels to Watch
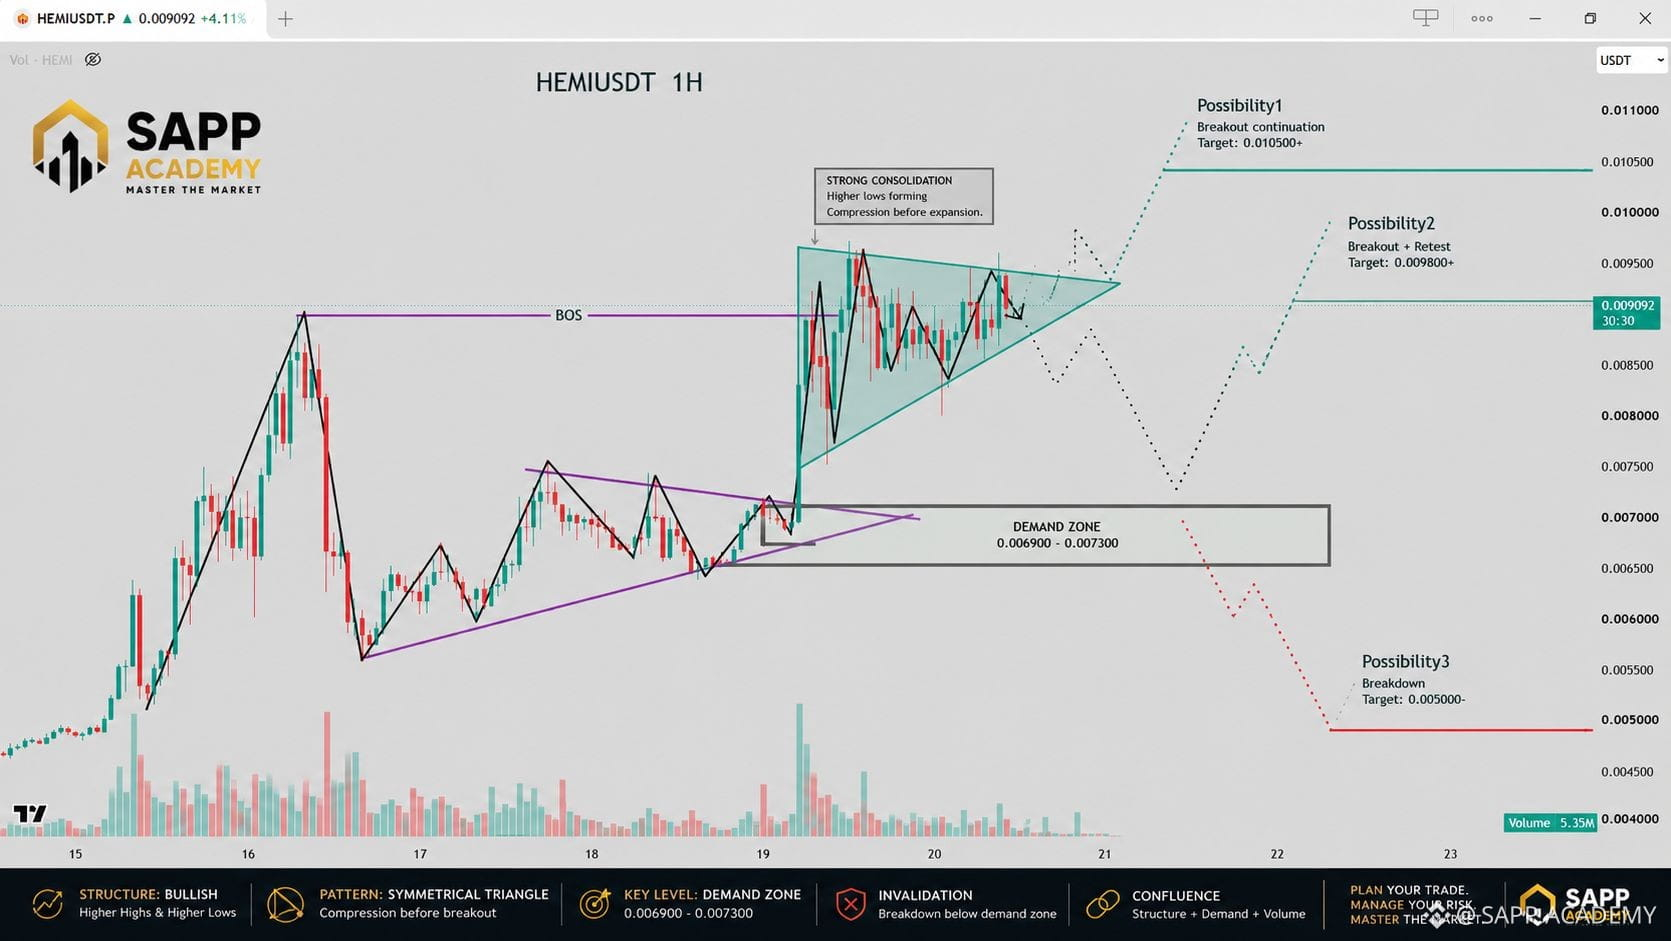
After the bullish BOS, price pushed higher and is now consolidating inside a symmetrical triangle.
The key area I’m watching is the 0.0069–0.0073 demand zone.
There are 3 possible scenarios:
🟢 Bullish: Triangle breakout → continuation toward the next liquidity area.
🟡 Breakout + retest: Breakout, then a retest before continuation.
🔴 Bearish: Breakdown → demand zone becomes the key invalidation area.
I’m not interested in predicting the next candle.
I’m interested in seeing which scenario price confirms.
What do you think comes first, breakout or deeper retracement? 👇
#CryptoAnalysis #cryptotrading #TechnicalAnalysis #TradingSetup #SAPPAcademy
After the bullish BOS, price pushed higher and is now consolidating inside a symmetrical triangle.
The key area I’m watching is the 0.0069–0.0073 demand zone.
There are 3 possible scenarios:
🟢 Bullish: Triangle breakout → continuation toward the next liquidity area.
🟡 Breakout + retest: Breakout, then a retest before continuation.
🔴 Bearish: Breakdown → demand zone becomes the key invalidation area.
I’m not interested in predicting the next candle.
I’m interested in seeing which scenario price confirms.
What do you think comes first, breakout or deeper retracement? 👇
#CryptoAnalysis #cryptotrading #TechnicalAnalysis #TradingSetup #SAPPAcademy