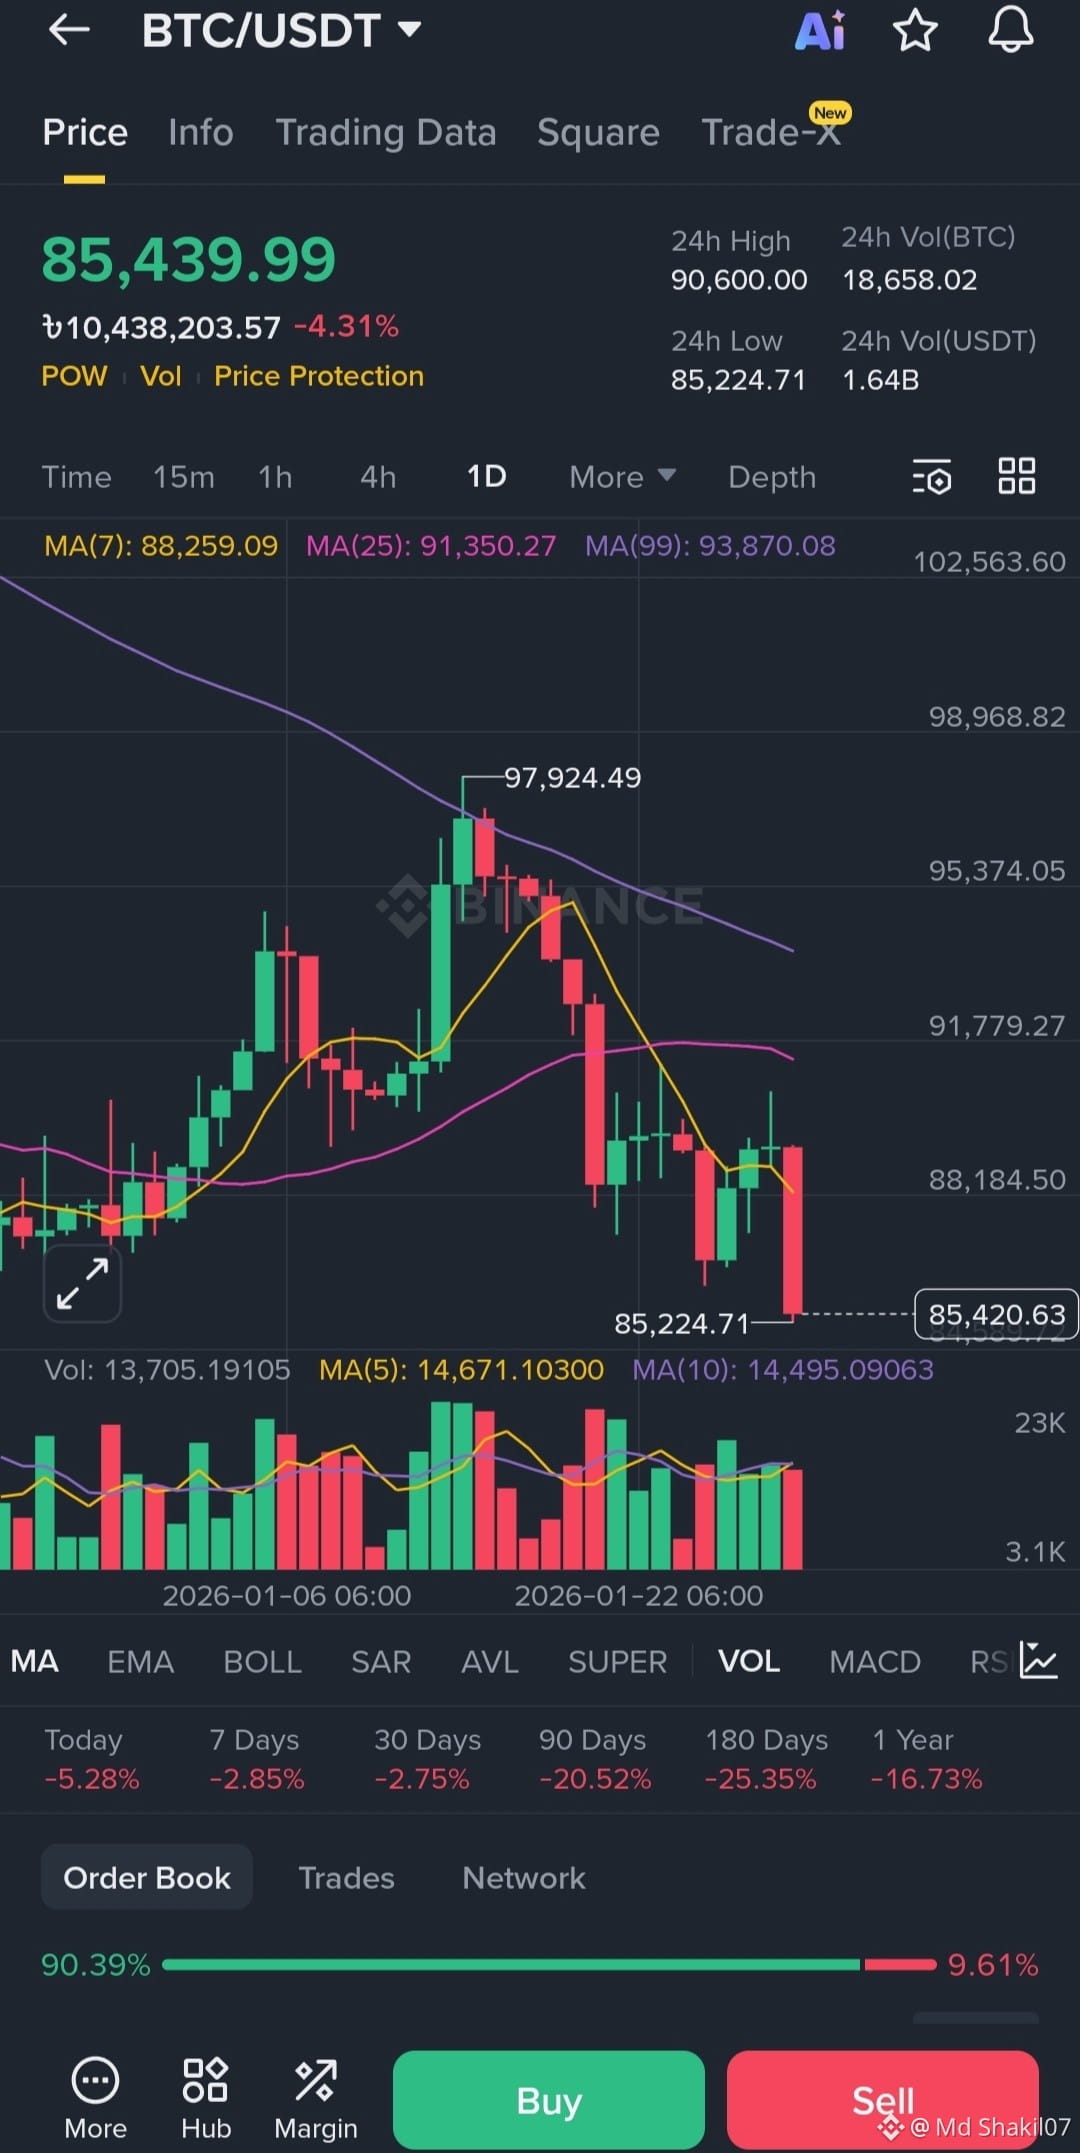
📊 BTC/USDT Market Update: Testing Critical Supports!
The current Bitcoin chart on the daily (1D) timeframe shows some intense bearish pressure. Here’s a breakdown of what the indicators are telling us:
$BTC
🔍 Key Observations:
Price Action: BTC is currently trading around $85,439, down over 4.31% in the last 24 hours. We’ve seen a sharp decline from the recent peak of $97,924.
Moving Averages (MA): The price has slipped below the MA(7), MA(25), and MA(99). This is a significant bearish signal, as the MA(99) (purple line) often acts as a long-term trend indicator. Staying below it suggests a shift in market sentiment.
Support & Resistance: * Immediate Support: The current price is hovering near a local low of $85,224. If this level fails to hold, we might see a further slide.
Resistance: To regain bullish momentum, BTC needs to break back above the $88,259 (MA7) and $91,350 (MA25) zones.
Volume: We are seeing consistent red volume bars, indicating that sellers are currently in control of the narrative.
📉 Performance Metrics:
The timeframe data shows BTC is struggling across the board:
90 Days: -20.52%
180 Days: -25.35%
1 Year: -16.73%
💡 Trading Sentiment:
The market is currently in a "wait and see" phase. The long-term bearish trend since the $102k range is still dominant. Bulls need to step in and defend the $85k psychological support level to prevent a deeper correction.
What’s your move? Are you buying the dip or waiting for a confirmed reversal? Let’s discuss in the comments! 👇
#BTC #CryptoAnalysis #Bitcoin #BinanceSquare #TradingSignals #CryptoMarket