📊 Bitcoin Spot CVD Analysis: Order Flow Insights (Aug. 18)
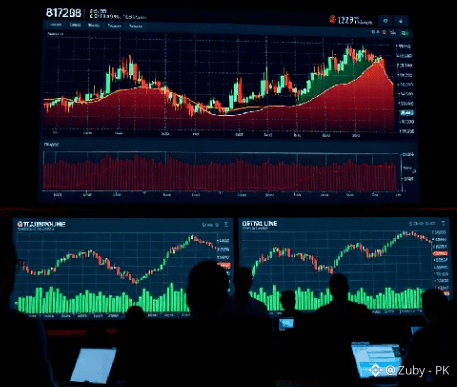
🔍 Understanding the Spot CVD Chart
⟢ Volume Heatmap (Upper Panel): Highlights trading volume concentrations. Brighter colors reveal critical historical zones that act as support or resistance.
⟢ CVD Indicator (Lower Panel): Measures net buy vs. sell pressure.
🟡 Yellow Line ($100 - $1,000): Reflects retail trading activity.
🟤 Brown Line ($1M - $10M): Tracks large-scale institutional volume.
📈 Aug. 18 Market Data Snapshot (9:00 AM)
⟢ Aligned Sentiment: Retail and large-order CVD lines moved together, indicating unified market behavior.
⟢ Key Price Zone: Heavy trading concentrated between $29,500 and $29,800, serving as the primary session pivot area.
⟢ Institutional Activity: Minor uptick in large-order flow hinting at potential accumulation, though overall CVD remained subdued.
💡 Key Takeaways for Traders
⟢ Neutral Bias: Market sits in an equilibrium state where neither buyers nor sellers hold total control.
⟢ Risk Management: Use identified heatmap zones for stop-loss and take-profit placements.
⟢ Complementary Tool: Always pair CVD analysis with other technical indicators and fundamental news.
❓ Frequently Asked Questions
Q: What is the spot CVD chart used for? A: It tracks cumulative volume delta to gauge net buying/selling pressure and identify key market support/resistance zones.
Q: How does the volume heatmap work? A: It visualizes activity levels per price point using color intensity, showcasing historical areas of high trader interest.
Q: What do the yellow and brown lines indicate? A: Rising lines point to buying pressure while falling lines signal selling pressure for retail (yellow) and institutional (brown) sizes.
#BitcoinCVD #CryptoOrderFlow #BTCUSDTAnalysis #CryptoTradingStrategies #CryptoTechnicalAnalysis
$BTC
🔍 Understanding the Spot CVD Chart
⟢ Volume Heatmap (Upper Panel): Highlights trading volume concentrations. Brighter colors reveal critical historical zones that act as support or resistance.
⟢ CVD Indicator (Lower Panel): Measures net buy vs. sell pressure.
🟡 Yellow Line ($100 - $1,000): Reflects retail trading activity.
🟤 Brown Line ($1M - $10M): Tracks large-scale institutional volume.
📈 Aug. 18 Market Data Snapshot (9:00 AM)
⟢ Aligned Sentiment: Retail and large-order CVD lines moved together, indicating unified market behavior.
⟢ Key Price Zone: Heavy trading concentrated between $29,500 and $29,800, serving as the primary session pivot area.
⟢ Institutional Activity: Minor uptick in large-order flow hinting at potential accumulation, though overall CVD remained subdued.
💡 Key Takeaways for Traders
⟢ Neutral Bias: Market sits in an equilibrium state where neither buyers nor sellers hold total control.
⟢ Risk Management: Use identified heatmap zones for stop-loss and take-profit placements.
⟢ Complementary Tool: Always pair CVD analysis with other technical indicators and fundamental news.
❓ Frequently Asked Questions
Q: What is the spot CVD chart used for? A: It tracks cumulative volume delta to gauge net buying/selling pressure and identify key market support/resistance zones.
Q: How does the volume heatmap work? A: It visualizes activity levels per price point using color intensity, showcasing historical areas of high trader interest.
Q: What do the yellow and brown lines indicate? A: Rising lines point to buying pressure while falling lines signal selling pressure for retail (yellow) and institutional (brown) sizes.
#BitcoinCVD #CryptoOrderFlow #BTCUSDTAnalysis #CryptoTradingStrategies #CryptoTechnicalAnalysis
$BTC