Solana Daily Update
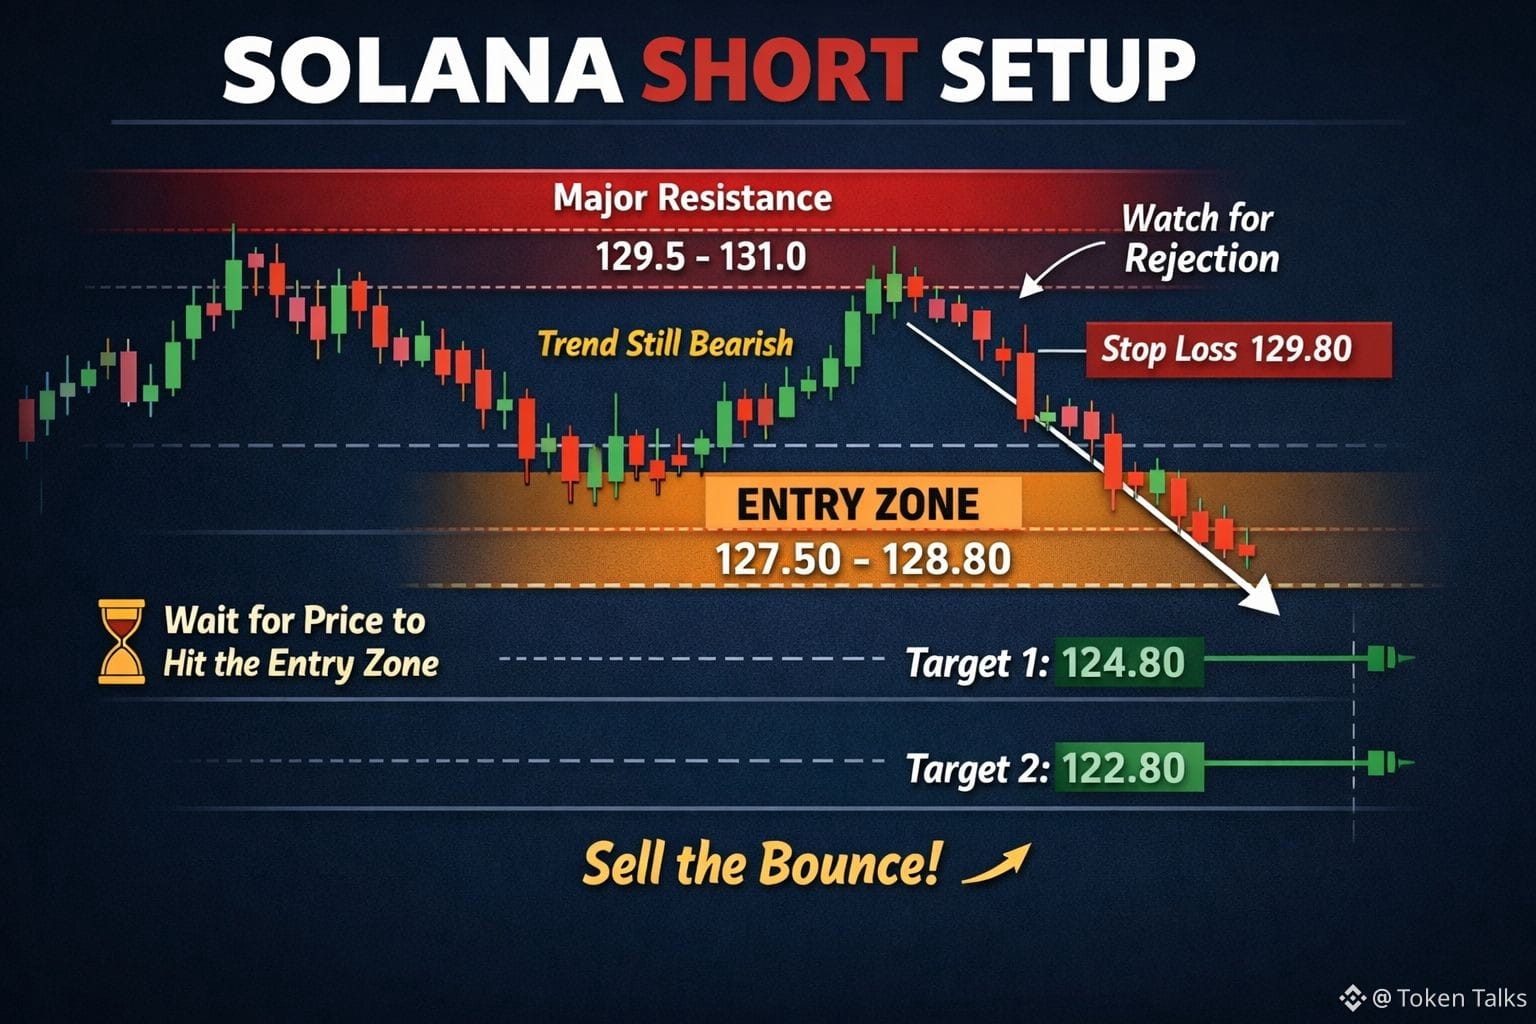
In the last session, $SOL moved up toward the 127–128 area but could not stay there. Price showed weakness near this level and started to slow down. Earlier, SOL dropped into the 123–124 zone, where buyers stepped in and caused a bounce. However, this bounce looks like a short pause after a drop, not a strong recovery.
On the daily chart, the trend is still bearish. Price is trading below the main resistance area around 129–131, which means sellers are still in control. As long as SOL stays below this zone, upward moves are likely to face selling pressure.
If SOL gets rejected again from these levels, price can move back toward the 124 area, and if weakness continues, lower levels may be tested again. Only a strong break and hold above 131 would change this view. Until then, this remains a sell-the-bounce market, and patience is important.
#VIRBNB #USIranStandoff
Trade #Solana Here 👇👇👇
In the last session, $SOL moved up toward the 127–128 area but could not stay there. Price showed weakness near this level and started to slow down. Earlier, SOL dropped into the 123–124 zone, where buyers stepped in and caused a bounce. However, this bounce looks like a short pause after a drop, not a strong recovery.
On the daily chart, the trend is still bearish. Price is trading below the main resistance area around 129–131, which means sellers are still in control. As long as SOL stays below this zone, upward moves are likely to face selling pressure.
If SOL gets rejected again from these levels, price can move back toward the 124 area, and if weakness continues, lower levels may be tested again. Only a strong break and hold above 131 would change this view. Until then, this remains a sell-the-bounce market, and patience is important.
#VIRBNB #USIranStandoff
Trade #Solana Here 👇👇👇