#termmax
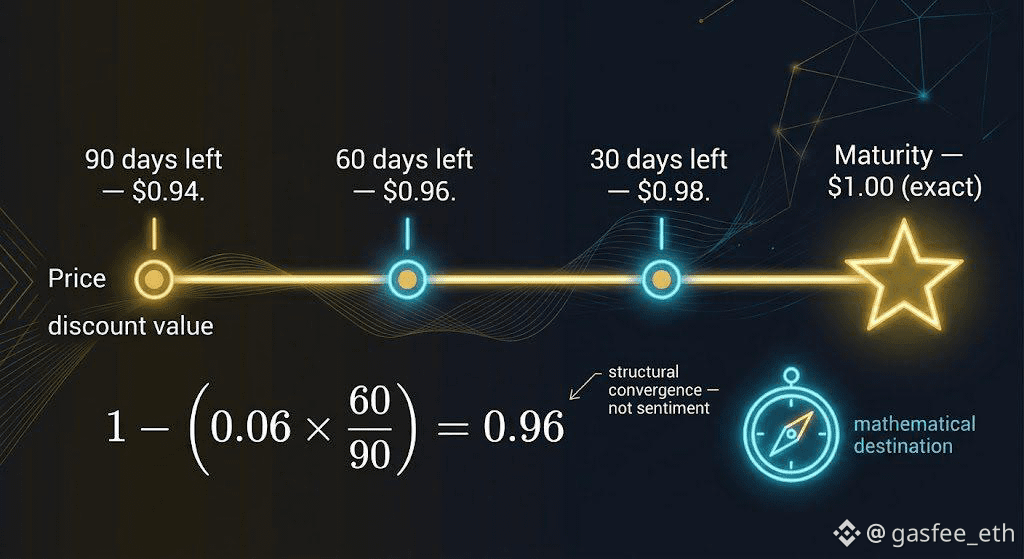
The most underrated chart in fixed-rate DeFi is one nobody's actually screenshotting: an FT's price pulling toward $1.00 as maturity gets closer. 📉➡️📈 Walked through the actual math on this.
FT + XT always equals exactly 1 debt token, at any point before maturity. At maturity, XT drops to zero and FT redeems at full face value — so FT price has to converge to $1.00 by the time the clock runs out, structurally, not by market sentiment. 🔒
Say an FT is trading at $0.94 with 90 days left to maturity, pricing in a fixed yield over that window. Assuming that yield stays roughly constant, the price 30 days later (60 days left) should sit close to: 1 − (0.06 × 60/90) = 1 − 0.04 = $0.96. 🧮 Another 30 days later, ~$0.98. At maturity: exactly $1.00.
Compare that to holding a normal volatile token, where price has no structural anchor pulling it anywhere — it's supply and demand with no floor and no destination. An FT has both: a mathematical destination (par) and a known date it gets there. 🧭
The trade this opens up: if an FT is priced below where that pull-to-par curve says it "should" be for its remaining term, that's not necessarily a red flag — check whether it's mispriced (opportunity) or the market's pricing in real default/liquidity risk the simple formula above doesn't capture. ⚠️
Anyone actually trading FTs on the secondary market against this pull-to-par curve, or is everyone just buying and holding to maturity? 🤔 Does a structurally guaranteed destination price change how you think about "volatility" in a fixed-rate token versus a normal one?
@TermMax #TermMax
The most underrated chart in fixed-rate DeFi is one nobody's actually screenshotting: an FT's price pulling toward $1.00 as maturity gets closer. 📉➡️📈 Walked through the actual math on this.
FT + XT always equals exactly 1 debt token, at any point before maturity. At maturity, XT drops to zero and FT redeems at full face value — so FT price has to converge to $1.00 by the time the clock runs out, structurally, not by market sentiment. 🔒
Say an FT is trading at $0.94 with 90 days left to maturity, pricing in a fixed yield over that window. Assuming that yield stays roughly constant, the price 30 days later (60 days left) should sit close to: 1 − (0.06 × 60/90) = 1 − 0.04 = $0.96. 🧮 Another 30 days later, ~$0.98. At maturity: exactly $1.00.
Compare that to holding a normal volatile token, where price has no structural anchor pulling it anywhere — it's supply and demand with no floor and no destination. An FT has both: a mathematical destination (par) and a known date it gets there. 🧭
The trade this opens up: if an FT is priced below where that pull-to-par curve says it "should" be for its remaining term, that's not necessarily a red flag — check whether it's mispriced (opportunity) or the market's pricing in real default/liquidity risk the simple formula above doesn't capture. ⚠️
Anyone actually trading FTs on the secondary market against this pull-to-par curve, or is everyone just buying and holding to maturity? 🤔 Does a structurally guaranteed destination price change how you think about "volatility" in a fixed-rate token versus a normal one?
@TermMax #TermMax