
$PENGU GU/USDC — Buyers Are Trying to Take Control
PENGU/USDC is showing an interesting recovery on the 15-minute chart.
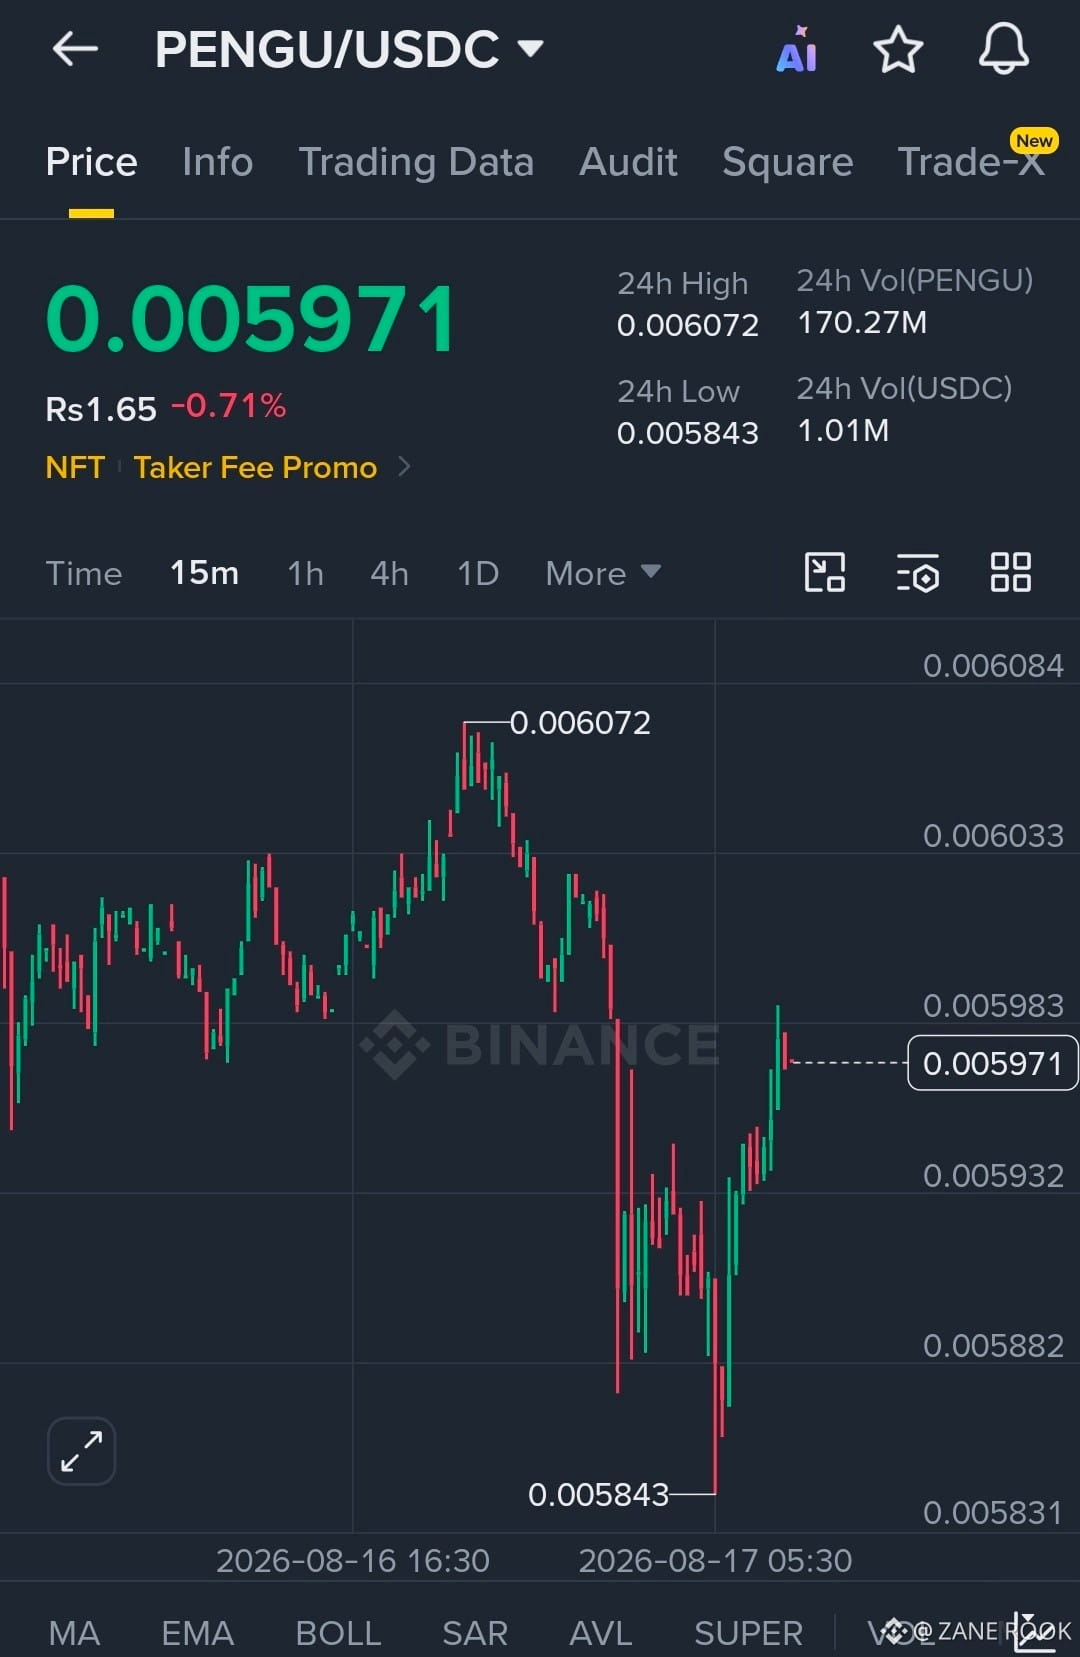
Price dropped sharply from the recent high of 0.006072 and printed a 24H low around 0.005843. Since that low, buyers have stepped back in and pushed price toward 0.005971.
The important part now is whether PENGU can reclaim the 0.00600 area and hold above it.
Trade Idea: Long
Entry: 0.005985 – 0.006005
Target 1: 0.006033
Target 2: 0.006072
Stop Loss: 0.005930
Risk/Reward: The first target offers a relatively small move, while the second target gives the trade more room if momentum continues.
Why this setup?
The chart shows a strong rebound from 0.005843, followed by a series of higher candles. The 0.00593–0.00595 area is the key short-term support zone, while 0.00600–0.00607 is the immediate resistance zone.
If PENGU breaks and holds above 0.00600, buyers could attempt another push toward the previous high at 0.006072.
If price loses 0.005930, the bullish setup becomes invalid and I would avoid forcing the trade.
This is a chart-based setup, not a guarantee. Wait for confirmation instead of chasing a candle.
PENGU/USDC
Long above 0.005985
TP: 0.006033 / 0.006072
SL: 0.005930
Let's see if buyers can reclaim the resistance.
PENGU/USDC is showing an interesting recovery on the 15-minute chart.
Price dropped sharply from the recent high of 0.006072 and printed a 24H low around 0.005843. Since that low, buyers have stepped back in and pushed price toward 0.005971.
The important part now is whether PENGU can reclaim the 0.00600 area and hold above it.
Trade Idea: Long
Entry: 0.005985 – 0.006005
Target 1: 0.006033
Target 2: 0.006072
Stop Loss: 0.005930
Risk/Reward: The first target offers a relatively small move, while the second target gives the trade more room if momentum continues.
Why this setup?
The chart shows a strong rebound from 0.005843, followed by a series of higher candles. The 0.00593–0.00595 area is the key short-term support zone, while 0.00600–0.00607 is the immediate resistance zone.
If PENGU breaks and holds above 0.00600, buyers could attempt another push toward the previous high at 0.006072.
If price loses 0.005930, the bullish setup becomes invalid and I would avoid forcing the trade.
This is a chart-based setup, not a guarantee. Wait for confirmation instead of chasing a candle.
PENGU/USDC
Long above 0.005985
TP: 0.006033 / 0.006072
SL: 0.005930
Let's see if buyers can reclaim the resistance.