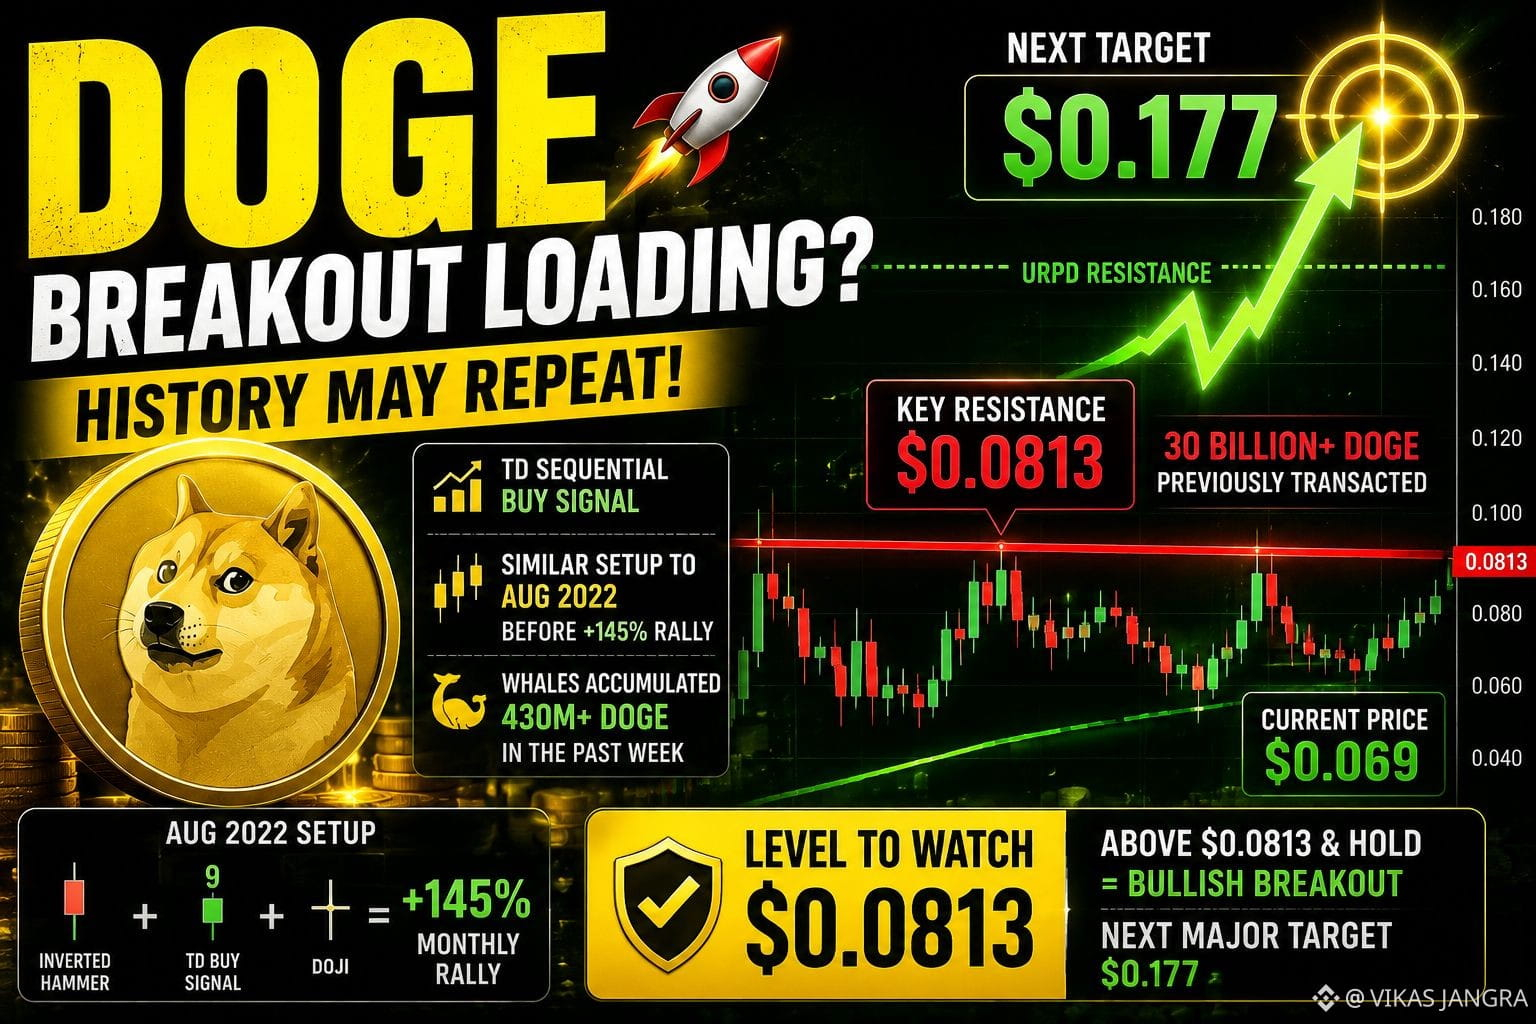

𝗧𝗵𝗲 DOGE chart is getting interesting again — but there’s one level I’m waiting for.
DOGE has been trapped between ~$0.068 and $0.08 since June 25.
At first glance, just boring sideways action.
But underneath it, the setup is changing.
The monthly chart just flashed a TD Sequential buy signal, and the current candle structure looks similar to August 2022 — the setup that came before a ~145% monthly rally.
Whales have also accumulated 430M+ DOGE over the past week.
Still, I wouldn't call the breakout confirmed yet.
𝗧𝗵𝗲 𝗹𝗲𝘃𝗲𝗹 𝘁𝗵𝗮𝘁 𝗺𝗮𝘁𝘁𝗲𝗿𝘀: $0.0813.
More than 30B DOGE were previously transacted around this level.
If DOGE gets a sustained close above $0.0813 and flips it into support, the range breakout becomes much more convincing.
And then the next major resistance sits around 𝗗𝗢𝗚𝗘 $0.177.
From ~$0.069, that would be a very serious move.
So my view is simple:
𝗕𝗲𝗹𝗼𝘄 $0.0813 → still range-bound.
𝗔𝗯𝗼𝘃𝗲 $0.0813 + hold → bullish breakout signal.
𝗡𝗲𝘅𝘁 major zone → $0.177.
I’m watching the breakout, not chasing the prediction.
Would you wait for $0.0813 to flip into support, or take the risk before confirmation?
$DOGE
DOGE has been trapped between ~$0.068 and $0.08 since June 25.
At first glance, just boring sideways action.
But underneath it, the setup is changing.
The monthly chart just flashed a TD Sequential buy signal, and the current candle structure looks similar to August 2022 — the setup that came before a ~145% monthly rally.
Whales have also accumulated 430M+ DOGE over the past week.
Still, I wouldn't call the breakout confirmed yet.
𝗧𝗵𝗲 𝗹𝗲𝘃𝗲𝗹 𝘁𝗵𝗮𝘁 𝗺𝗮𝘁𝘁𝗲𝗿𝘀: $0.0813.
More than 30B DOGE were previously transacted around this level.
If DOGE gets a sustained close above $0.0813 and flips it into support, the range breakout becomes much more convincing.
And then the next major resistance sits around 𝗗𝗢𝗚𝗘 $0.177.
From ~$0.069, that would be a very serious move.
So my view is simple:
𝗕𝗲𝗹𝗼𝘄 $0.0813 → still range-bound.
𝗔𝗯𝗼𝘃𝗲 $0.0813 + hold → bullish breakout signal.
𝗡𝗲𝘅𝘁 major zone → $0.177.
I’m watching the breakout, not chasing the prediction.
Would you wait for $0.0813 to flip into support, or take the risk before confirmation?
$DOGE