


In early 1979, silver was trading around $6 per ounce.
Within just one year, by January 17–18, 1980, silver shot up to nearly $49–$50 per ounce — almost an 8x rise in a very short time.
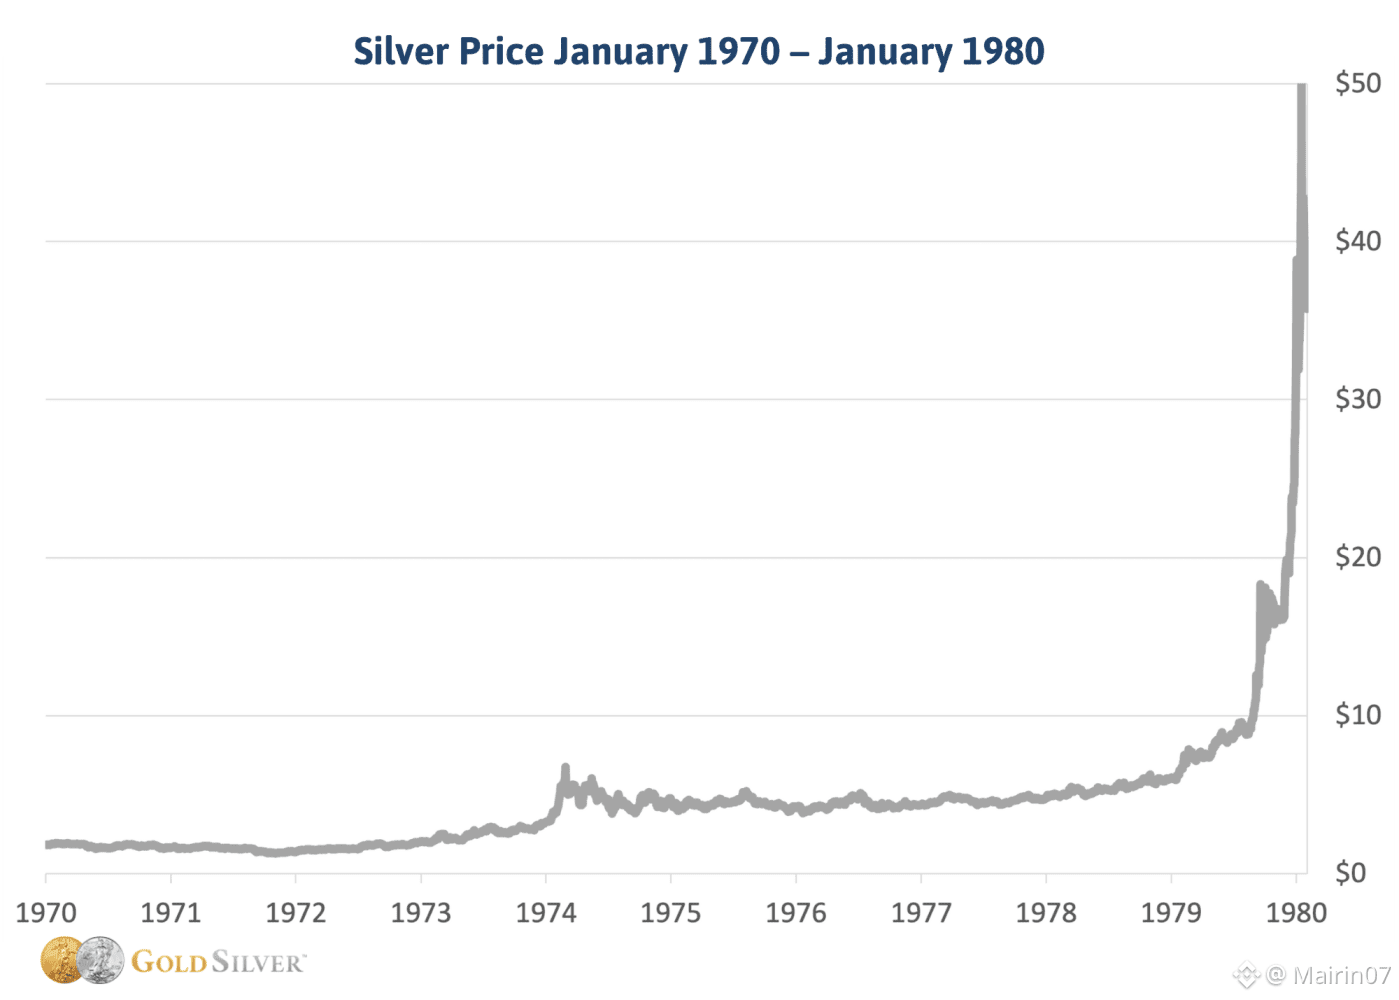
This sudden rise attracted heavy speculation, high leverage, and huge public attention. But what came next turned into one of the most famous crashes in commodity market history.
The Collapse Begins
After touching its peak, silver started falling fast.
By March 26, 1980, the price had already dropped to around $21 per ounce.
And then came the day that changed everything — Silver Thursday.
Silver Thursday — March 27, 1980
On March 27, 1980, regulators changed the rules:
Margin requirements were increased
Margin trading was effectively restricted
The impact was brutal.
In a single day, silver crashed nearly 50%, falling to around $10–$10.5 per ounce.
Panic selling followed. Forced liquidations wiped out leveraged traders, and confidence in the market completely collapsed.
The Long-Term Damage
The damage didn’t stop there.
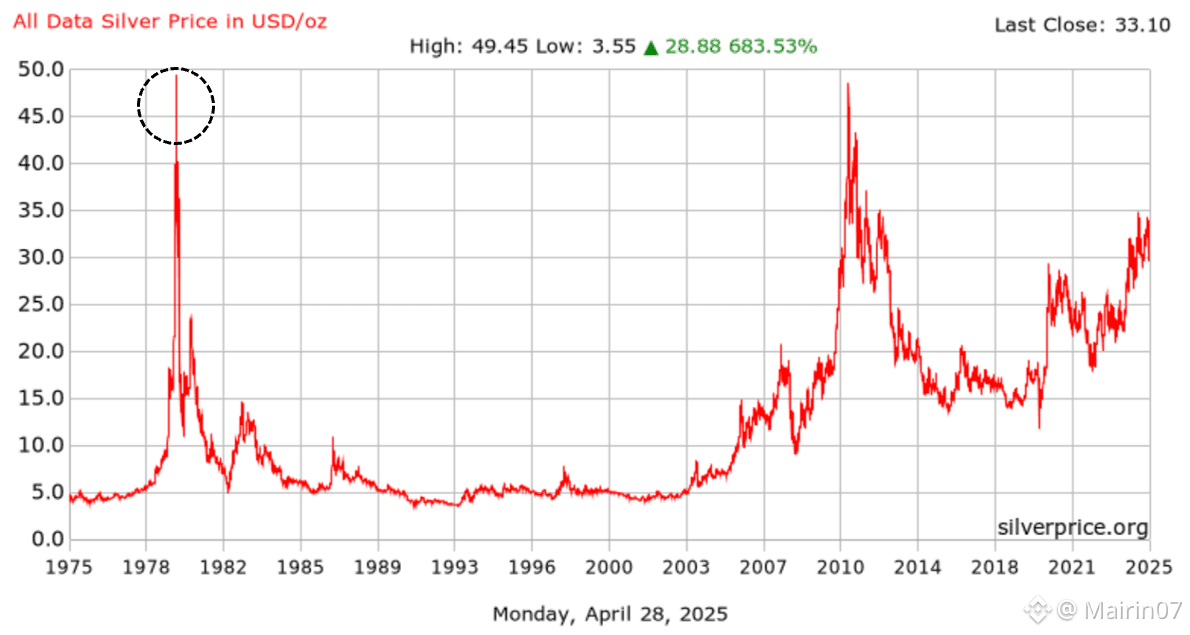
By 1982, silver was trading again near $5–$6 per ounce — almost back to where it was before the big rally.
From its 1980 peak, silver saw a 90%+ decline over the next few years.
Many investors who entered late, or used heavy leverage, lost most or all of their capital.
Why This Matters Today
The most scariest part?
In 2026, silver following similar pattern:
Fast price growth
Rising speculation
Heavy use of leverage
Increasing retail participation
This brings up an uncomfortable but important question:
Is History Repeating Itself?
Markets don’t repeat exactly — but they often rhyme.
Studying past events like the Silver Thursday crash is important, not to spread fear, but to understand risk, leverage, and market psychology.
DYOR. WATCH. TRADE. TOUCH GRASS. REPEAT.