📊 $DEXE /USDT TECHNICAL ANALYSIS
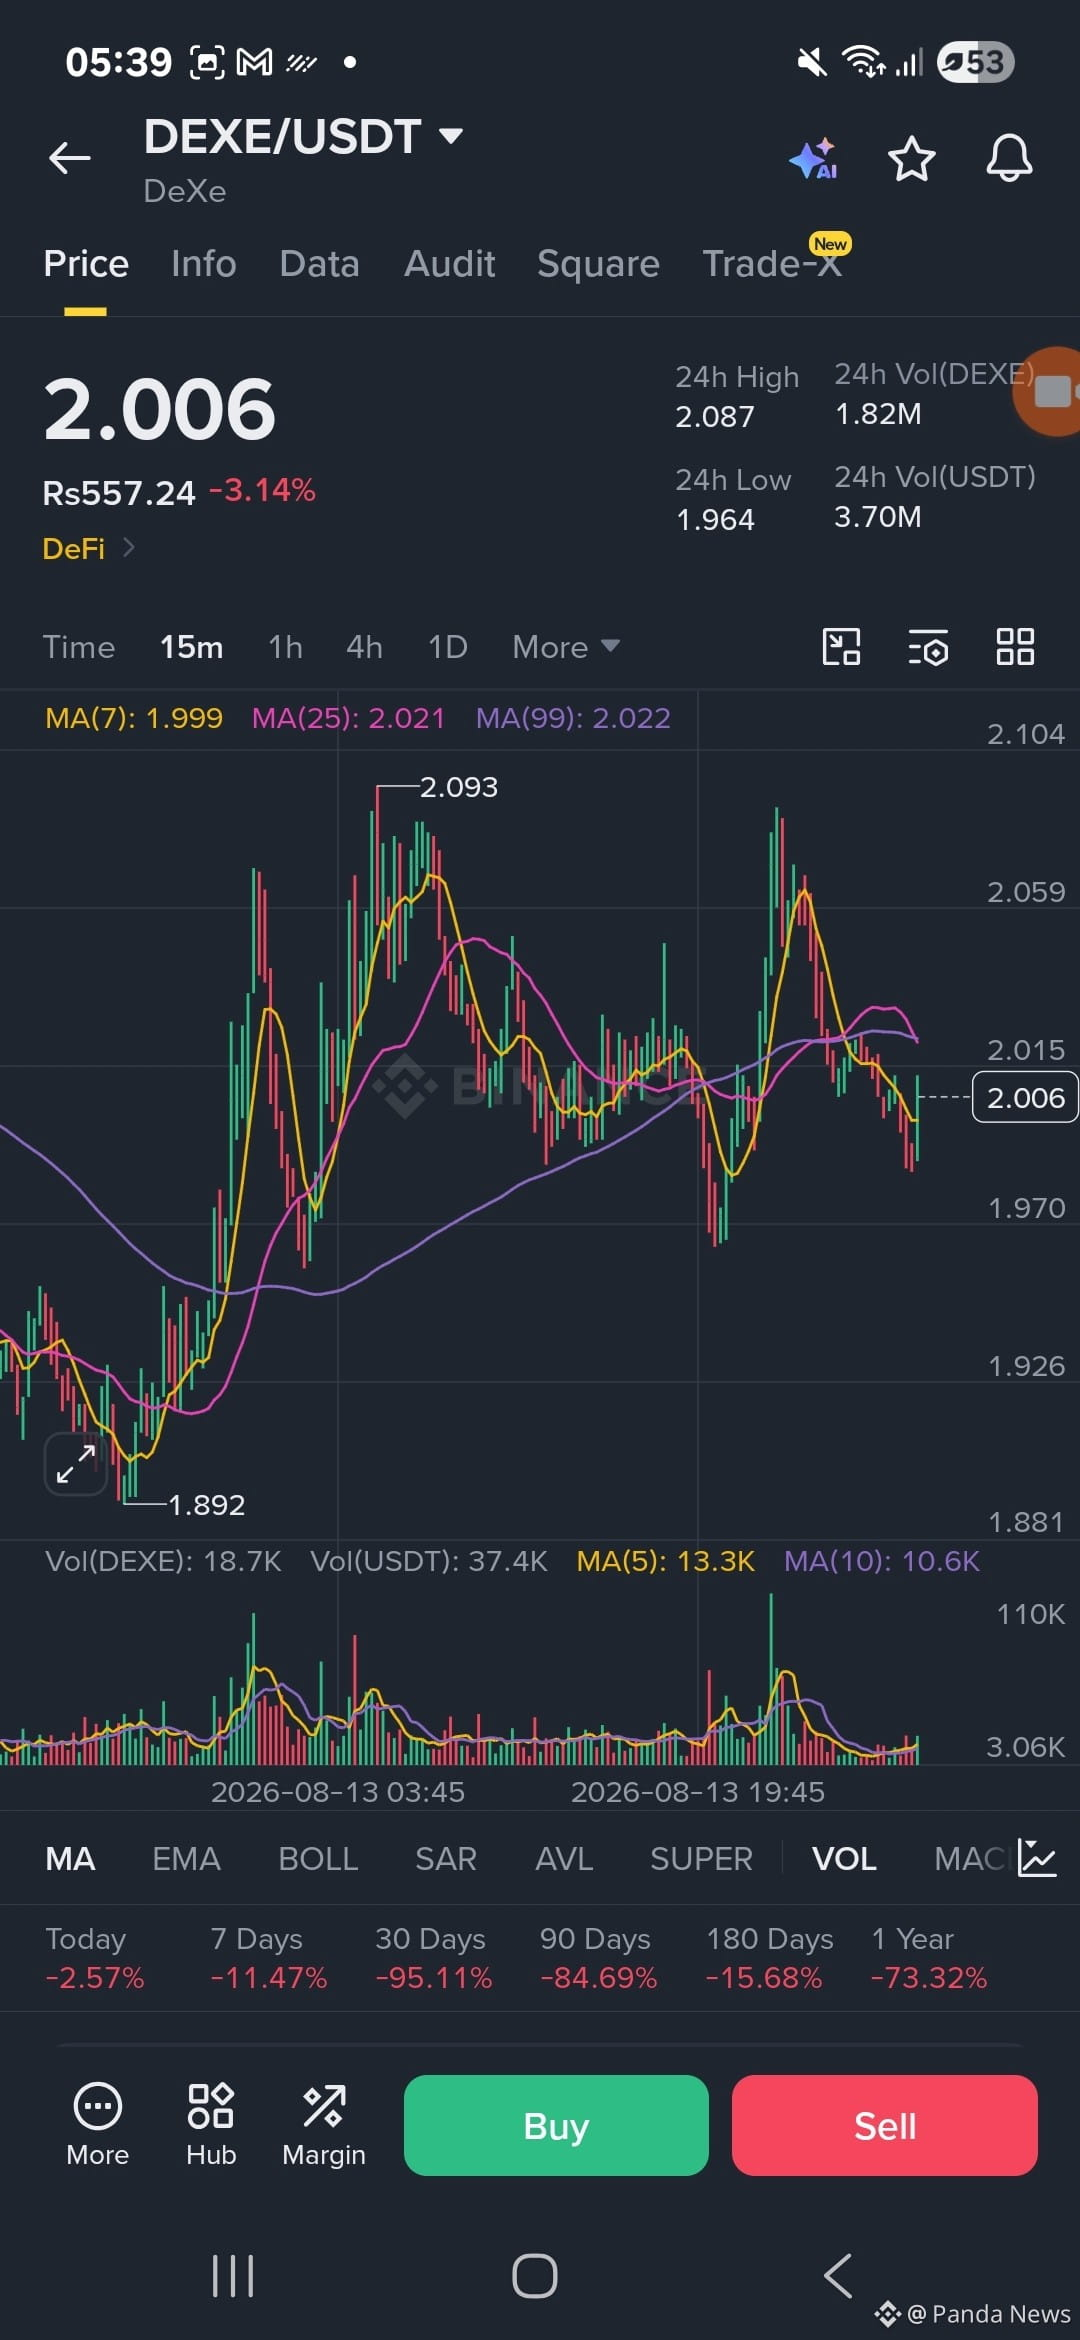
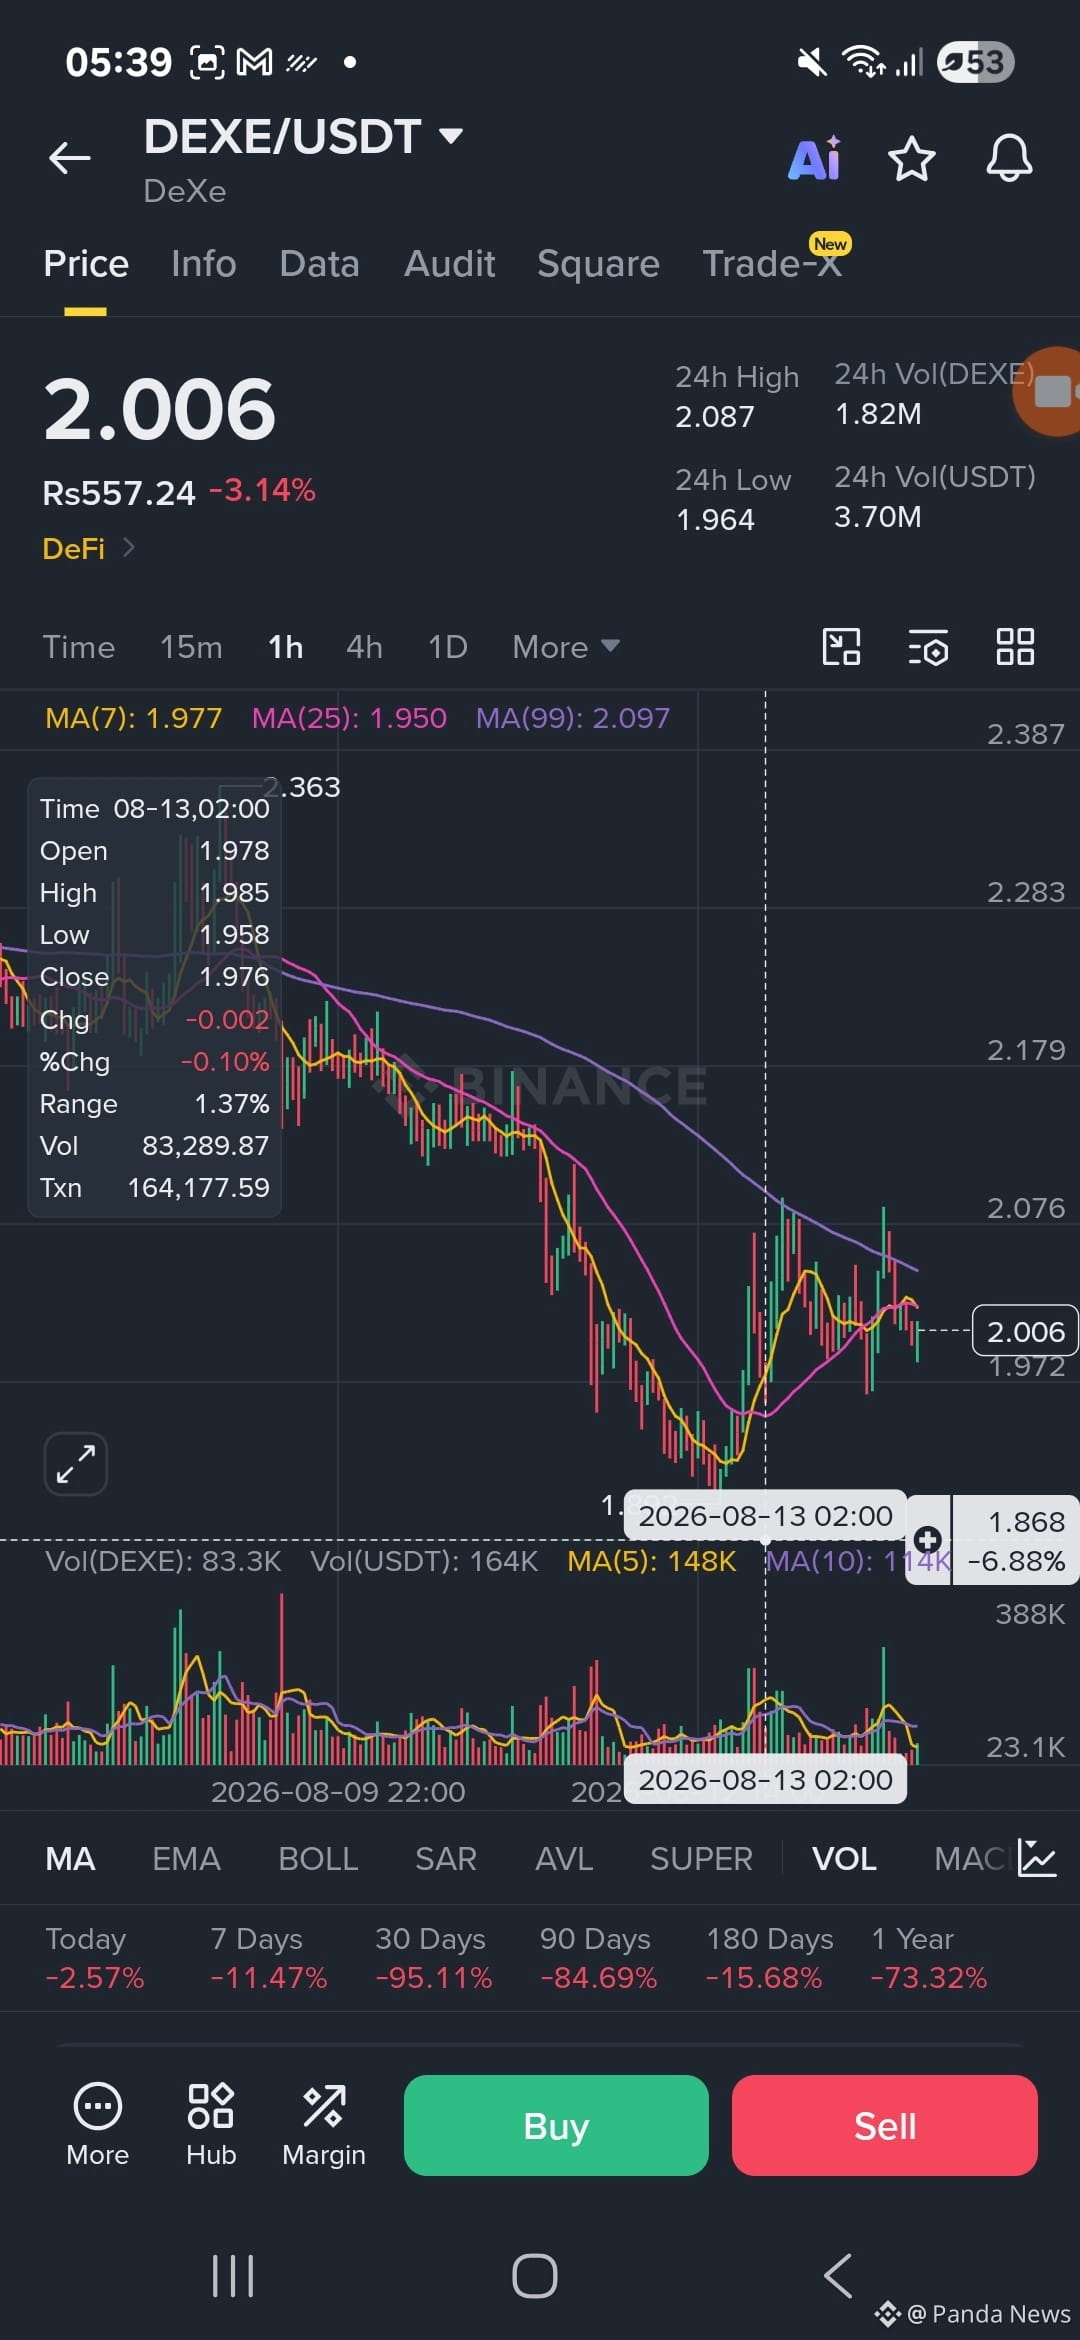
$DEXE is currently trading around $2.006 and showing a mixed short-term structure. The chart suggests that buyers are defending the $1.96–$1.97 area, but sellers are still active around $2.02–$2.09.
🔹 KEY SUPPORT
🟢 $1.97 – $1.96 — Important short-term support
🟢 $1.89 — Stronger downside support
🔸 KEY RESISTANCE
🔴 $2.02 – $2.06 — First resistance zone
🔴 $2.087 – $2.093 — Major breakout zone
📈 BULLISH SCENARIO
If DEXE breaks and holds above $2.06 with strong volume, buyers could push toward $2.09 and potentially higher.
📉 BEARISH SCENARIO
If price loses $1.96 with strong selling pressure, the next area to watch is around $1.89.
🎯 OVERALL VIEW
Neutral → slightly bearish in the short term until $DEXE reclaims the $2.06–$2.09 resistance area.
$DEXE is currently trading around $2.006 and showing a mixed short-term structure. The chart suggests that buyers are defending the $1.96–$1.97 area, but sellers are still active around $2.02–$2.09.
🔹 KEY SUPPORT
🟢 $1.97 – $1.96 — Important short-term support
🟢 $1.89 — Stronger downside support
🔸 KEY RESISTANCE
🔴 $2.02 – $2.06 — First resistance zone
🔴 $2.087 – $2.093 — Major breakout zone
📈 BULLISH SCENARIO
If DEXE breaks and holds above $2.06 with strong volume, buyers could push toward $2.09 and potentially higher.
📉 BEARISH SCENARIO
If price loses $1.96 with strong selling pressure, the next area to watch is around $1.89.
🎯 OVERALL VIEW
Neutral → slightly bearish in the short term until $DEXE reclaims the $2.06–$2.09 resistance area.