

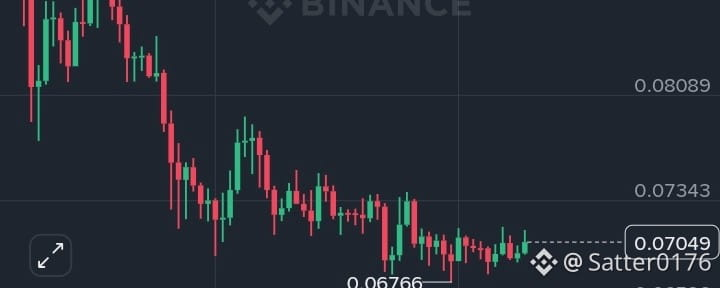

Dogecoin is showing early signs of recovery after a prolonged downtrend, but DOGE bulls still have a major test ahead. 🐕📈$DOGE
On the 1D chart, DOGE/USDT is trading around $0.07049, up about 1.48% in the latest session.
📊 DOGE Technical Analysis
Market Structure:
DOGE remains in a broader bearish structure, but price has started moving sideways after finding support near $0.06766.
Support Levels:
🟢 $0.06766 — key recent support
🟢 $0.06596 — deeper support zone
Resistance Levels:
🔴 $0.07343 — immediate resistance
🔴 $0.08089 — next major resistance
🔴 $0.08835 — stronger upside target
RSI (14): 46.7
RSI is below 50, meaning momentum is still neutral-to-bearish. However, the indicator is recovering from lower levels, which could support a short-term bounce.
OBV:
OBV remains relatively weak, suggesting that strong accumulation has not yet appeared. DOGE needs stronger volume to confirm a meaningful breakout.
🐂 Bullish Scenario
If DOGE breaks and holds above $0.07343 with strong volume, buyers could target:
🎯 $0.08089
🎯 $0.08835
A sustained move above $0.08835 would significantly improve the daily market structure.
🐻 Bearish Scenario
If DOGE fails to reclaim $0.07343 and loses $0.06766, sellers could push price toward $0.06596 and potentially lower.
🎯 Trade Idea
Entry Zone: $0.0680–$0.0705
Stop Loss: Below $0.0655
TP1: $0.0734
TP2: $0.0809
TP3: $0.0883
⚠️ Not financial advice. DOGE is highly volatile. Confirm breakouts with volume and always manage your risk.
Are you bullish or bearish on DOGE from here? 🐕🔥