$ETH
Latest Analysis: August 11, 2026
Two years following the implementation of major scalability upgrades in 2024, the Ethereum network is realizing its long-term potential as the dominant settlement layer for high-throughput applications and tokenized real-world assets (RWA). As of today, August 11, 2026, ETH is trading at approximately $2,180, marking a spectacular, high-volume breakout from a massive multi-year Ascending Triangle pattern that has consolidated price action since mid-2024.
Technical Structure and Breakout Confirmation:
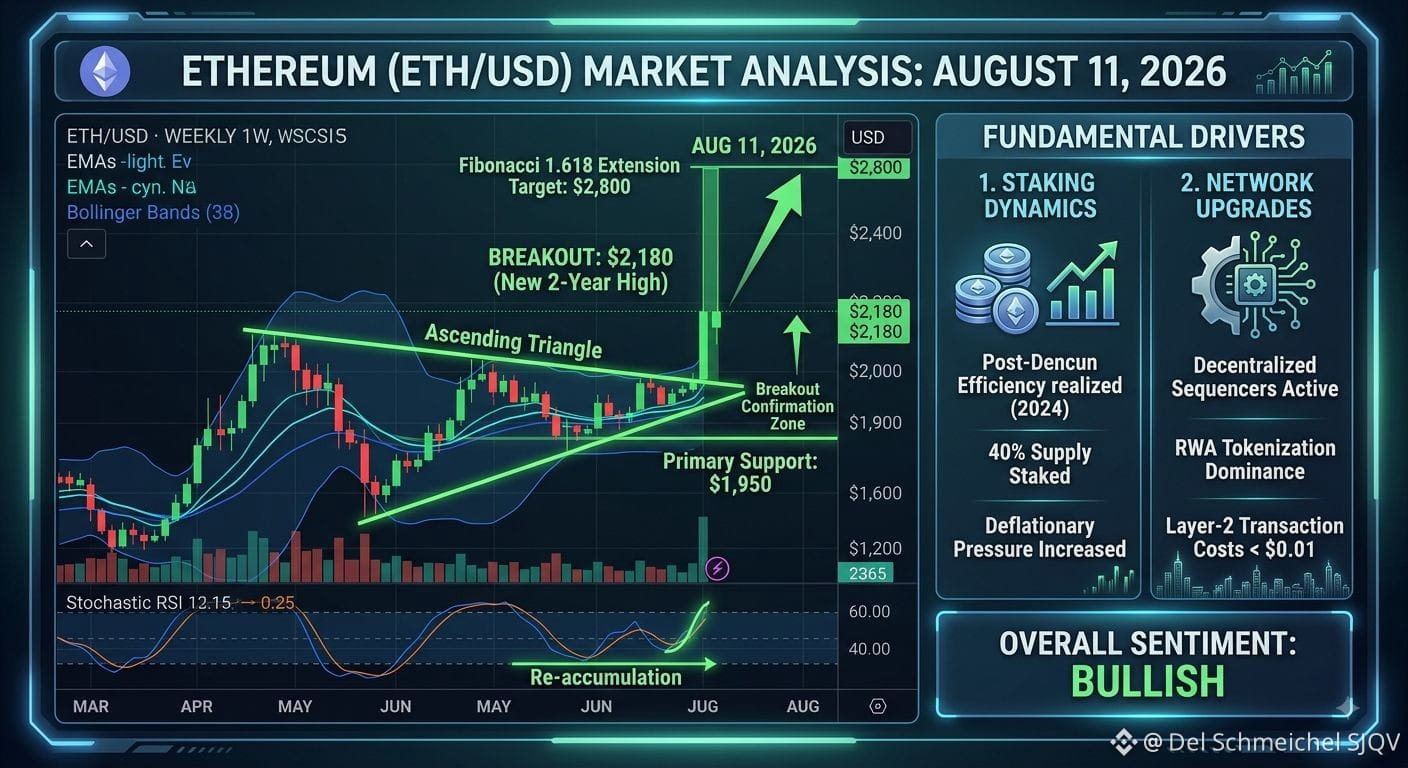
The accompanying weekly chart visualizes this critical technical event. The $1,950 level, annotated as primary support, served as the triangle's hypotenuse. The multi-month re-accumulation phase (March–July 2026) coiled volatility, leading to the decisive vertical breakout candle printed on the current weekly bar.
Bullish Target (Fibonacci Extension): Our primary technical target for this major breakout is the 1.618 Fibonacci extension of the triangle's height, pointing to $2,800 by late Q3 or early Q4 2026. This move would solidify a definitive transition into a new parabolic expansion phase.
Stochastic RSI Momentum: As shown in the panel below the chart, the weekly Stochastic RSI has initiated a bullish cross from a 'Re-accumulation' zone, confirming strong momentum backing the upward break
#BarrickMiningFalls8% #KeelClosesUSBitcoinMining #RobinhoodToOfferCryptoTradingInUK #TSMCJulyRevenueJumps45%
Latest Analysis: August 11, 2026
Two years following the implementation of major scalability upgrades in 2024, the Ethereum network is realizing its long-term potential as the dominant settlement layer for high-throughput applications and tokenized real-world assets (RWA). As of today, August 11, 2026, ETH is trading at approximately $2,180, marking a spectacular, high-volume breakout from a massive multi-year Ascending Triangle pattern that has consolidated price action since mid-2024.
Technical Structure and Breakout Confirmation:
The accompanying weekly chart visualizes this critical technical event. The $1,950 level, annotated as primary support, served as the triangle's hypotenuse. The multi-month re-accumulation phase (March–July 2026) coiled volatility, leading to the decisive vertical breakout candle printed on the current weekly bar.
Bullish Target (Fibonacci Extension): Our primary technical target for this major breakout is the 1.618 Fibonacci extension of the triangle's height, pointing to $2,800 by late Q3 or early Q4 2026. This move would solidify a definitive transition into a new parabolic expansion phase.
Stochastic RSI Momentum: As shown in the panel below the chart, the weekly Stochastic RSI has initiated a bullish cross from a 'Re-accumulation' zone, confirming strong momentum backing the upward break
#BarrickMiningFalls8% #KeelClosesUSBitcoinMining #RobinhoodToOfferCryptoTradingInUK #TSMCJulyRevenueJumps45%