🚁 Flying higher together! 🌤️
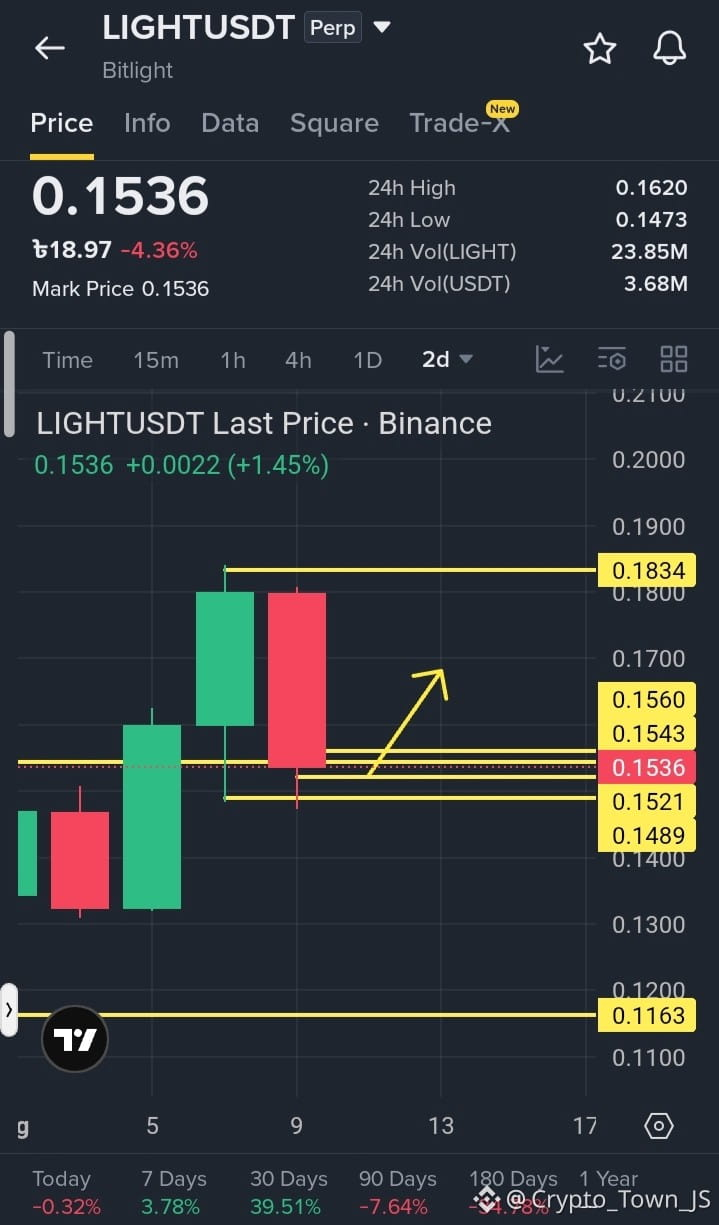
$LIGHT USDT (Bitlight) has found a strong footing near its local structural support levels on the 2-day macro chart. Despite displaying a -4.36% net change over the past 24 hours from a previous correction, a clean green candle reaction has started to print, bringing the price to 0.1536. The 2D chart features a prominent yellow technical indicator arrow pointing sharply upward, indicating that buyers are re-entering the market to defend this key accumulation base.
While the structural shift is highly promising, buying directly into immediate horizontal resistance lines carries risk, so waiting for a clean breakout or minor stabilization above the current base is the smartest play.
Here is your exclusive long trading setup:
💎 Trading Parameters (Long):
📌 Optimal Entry Zone: 0.1490 - 0.1535 (Patience pays off—look to accumulate long positions as price action stabilizes firmly above the lower yellow support levels)
💵 Target 1: 0.1560
💵 Target 2: 0.1834
💵 Target 3: 0.2050 (If intense buying pressure continues to extend toward testing previous macro swing highs)
🛑 Stop Loss (SL): 0.1440 (Placed safely below the key 0.1473 24h low and horizontal structural floor to secure your trading capital)
🚨 Position & Risk Management:
Since LIGHTUSDT is exhibiting significant multi-day structural shifts and sudden volume spikes, strict risk control is highly recommended. Keep leverage strictly conservative (2x - 3x max). Protect your hard-earned capital by scaling out your position and locking in partial profits as each target is smashed!
💬 Do you think LIGHT will respect the upward yellow arrow and smoothly clear the 0.1560 horizontal line, or are you expecting a retest of the 0.1163 macro floor first? Let's discuss in the comments below! ⬇️
#LIGHTUSDT #BinanceSquare #cryptotrading #FutureTarding #CryptoAnalysis
$BMT $NIL
$LIGHT USDT (Bitlight) has found a strong footing near its local structural support levels on the 2-day macro chart. Despite displaying a -4.36% net change over the past 24 hours from a previous correction, a clean green candle reaction has started to print, bringing the price to 0.1536. The 2D chart features a prominent yellow technical indicator arrow pointing sharply upward, indicating that buyers are re-entering the market to defend this key accumulation base.
While the structural shift is highly promising, buying directly into immediate horizontal resistance lines carries risk, so waiting for a clean breakout or minor stabilization above the current base is the smartest play.
Here is your exclusive long trading setup:
💎 Trading Parameters (Long):
📌 Optimal Entry Zone: 0.1490 - 0.1535 (Patience pays off—look to accumulate long positions as price action stabilizes firmly above the lower yellow support levels)
💵 Target 1: 0.1560
💵 Target 2: 0.1834
💵 Target 3: 0.2050 (If intense buying pressure continues to extend toward testing previous macro swing highs)
🛑 Stop Loss (SL): 0.1440 (Placed safely below the key 0.1473 24h low and horizontal structural floor to secure your trading capital)
🚨 Position & Risk Management:
Since LIGHTUSDT is exhibiting significant multi-day structural shifts and sudden volume spikes, strict risk control is highly recommended. Keep leverage strictly conservative (2x - 3x max). Protect your hard-earned capital by scaling out your position and locking in partial profits as each target is smashed!
💬 Do you think LIGHT will respect the upward yellow arrow and smoothly clear the 0.1560 horizontal line, or are you expecting a retest of the 0.1163 macro floor first? Let's discuss in the comments below! ⬇️
#LIGHTUSDT #BinanceSquare #cryptotrading #FutureTarding #CryptoAnalysis
$BMT $NIL