

Technical analysis plays an important role in identifying potential market opportunities. While no chart pattern guarantees success, recognizing bullish formations can help traders spot high-probability setups before major price moves begin. Understanding these patterns can improve timing and risk management in any market.
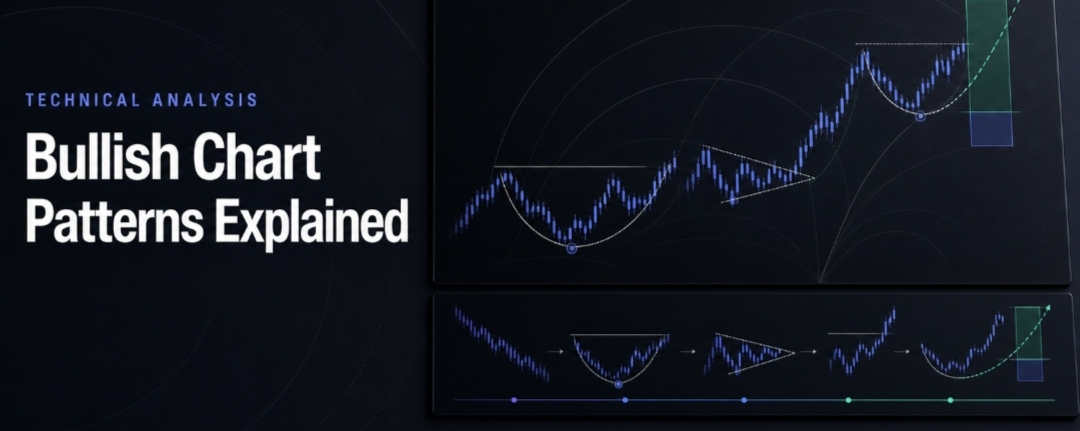
One of the most reliable bullish patterns is the Cup and Handle. This formation appears after a period of consolidation, where the price creates a rounded bottom followed by a smaller pullback. A breakout above the handle often signals renewed buying momentum and can lead to a strong upward trend if supported by increasing trading volume.
Another powerful pattern is the Ascending Triangle. It forms when the price repeatedly tests a horizontal resistance level while making higher lows. This shows that buyers are becoming more aggressive and gradually absorbing selling pressure. A breakout above the resistance level often confirms the continuation of the bullish trend.
The Bull Flag is another favorite among experienced traders. It develops after a sharp upward move, followed by a brief period of sideways or slightly downward consolidation. This pause allows the market to cool down before buyers potentially regain control. When the price breaks above the flag with strong volume, it often signals the start of the next leg higher.
Although these patterns are widely used, they should never be traded in isolation. Traders should always confirm breakouts with higher trading volume, overall market sentiment, and key support and resistance levels. Combining chart patterns with proper risk management can significantly improve trading decisions.
As the crypto market continues to evolve, mastering these bullish formations can help traders identify opportunities earlier and avoid emotional decision-making. Patience, discipline, and waiting for confirmation remain the keys to long-term success in any market.