🔍 What's Happening
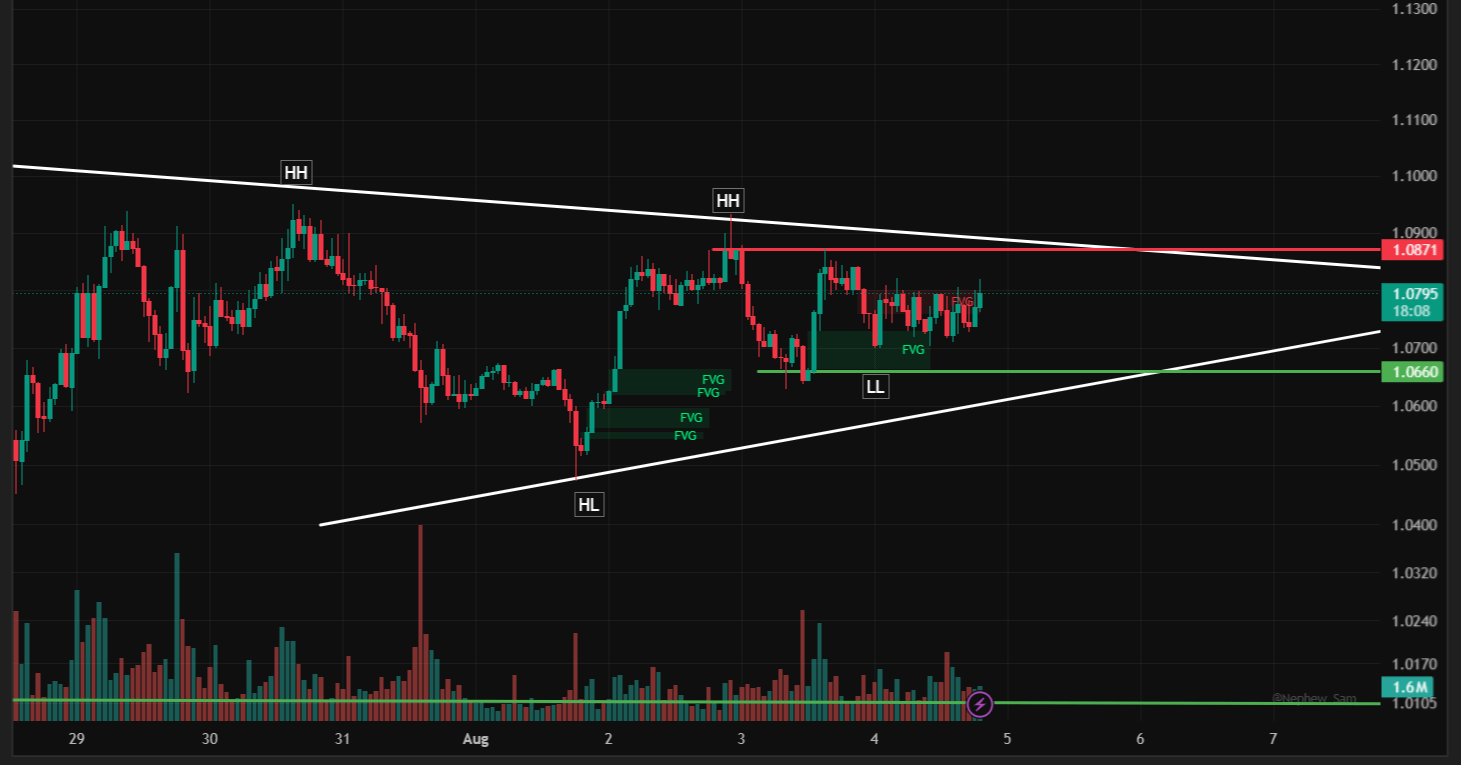
XRP is trading inside a well-defined symmetrical triangle — a descending resistance line connecting two Higher Highs is converging with an ascending support line connecting a Higher Low and a recent Low. This is a classic compression pattern, and with the two boundaries narrowing, a decisive move is approaching. 💧
🧱 Structure Breakdown
Descending Resistance: Two Higher Highs near $1.10 and $1.0871 have formed a clean downward-sloping resistance line. 🔴
Ascending Support: A Higher Low near $1.05 and a more recent Low near $1.0660 have formed a rising support line. 🟢
Current Position: Price is trading at $1.0811, roughly mid-triangle, having bounced off the $1.0660 support and pushing back toward the $1.0871 resistance. ⚖️
The Apex: The two trendlines are converging over the next several days — triangles like this typically resolve with a sharp breakout in one direction once price nears the point of convergence. 🎯
Symmetrical triangles are neutral by nature — the breakout direction determines the trade, not the pattern itself. Here's how to approach both scenarios. 🔱
🎯 Trade Setup (Breakout Watch — Both Scenarios)
⚠️ This is a compression pattern with no confirmed direction yet — trade the breakout, not the prediction.
📈 Bullish Scenario (Break Above Resistance)
🔹 Entry: $1.0880 – $1.0900 — on a confirmed close above the $1.0871 resistance, or on a retest of $1.0800–$1.0830
🛑 Stop Loss: $1.0640 — below the triangle's support line and recent Low
🎯 TP1: $1.10 — round-number resistance, matches the upper trendline origin
🎯 TP2: $1.12
🎯 TP3: $1.15 — extended target on strong momentum 🚀
📉 Bearish Scenario (Break Below Support)
🔹 Entry: $1.0630 – $1.0650 — on a confirmed close below the $1.0660 support
🛑 Stop Loss: $1.0900 — above the triangle's resistance line
🎯 TP1: $1.0400 — prior Higher Low zone
🎯 TP2: $1.0000 — round-number support 🌊
📐 Risk-to-Reward: Roughly 1:2.5 to 1:4 on either scenario — always size positions to your own risk tolerance 🧮
⚠️ Risk Notes
Triangles often produce false breakouts (fakeouts) before the real move — wait for a confirmed close beyond the boundary, not just a wick. 👀
The longer price stays inside the triangle, the more explosive the eventual breakout tends to be. ⚡
Avoid guessing the direction — let price confirm before committing size in either direction. 🔱
📌 Disclaimer
This analysis is provided for educational and informational purposes only. It is NOT financial advice. 🚫💼 Always do your own research (DYOR), manage your position size carefully, and never trade with funds you cannot afford to lose. 🙏
@Binance Square Official #BitcoinRecoversTo$64100 #USIranDealOrNoDeal #SpaceXFirstLockupExpiresAug6 #Binance #ChartSniper