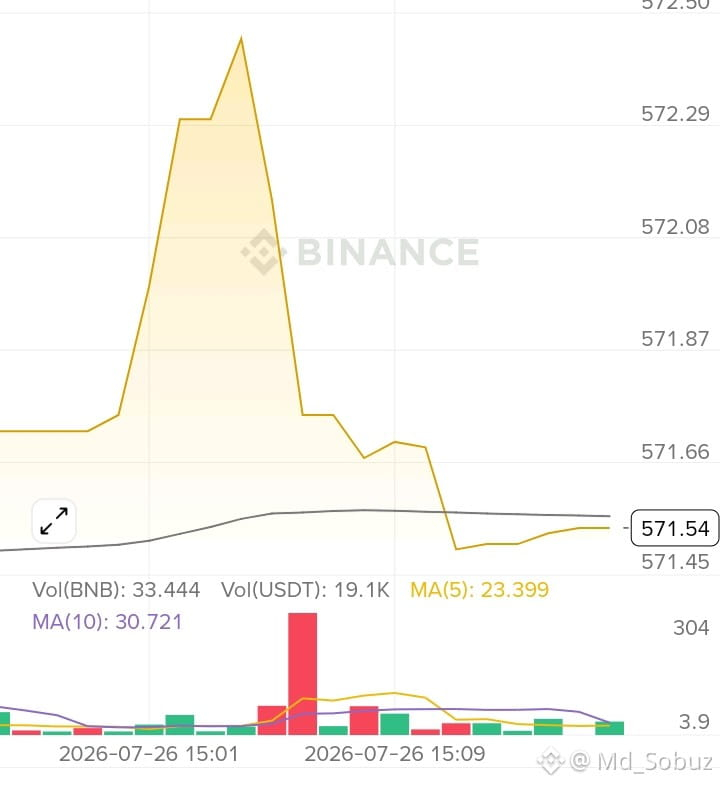
$BNB 2. Detailed Breakdown of Elements:
Current Price (571.54 USDT): Shows the current live price of 1 $BNB in terms of USDT (Tether).
Price Line (Yellow Line with Gradient): Shows price fluctuations between 15:01 and 15:09.
Price Surge (Pump): The price sharply spiked up from around 571.66 to a high of 572.50 USDT.
Price Drop The price quickly dumped back down to a low near 571.45 USDT.
Volume Bars
The large red bar near 15:07 indicates heavy selling volume (sell pressure), which caused the sharp price drop.
Green bars indicate buying volume.
Moving Averages (MA):
MA(5): 23.399 (Yellow line) — Short-term price trend average (5-period).
MA(10): 30.721 (Purple line) — Medium-term price trend average.
Time Scale Displays short-term minute intervals
3. What is it used for?
Technical Analysis Traders use these charts to identify price trends, support/resistance levels, and market momentum.
Executing Trades: Helps day traders decide when to Buy (Long) or Sell (Short/Take Profit).
Monitoring Market Volatility: Helps track sudden price pumps and dumps in real time
Current Price (571.54 USDT): Shows the current live price of 1 $BNB in terms of USDT (Tether).
Price Line (Yellow Line with Gradient): Shows price fluctuations between 15:01 and 15:09.
Price Surge (Pump): The price sharply spiked up from around 571.66 to a high of 572.50 USDT.
Price Drop The price quickly dumped back down to a low near 571.45 USDT.
Volume Bars
The large red bar near 15:07 indicates heavy selling volume (sell pressure), which caused the sharp price drop.
Green bars indicate buying volume.
Moving Averages (MA):
MA(5): 23.399 (Yellow line) — Short-term price trend average (5-period).
MA(10): 30.721 (Purple line) — Medium-term price trend average.
Time Scale Displays short-term minute intervals
3. What is it used for?
Technical Analysis Traders use these charts to identify price trends, support/resistance levels, and market momentum.
Executing Trades: Helps day traders decide when to Buy (Long) or Sell (Short/Take Profit).
Monitoring Market Volatility: Helps track sudden price pumps and dumps in real time