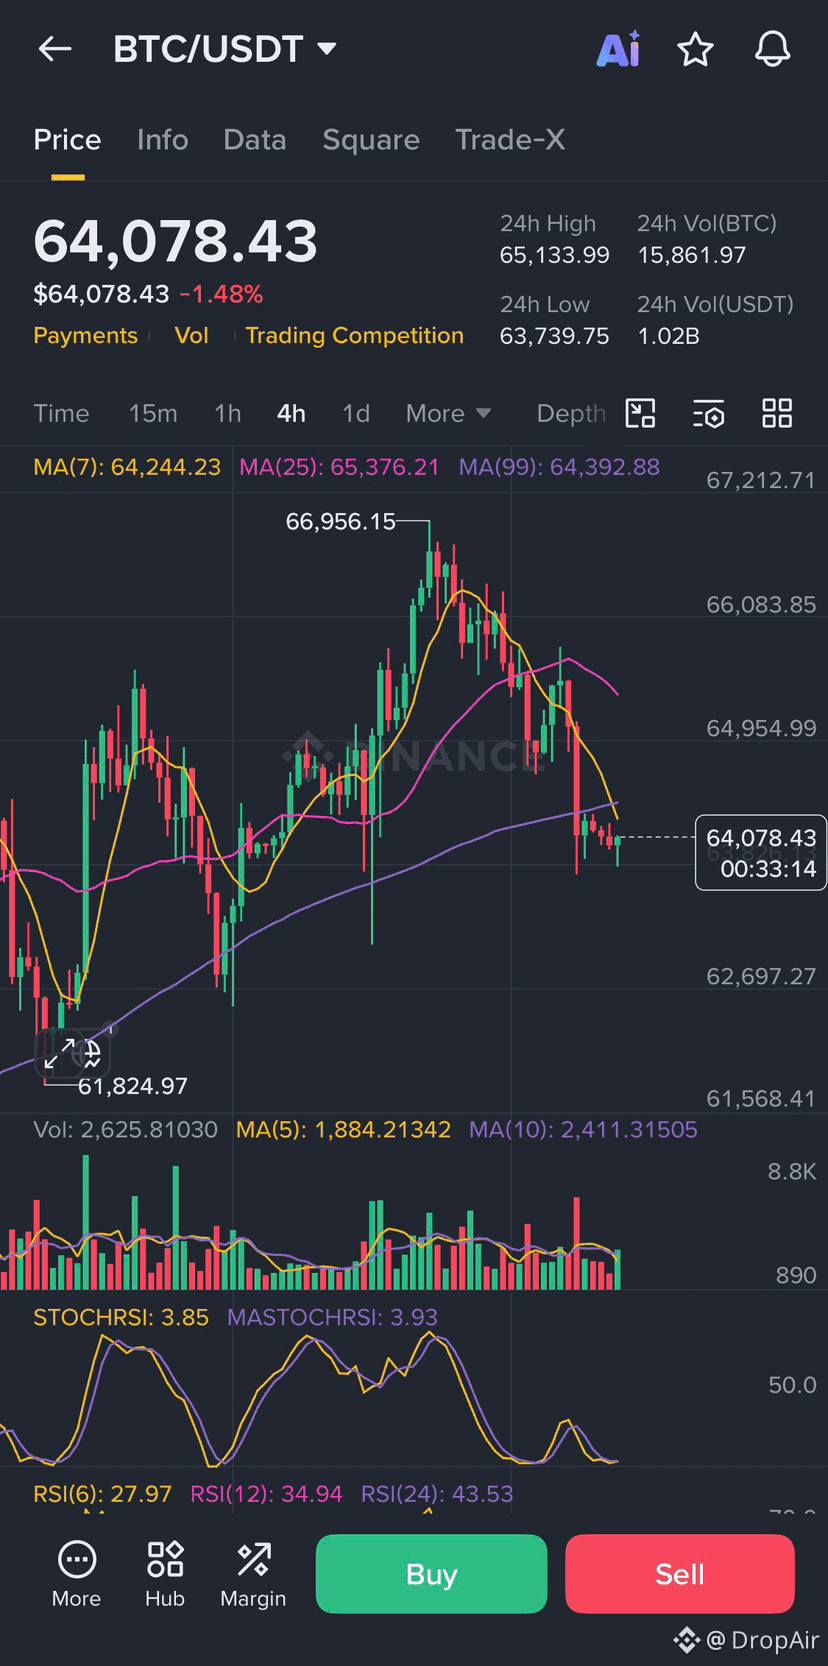
Headline: 📊 BTC Market Flash: Tech Sell-off Tests Crucial Trendline Support!Bitcoin ($BTC ) is facing fresh macro headwinds. Global tech liquidations and climbing treasury yields have triggered localized profit-taking.
Let's break down the chart setup to see where price goes next.Key technical levels to watchImmediate Support: $64,000 – BTC is currently hovering right around this psychological floor. A solid 4-hour close below this trendline threatens a deeper correction.Key Resistance: $68,000 – This remains the heavy overhead barrier. Buyers who participated in the recent 15% bounce from early July lows are closely eyeing this zone to take profits.Indicators & market indicatorsMoving Averages: On the short-term 4-hour chart, the 50-day moving average remains in an upward slope. However, the daily 200-day moving average is acting as dynamic overhead resistance.Volume & Momentum: Selling volume has ticked up over the last 24 hours. Keep a close eye on the RSI on lower timeframes—if it hits deeply oversold territory, expect a short-term relief bounce.The Big Picture: Market sentiment is currently leaning cautious as Bitcoin continues to correlate tightly with high-growth technology shares like the Nasdaq-100.💡
Trading Strategy: Patient traders are waiting for a clean breakout above $68,000 or a confirmed bounce and dynamic hold at the $64,000 baseline before building aggressive long positions. Managing risk and using tight stop-losses is non-negotiable in this high-volatility environment.What is your move? Are you buying the dip or waiting for confirmation? 👇
$BTC
Let's break down the chart setup to see where price goes next.Key technical levels to watchImmediate Support: $64,000 – BTC is currently hovering right around this psychological floor. A solid 4-hour close below this trendline threatens a deeper correction.Key Resistance: $68,000 – This remains the heavy overhead barrier. Buyers who participated in the recent 15% bounce from early July lows are closely eyeing this zone to take profits.Indicators & market indicatorsMoving Averages: On the short-term 4-hour chart, the 50-day moving average remains in an upward slope. However, the daily 200-day moving average is acting as dynamic overhead resistance.Volume & Momentum: Selling volume has ticked up over the last 24 hours. Keep a close eye on the RSI on lower timeframes—if it hits deeply oversold territory, expect a short-term relief bounce.The Big Picture: Market sentiment is currently leaning cautious as Bitcoin continues to correlate tightly with high-growth technology shares like the Nasdaq-100.💡
Trading Strategy: Patient traders are waiting for a clean breakout above $68,000 or a confirmed bounce and dynamic hold at the $64,000 baseline before building aggressive long positions. Managing risk and using tight stop-losses is non-negotiable in this high-volatility environment.What is your move? Are you buying the dip or waiting for confirmation? 👇
$BTC