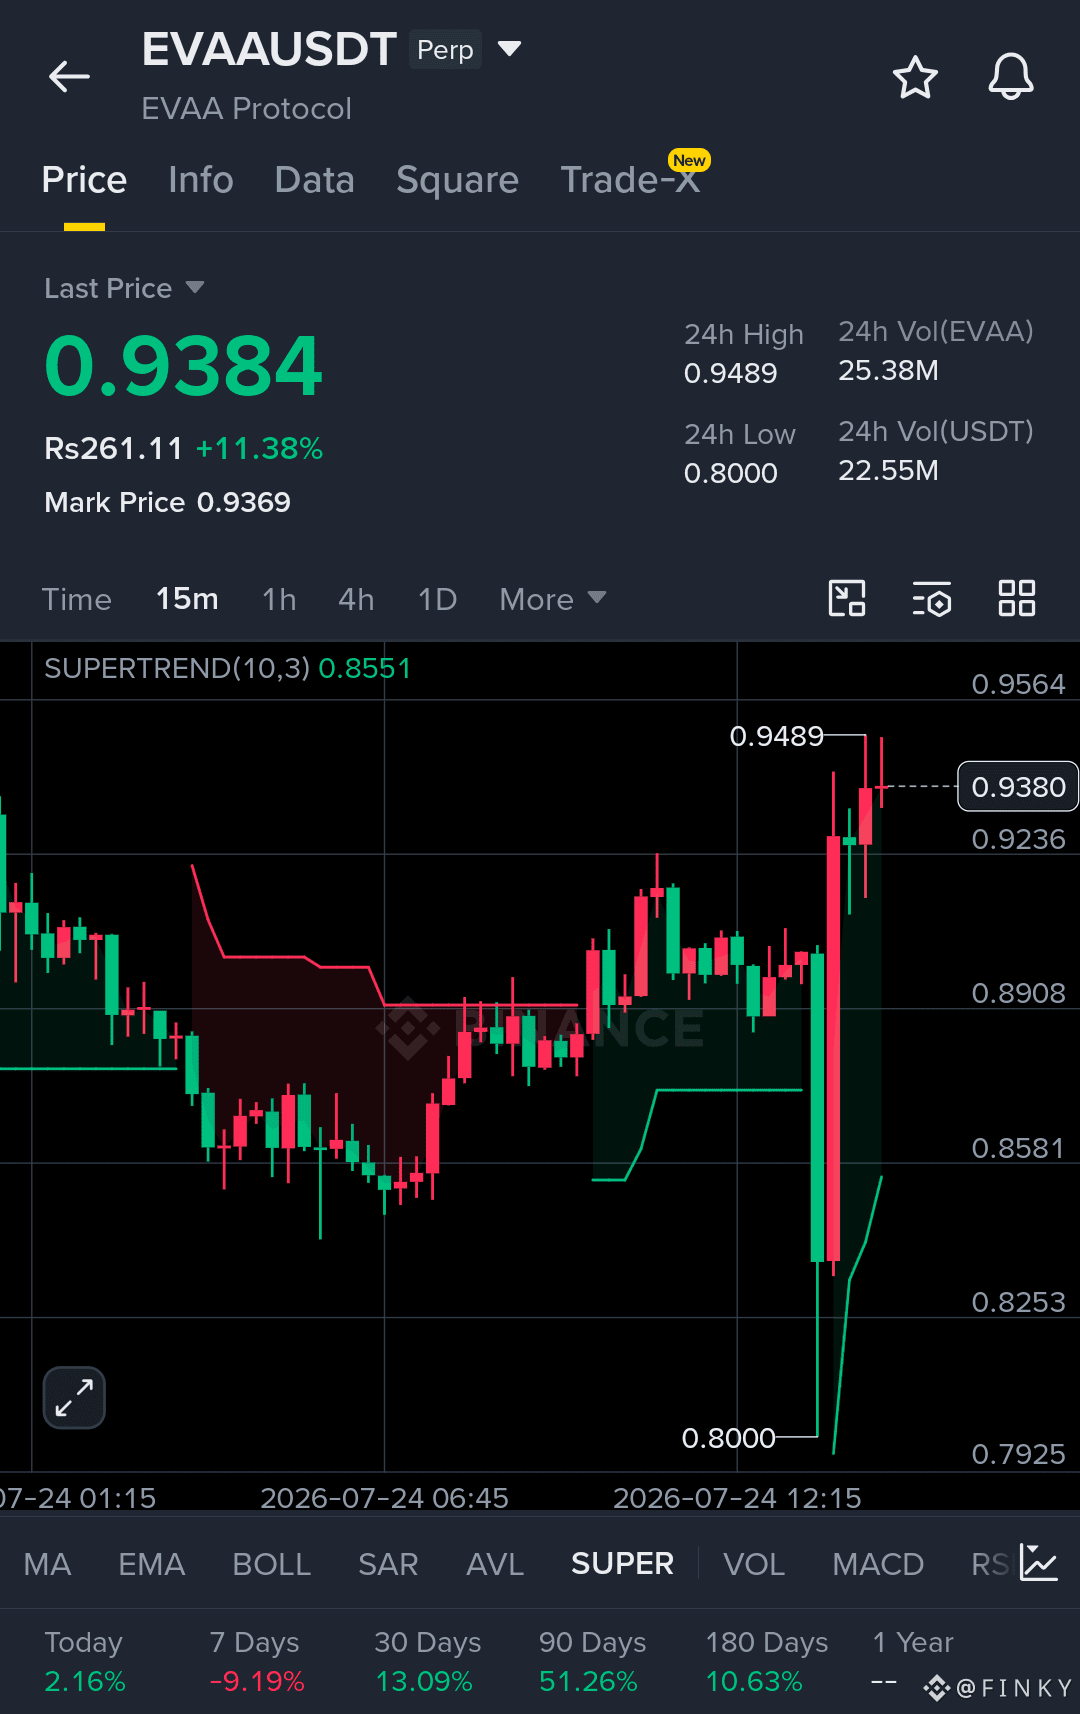

$EVAA affiche un fort redressement et l’indicateur de tendance le confirme également.
Le prix est actuellement à 0,9384 $, en hausse de 11,38 % au cours des dernières 24 heures. Il a touché un point bas à 0,8000 $ et est monté jusqu’à un plus haut à 0,9489 $ avant de se stabiliser là où il se trouve maintenant.
Le graphique raconte clairement une reprise. Au début, le prix baissait, et la ligne Supertrend est passée au rouge, signalant une tendance baissière tandis qu’elle glissait vers ce creux à 0,80 $. Une fois le point bas atteint, les acheteurs sont intervenus et ont fait remonter le prix. La ligne Supertrend est repassée en vert juste autour de 0,86 $, marquant le changement, puis le prix est monté régulièrement au-dessus de 0,89, puis 0,92, avant de franchir plus haut avec une forte bougie verte qui est allée directement jusqu’à 0,9489 $. Après ce pic, il a légèrement corrigé et se maintient désormais près de 0,9380.
Le volume accompagne aussi le mouvement : plus de 25,38 millions d’EVAA échangés, pour une valeur d’environ 22,55 millions USDT.
En regardant plus large, aujourd’hui est en hausse de 2,16 %, la semaine est en réalité en baisse de 9,19 %, mais les 30 derniers jours sont en hausse de 13,09 %, les 90 jours en hausse de 51,26 %, et les 180 jours en hausse de 10,63 %. Donc, malgré une semaine un peu difficile, la tendance à moyen et long terme reste nettement positive.
On dirait un rebond sain à partir d’une zone de support solide, avec l’indicateur de tendance qui confirme le passage d’une dynamique baissière à haussière. À surveiller pour voir s’il se maintient au-dessus de 0,90 $ ou s’il se refroidit à partir d’ici. Comme toujours, ceci est uniquement de la lecture de graphique, pas un conseil : veuillez faire vos propres recherches avant de prendre une quelconque décision de trading.
#GlobalTechStocksExtendSelloff #SenateRejectsIranWarPowersResolution #KRXActivatesSellSideSidecar #WTIUp6.17%BrentUp7.04% #DowJonesFallsOver500Points
Le prix est actuellement à 0,9384 $, en hausse de 11,38 % au cours des dernières 24 heures. Il a touché un point bas à 0,8000 $ et est monté jusqu’à un plus haut à 0,9489 $ avant de se stabiliser là où il se trouve maintenant.
Le graphique raconte clairement une reprise. Au début, le prix baissait, et la ligne Supertrend est passée au rouge, signalant une tendance baissière tandis qu’elle glissait vers ce creux à 0,80 $. Une fois le point bas atteint, les acheteurs sont intervenus et ont fait remonter le prix. La ligne Supertrend est repassée en vert juste autour de 0,86 $, marquant le changement, puis le prix est monté régulièrement au-dessus de 0,89, puis 0,92, avant de franchir plus haut avec une forte bougie verte qui est allée directement jusqu’à 0,9489 $. Après ce pic, il a légèrement corrigé et se maintient désormais près de 0,9380.
Le volume accompagne aussi le mouvement : plus de 25,38 millions d’EVAA échangés, pour une valeur d’environ 22,55 millions USDT.
En regardant plus large, aujourd’hui est en hausse de 2,16 %, la semaine est en réalité en baisse de 9,19 %, mais les 30 derniers jours sont en hausse de 13,09 %, les 90 jours en hausse de 51,26 %, et les 180 jours en hausse de 10,63 %. Donc, malgré une semaine un peu difficile, la tendance à moyen et long terme reste nettement positive.
On dirait un rebond sain à partir d’une zone de support solide, avec l’indicateur de tendance qui confirme le passage d’une dynamique baissière à haussière. À surveiller pour voir s’il se maintient au-dessus de 0,90 $ ou s’il se refroidit à partir d’ici. Comme toujours, ceci est uniquement de la lecture de graphique, pas un conseil : veuillez faire vos propres recherches avant de prendre une quelconque décision de trading.
#GlobalTechStocksExtendSelloff #SenateRejectsIranWarPowersResolution #KRXActivatesSellSideSidecar #WTIUp6.17%BrentUp7.04% #DowJonesFallsOver500Points