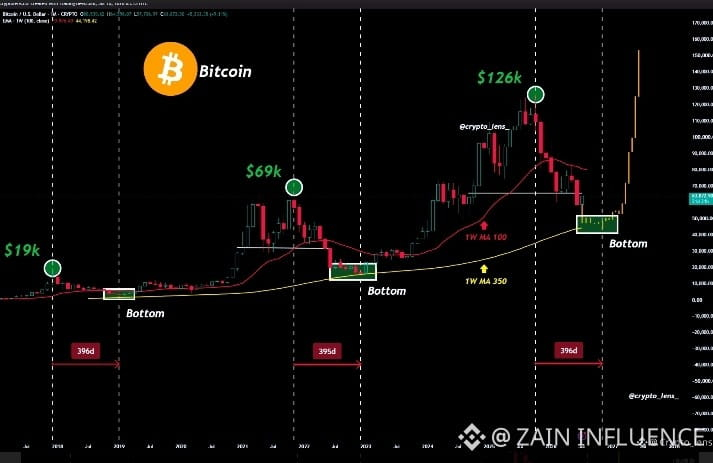
The $BTC Chart That Has NEVER Been Wrong! 🧵👇
$BTC Everyone is panicking, but the macro data remains simpler than it seems. Let's look at the historical math of Bitcoin bear cycles:
⏳ History: Bear markets average ~395 days.
⏱️ Current State: We are only 270 days into this cycle.
🎯 The Bottom: Math points to a final bottom between $39k and $49k, likely hitting in the next 1–2 months.
The game plan? Stop letting short-term noise dictate your emotions. Smart money uses these phases to accumulate.
Save this post, bookmark the chart, and let’s see how it plays out. 🤝
Where do you think the bottom is? Drop your predictions below! 👇
#BTC #bitcoin #cryptouniverseofficial #bullish #dyor
$BTC Everyone is panicking, but the macro data remains simpler than it seems. Let's look at the historical math of Bitcoin bear cycles:
⏳ History: Bear markets average ~395 days.
⏱️ Current State: We are only 270 days into this cycle.
🎯 The Bottom: Math points to a final bottom between $39k and $49k, likely hitting in the next 1–2 months.
The game plan? Stop letting short-term noise dictate your emotions. Smart money uses these phases to accumulate.
Save this post, bookmark the chart, and let’s see how it plays out. 🤝
Where do you think the bottom is? Drop your predictions below! 👇
#BTC #bitcoin #cryptouniverseofficial #bullish #dyor