🚨 BTC 4H CHART UPDATE: Bulls Holding, but is a Pullback Coming? 🚨
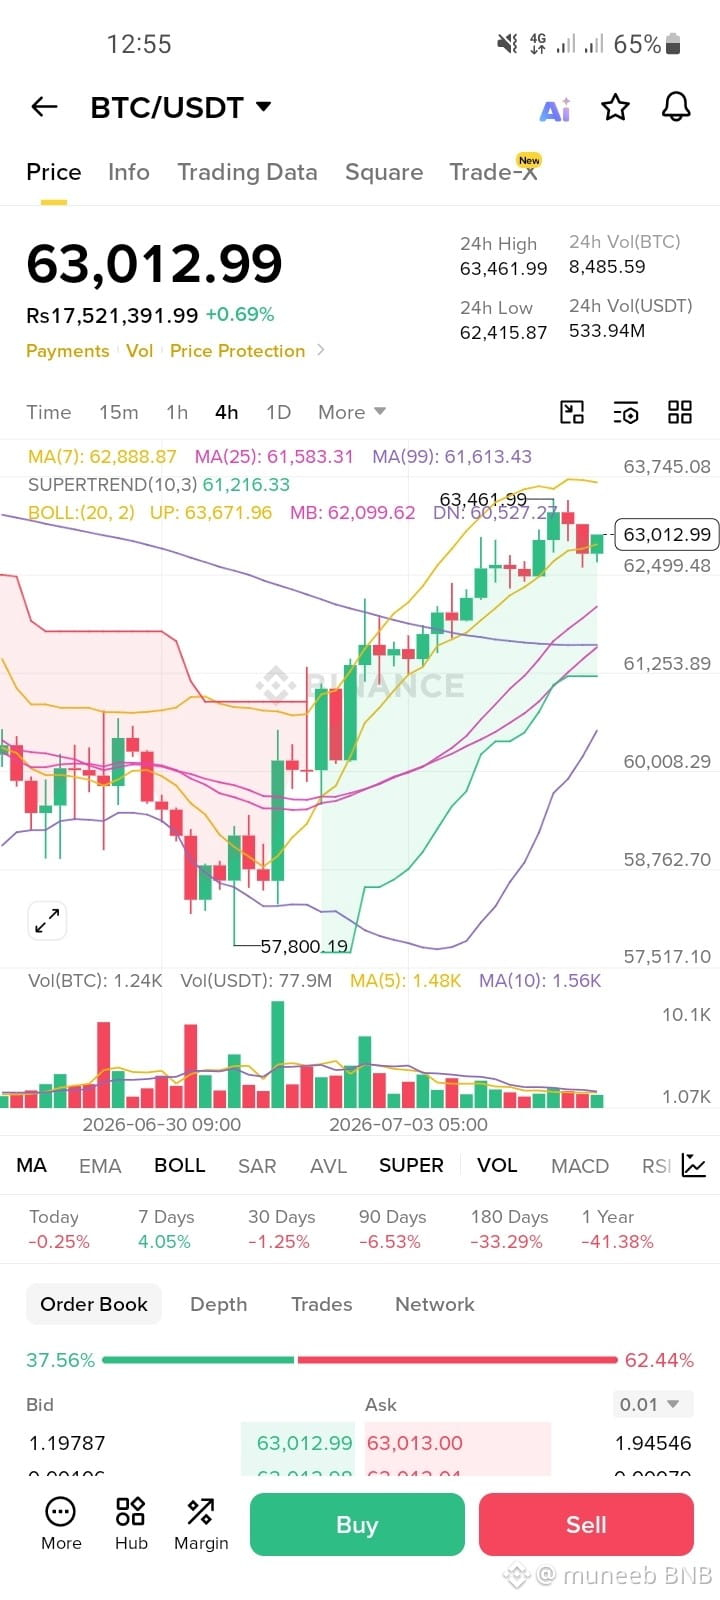
Looking at the 4-hour chart for BTC/USDT in 1000348742.jpg, Bitcoin is sitting at $63,012.99 after a strong rally from its recent local bottom near $57,800.
Here is exactly what the technicals are telling us right now:
Bullish Momentum: The price is trading comfortably above the MA(7) ($62,888), MA(25) ($61,583), and the SuperTrend line ($61,216), showing that buyers are still fundamentally in control of the short-term trend.
The Resistance Wall: We just saw a rejection from the 24h high of $63,461.99, which lines up tightly with the Upper Bollinger Band ($63,671). The last few 4H candles are showing minor profit-taking (red candles).
Voluming Fading: Notice the volume bars at the bottom—they are drying up. A price increase on declining volume usually signals exhaustion, meaning the bulls might need a breather.
💡 The Game Plan:
Support to Watch: If we pull back, look for strong buyers to step in around $62,099 (the Bollinger Middle Band) or the $61,200 - $61,500 zone. Holding this keeps the uptrend incredibly healthy.
The Target: If bulls can consolidate here and break past $63,500 with strong volume, the next stop is aiming for a clean run toward $65k+.
What’s your move? Buying the dip or waiting for a deeper correction? Let me know below! 👇
$BTC
#VitalikOutlinesLeanEthereumRoadmap IRENFalls10%After$700MCoCEOStockAwardEthicalHackersFindAptosFlawRisking$70BEthicalHackersFindAptosFlawRisking$70BMonadTVLTops$447.9MSurpassingSui#BrazilCentralBankSaysStablecoinsElectronicMoney USM2MoneySupplyHitsRecord$23.05T#UKFCAPublishesCryptoRegFramework StablecoinMarketCapFalls$10BTo$300B#MoonbeamToMigrateGLMRToBase #BitcoinFallsOver50%FromOctoberHigh
Looking at the 4-hour chart for BTC/USDT in 1000348742.jpg, Bitcoin is sitting at $63,012.99 after a strong rally from its recent local bottom near $57,800.
Here is exactly what the technicals are telling us right now:
Bullish Momentum: The price is trading comfortably above the MA(7) ($62,888), MA(25) ($61,583), and the SuperTrend line ($61,216), showing that buyers are still fundamentally in control of the short-term trend.
The Resistance Wall: We just saw a rejection from the 24h high of $63,461.99, which lines up tightly with the Upper Bollinger Band ($63,671). The last few 4H candles are showing minor profit-taking (red candles).
Voluming Fading: Notice the volume bars at the bottom—they are drying up. A price increase on declining volume usually signals exhaustion, meaning the bulls might need a breather.
💡 The Game Plan:
Support to Watch: If we pull back, look for strong buyers to step in around $62,099 (the Bollinger Middle Band) or the $61,200 - $61,500 zone. Holding this keeps the uptrend incredibly healthy.
The Target: If bulls can consolidate here and break past $63,500 with strong volume, the next stop is aiming for a clean run toward $65k+.
What’s your move? Buying the dip or waiting for a deeper correction? Let me know below! 👇
$BTC
#VitalikOutlinesLeanEthereumRoadmap IRENFalls10%After$700MCoCEOStockAwardEthicalHackersFindAptosFlawRisking$70BEthicalHackersFindAptosFlawRisking$70BMonadTVLTops$447.9MSurpassingSui#BrazilCentralBankSaysStablecoinsElectronicMoney USM2MoneySupplyHitsRecord$23.05T#UKFCAPublishesCryptoRegFramework StablecoinMarketCapFalls$10BTo$300B#MoonbeamToMigrateGLMRToBase #BitcoinFallsOver50%FromOctoberHigh