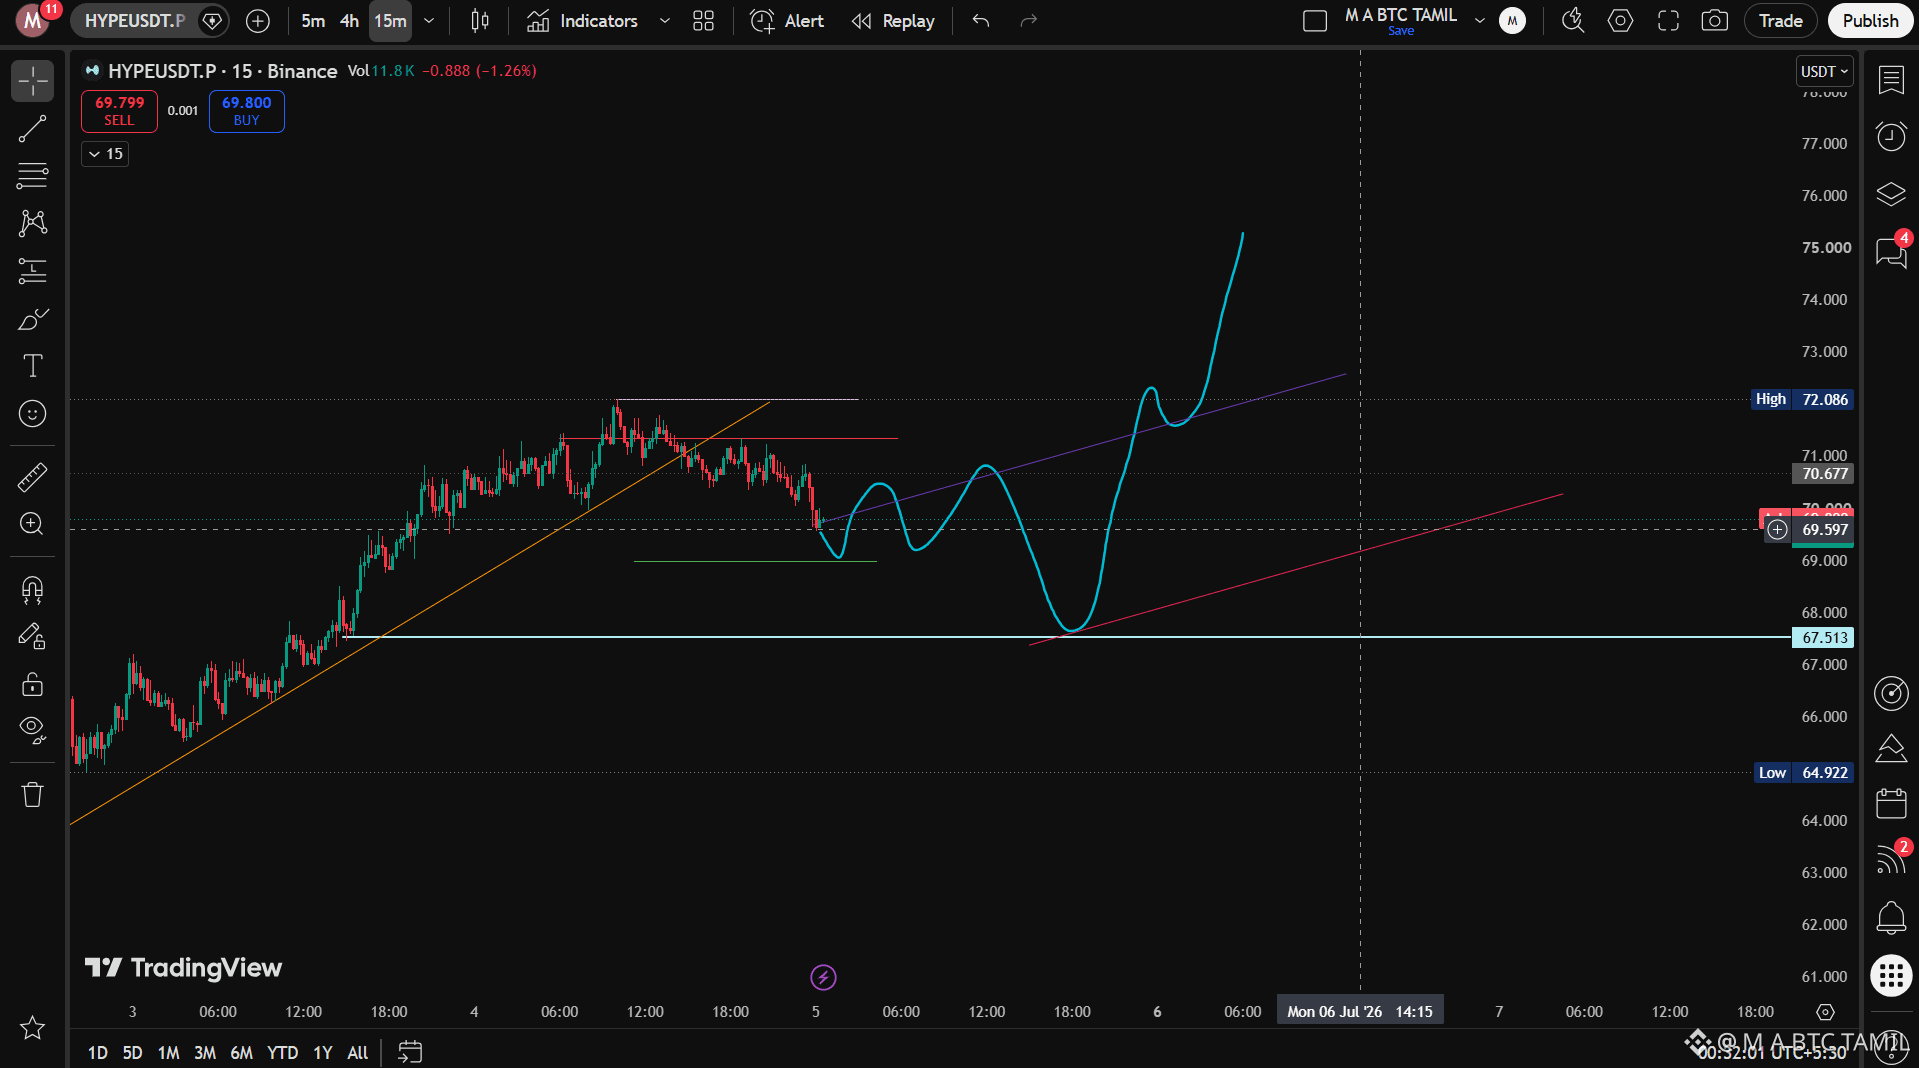
🚀 HYPEUSDT.P – Technical Analysis (15M)
📈 HYPE Pullback Before the Next Breakout?
HYPE is currently trading around $69.60, approaching a key intraday support area after rejecting from recent highs. Instead of signaling weakness, this pullback appears to be a healthy retracement within an overall bullish structure.
The chart suggests that buyers may step in near support before attempting another push toward higher resistance levels.
📊 Key Support Levels
🟢 $69.20 – Immediate Support
🟢 $67.50 – Strong Demand Zone
🟢 $64.90 – Major Swing Support
As long as HYPE remains above $67.50, the bullish outlook remains valid.
🎯 Key Resistance Levels
🔴 $70.67 – First Resistance
🔴 $72.08 – Major Breakout Zone
🎯 $75.00+ – Bullish Target After Breakout
A strong close above $72.08 could trigger the next leg higher toward $75.00 and potentially beyond.
🚀 Bullish Scenario
Price holds the $69.20–$67.50 support zone.
Buyers regain momentum with increasing volume.
Break above $70.67 confirms bullish continuation.
Next targets: $72.08 → $75.00+
⚠️ Bearish Scenario
Losing $67.50 may trigger a deeper correction.
The next major support lies around $64.90.
Buyers should watch for bullish confirmation before entering after any breakdown.
💡 Trading Plan
✅ Wait for confirmation before entering.
✅ A breakout above $70.67 offers a stronger long setup.
✅ If price revisits $67.50 and forms a bullish reversal, it may provide a high-probability buying opportunity.
✅ Always use a stop-loss and proper risk management.
📌 Conclusion
HYPE continues to maintain a bullish market structure despite the current pullback. If the support zone holds and buyers reclaim momentum, a breakout above $72.08 could open the door for a rally toward $75.00 and higher.
> Disclaimer: This analysis is for educational purposes only and should not be considered financial advice. Always do your own research (DYOR) and manage your risk before trading.