BTC Slips Below $60K Again – Buy the Dip or Wait and See? 📉
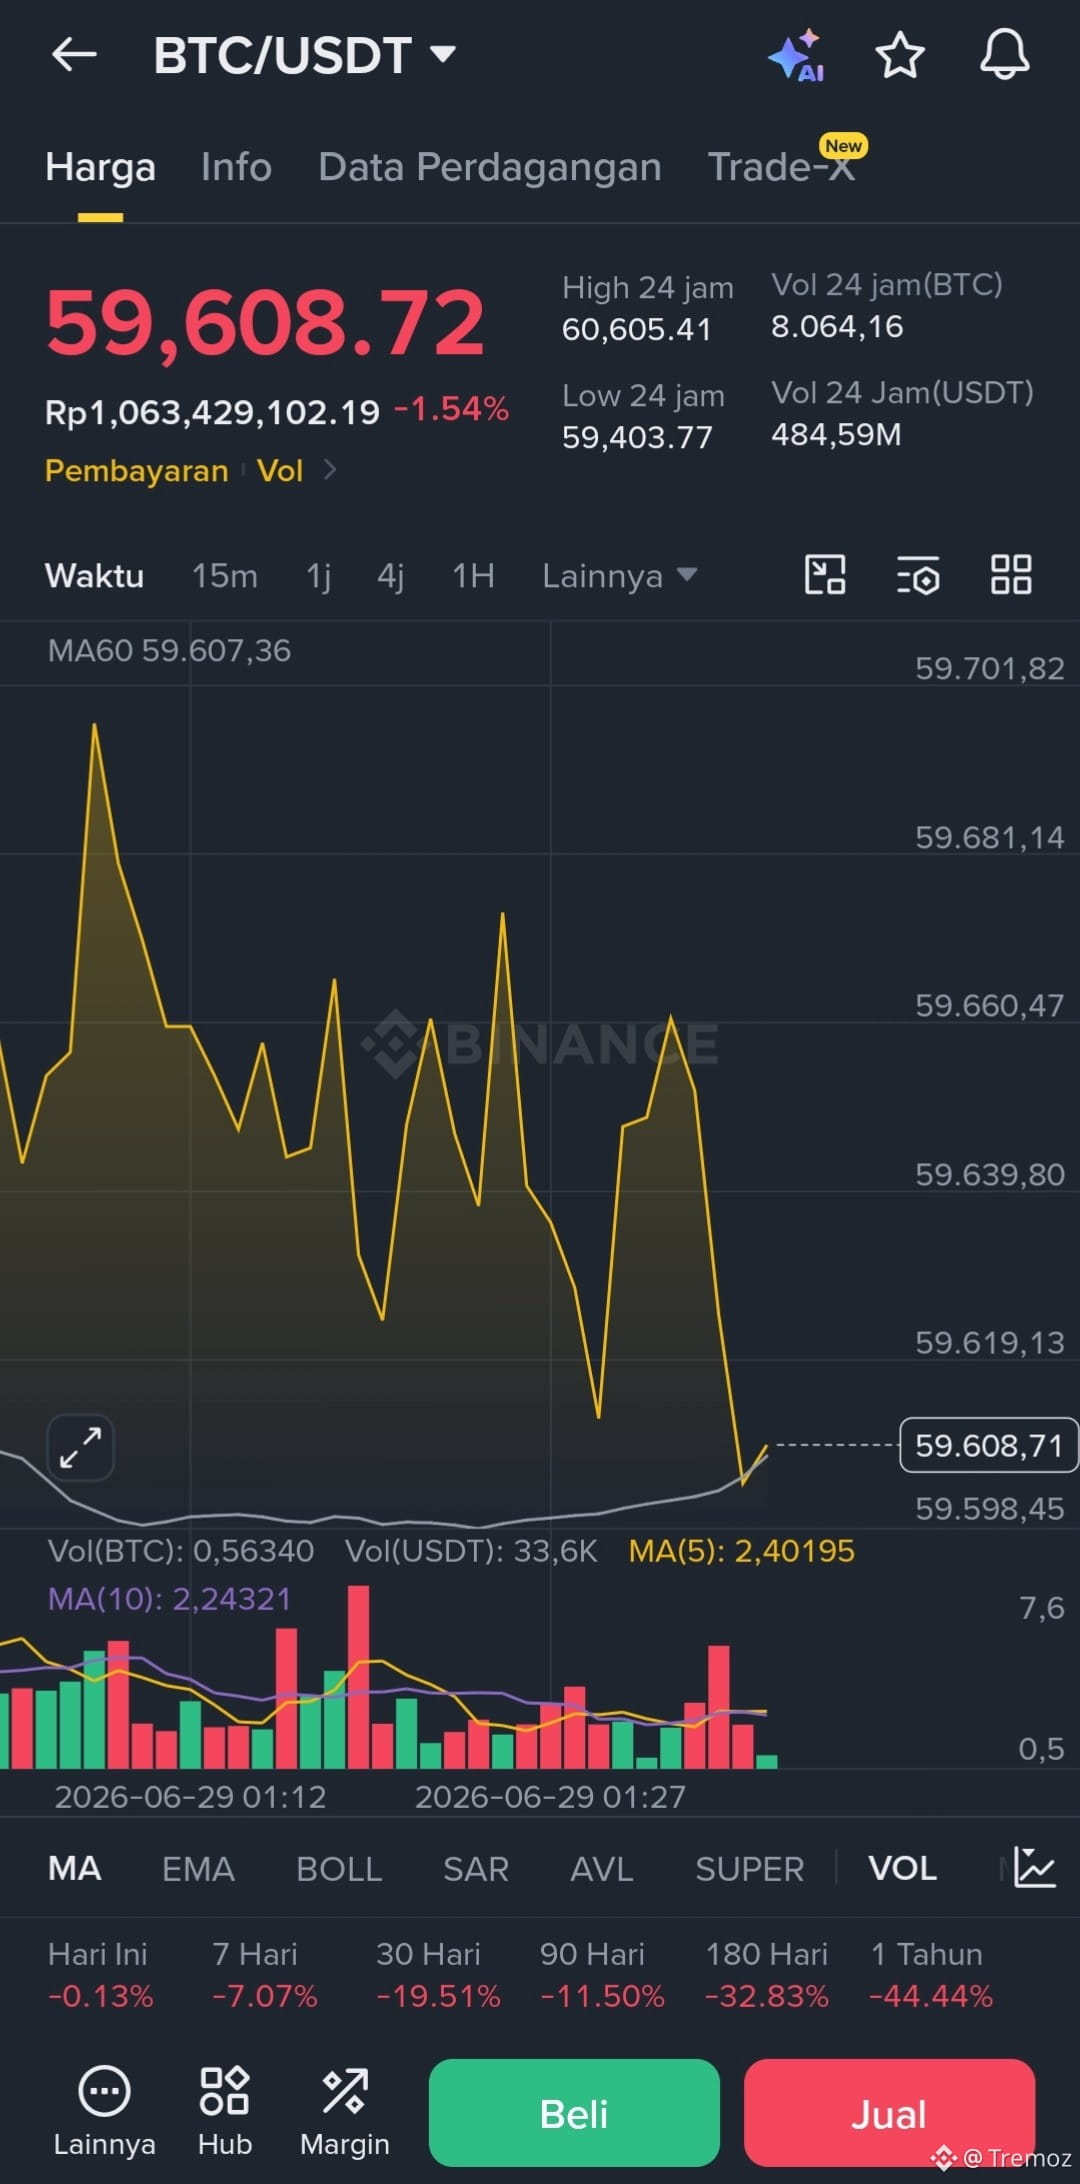
Looking at the BTC/USDT chart today, Bitcoin is under pressure again, sliding down to the 59,608.72 USDT level (-1.54%).
If we look at its medium to long-term performance, BTC's price action is clearly going through a heavy correction phase (all major timeframes are flashing red):
7 Days: -7.07%
30 Days: -19.51%
1 Year: -44.44%
Right now, the price is hovering near its 24-hour low of 59,403.77 USDT after hitting an intraday high of 60,605.41 USDT. Will this $59K area act as a strong support for a bounce back above $60K, or are we heading for a deeper correction?
Share your thoughts or buy targets in the comments! 👇
#BTC走势分析 #Bitcoin #Trading #BinanceSquare
Looking at the BTC/USDT chart today, Bitcoin is under pressure again, sliding down to the 59,608.72 USDT level (-1.54%).
If we look at its medium to long-term performance, BTC's price action is clearly going through a heavy correction phase (all major timeframes are flashing red):
7 Days: -7.07%
30 Days: -19.51%
1 Year: -44.44%
Right now, the price is hovering near its 24-hour low of 59,403.77 USDT after hitting an intraday high of 60,605.41 USDT. Will this $59K area act as a strong support for a bounce back above $60K, or are we heading for a deeper correction?
Share your thoughts or buy targets in the comments! 👇
#BTC走势分析 #Bitcoin #Trading #BinanceSquare