$DOT analysis
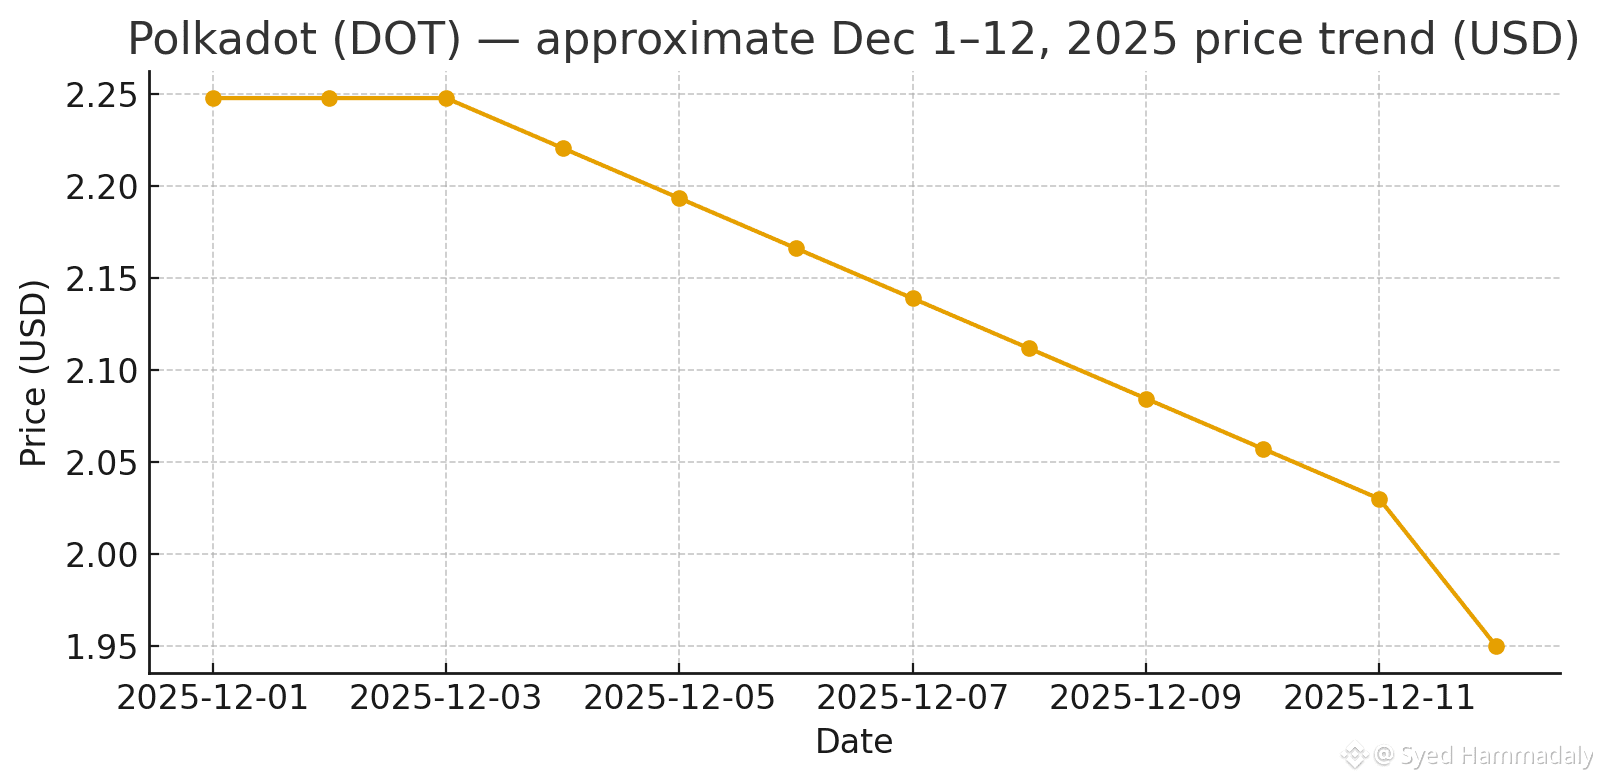
Short-term trend: downtrend over the last 1–2 weeks, with a notable drop on Dec 11 when DOT fell to about $2.03 after breaching key support.
Key levels to watch (technical): short-term support ~$1.96–$2.00, resistance around $2.30 (prior swing/psychological). These levels are mentioned in market commentary and technical breakdowns.
Short technical analysis
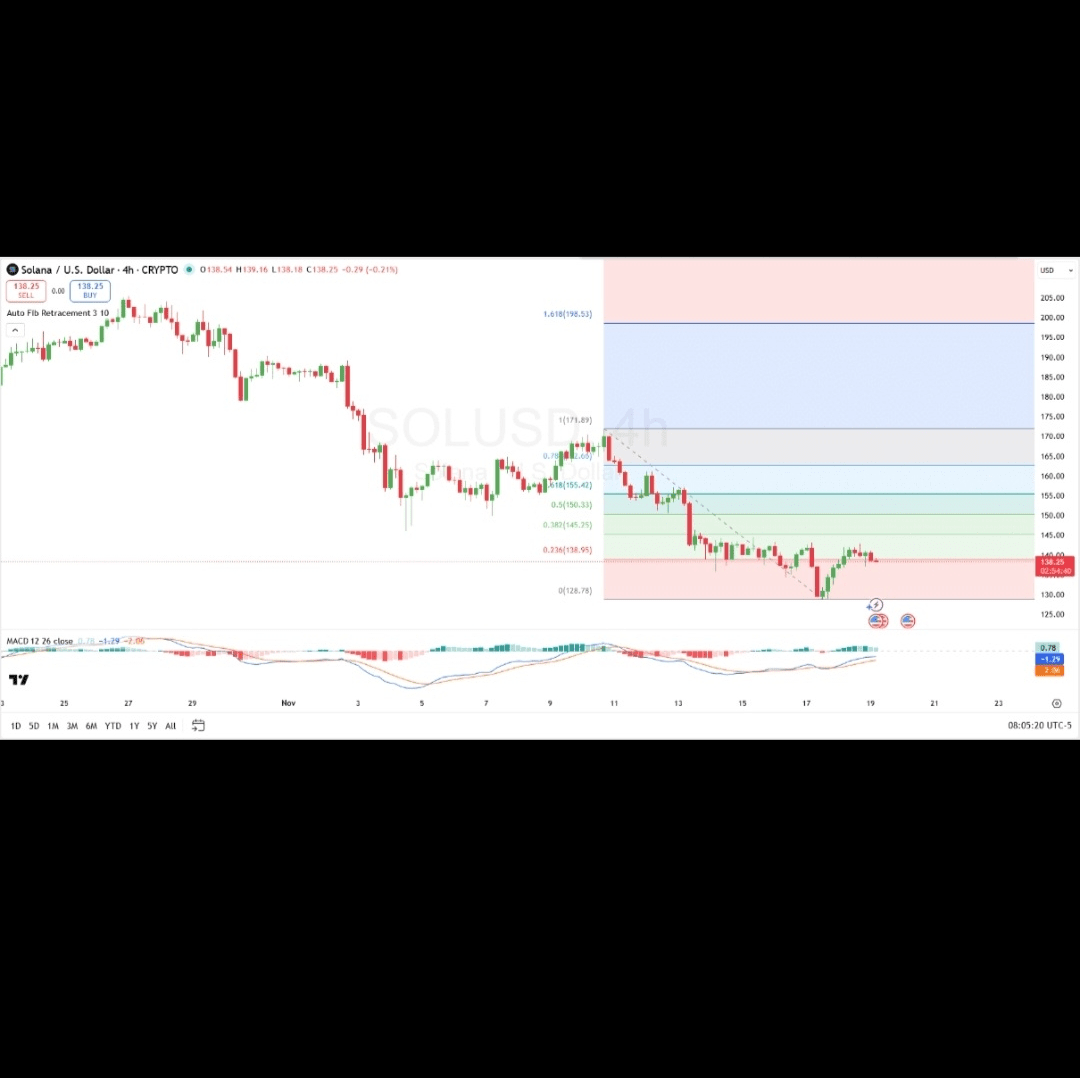
Price action: DOT has given up recent gains and shows lower highs / lower lows on the daily chart a bearish short-term structure. Recent commentary points to collapsing open interest and a bearish MACD crossover, which supports the short-term weakness view.
Indicators (summary of published analyses): momentum indicators have turned cautious; analysts highlight a failed bullish setup and warn of a deeper retracement if $1.96–$2.00 fails. Conversely, reclaiming $2.30–$2.40 would be the first sign of renewed short-term strength.
#Dotusdt
#Market_Update
#altcoins
Short-term trend: downtrend over the last 1–2 weeks, with a notable drop on Dec 11 when DOT fell to about $2.03 after breaching key support.
Key levels to watch (technical): short-term support ~$1.96–$2.00, resistance around $2.30 (prior swing/psychological). These levels are mentioned in market commentary and technical breakdowns.
Short technical analysis
Price action: DOT has given up recent gains and shows lower highs / lower lows on the daily chart a bearish short-term structure. Recent commentary points to collapsing open interest and a bearish MACD crossover, which supports the short-term weakness view.
Indicators (summary of published analyses): momentum indicators have turned cautious; analysts highlight a failed bullish setup and warn of a deeper retracement if $1.96–$2.00 fails. Conversely, reclaiming $2.30–$2.40 would be the first sign of renewed short-term strength.
#Dotusdt
#Market_Update
#altcoins