

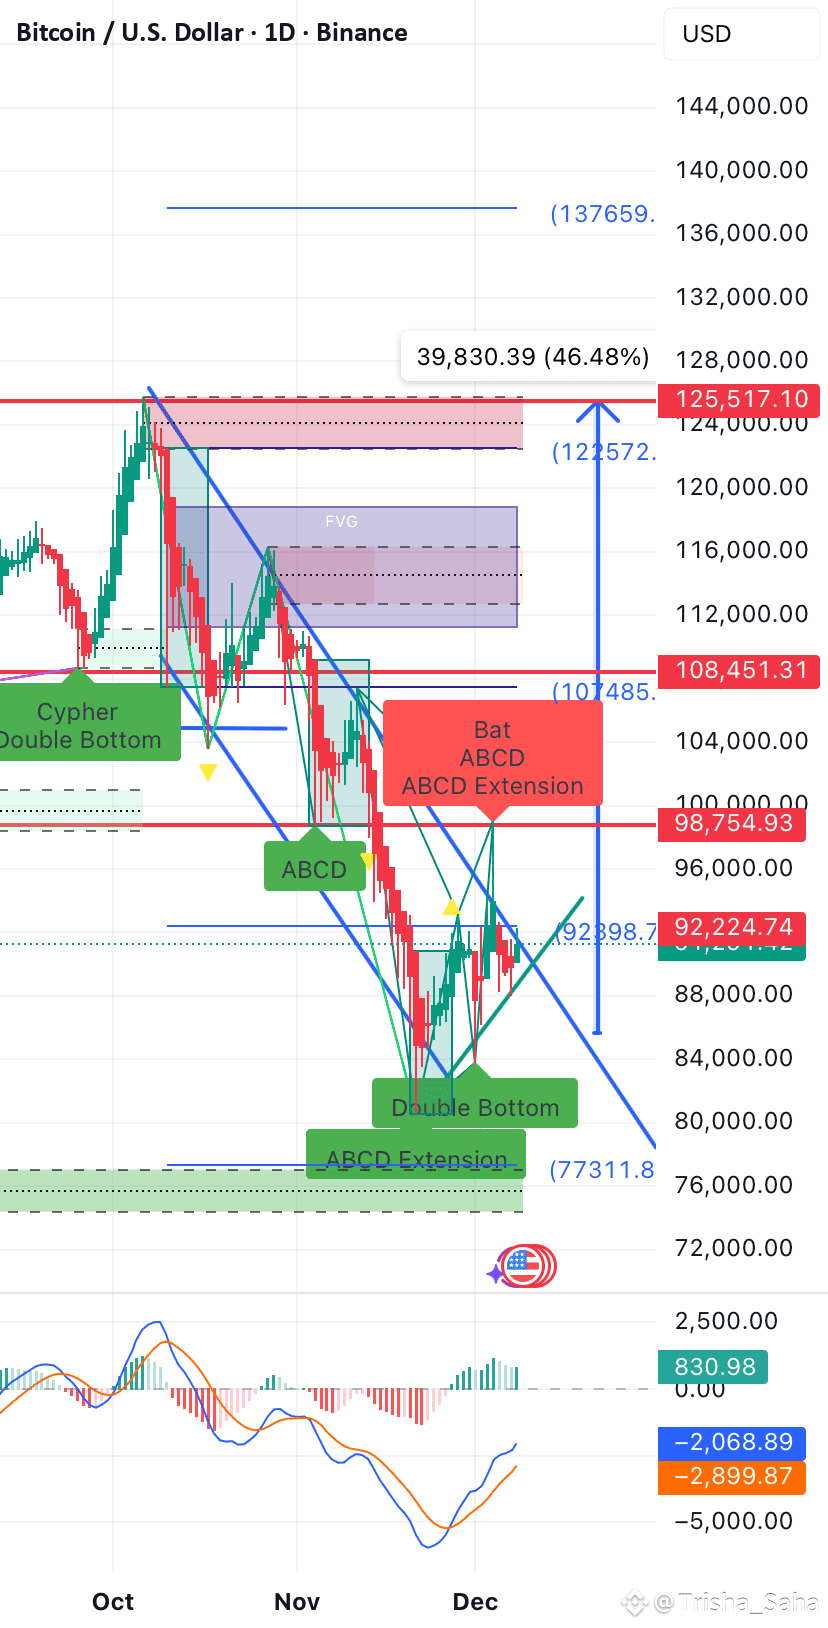
BTC Chart Analysis (1D – Heikin Ashi)
Based on market structure, Harmonic patterns, FVG, trendlines, and indicators:
Market Structure Overview
✅ 1. Clear Double Bottom around ~77,000–78,000
• The two-round bottom indicates a major reversal level.
• Price bounced from the ABCD Extension zone (green demand zone) → a confirmed Reversal Zone.
✅ 2. Price has broken above the downward trendline (blue)
• This signals an early trend reversal.
• If the daily candle can close above 92,300–92,500, the probability of a larger bullish move increases significantly.
🟦 Harmonic Pattern
📌 Bat Pattern + ABCD + ABCD Extension (98,700–108,400 zone)
• The red rectangle area = Strong Resistance Zone / Bearish PRZ.
• Price may face a pullback here before continuing upward.
But if this zone is broken → higher levels become likely.
🟪 Fair Value Gap (FVG)
There is a major FVG between 110,000–123,000.
→ Markets tend to fill FVGs, meaning price has a “logical reason” to rise and fill that gap.
🎯 Key Resistance Levels
Based on your chart:
1. 91,200 → currently being tested
2. 98,700
3. 108,400
4. 125,500 (the major target for this cycle)
🟩 Key Support Levels
1. 91,200 (previous support/resistance level)
2. 88,500–89,000
3. 77,300 (Double bottom / major demand zone)
If price breaks below 77K, the structure turns bearish.
📈 MACD Indicator
• Blue line crossing above orange → Bullish Cross
• Histogram turning green consistently → Momentum is strengthening on the upside
These signals align with a reversal from the Double Bottom.
Trend Direction Summary
🟢 Bias: Bullish (Reversal Trend)
The chart signals supporting an upward direction include:
• Double Bottom + Trendline Breakout
• MACD Bullish Cross
• Price holding above the ABCD Extension Reversal Zone
• Clear major upside targets aligned with the upper FVG
🎯 Targets Based on Harmonic Structure + FVG
• Level 1: 98,700
• Level 2: 108,400
• Level 3 (Major): 122,000–125,500
