🤔 What's Next?
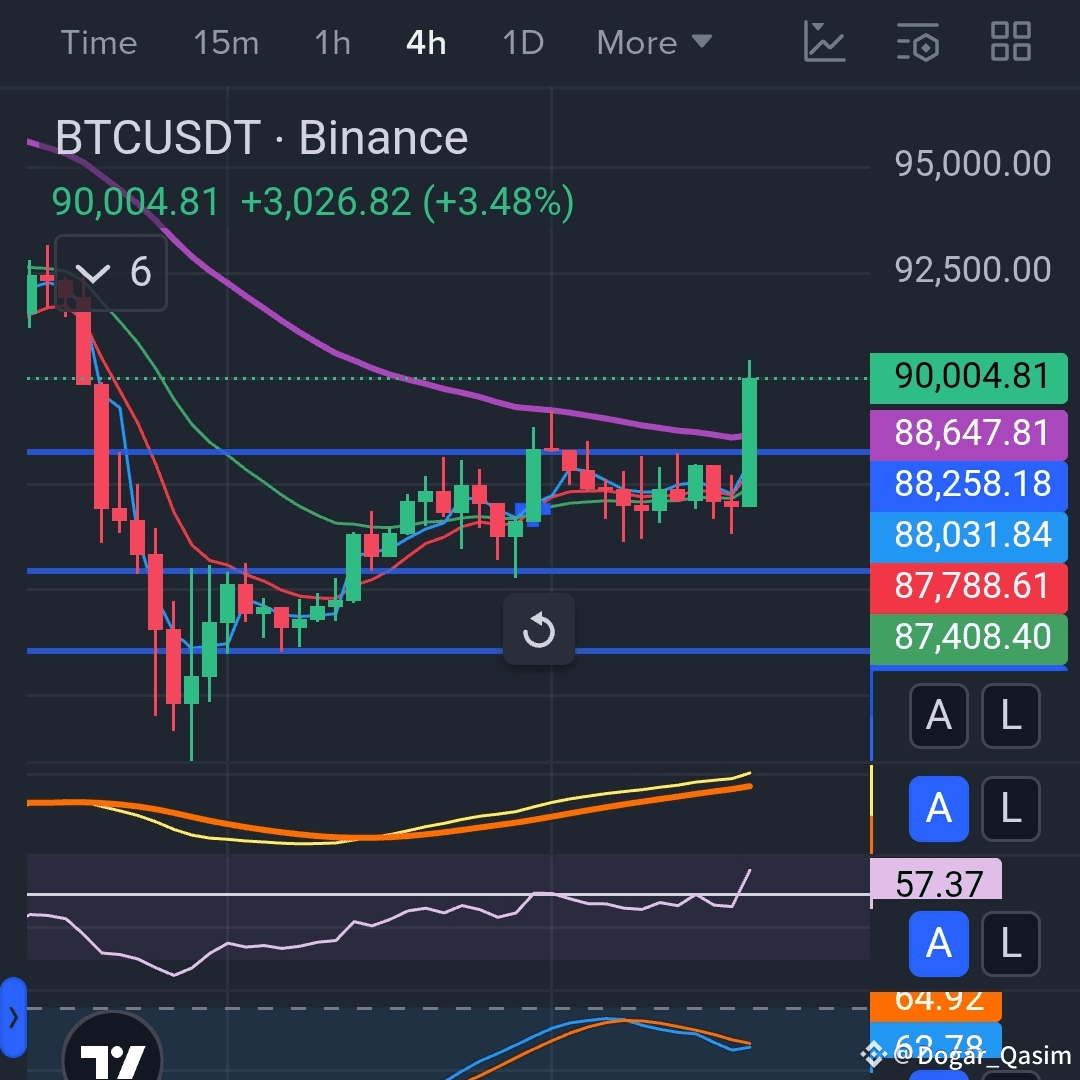
The immediate technical outlook is bullish given the break above $90,000. However, traders will be watching closely to see if the price can hold $90,000 as a new support or if it will face rejection and retreat back to the $87,000-$88,000 zone.
📈 $BTC
BTC/USDT Chart Analysis
The image shows a BTC/USDT trading pair chart on a 4-hour (4h) timeframe, with the price at $90,004.81.
Current Price: $90,004.81
24h Change: +3.69%
24h High: $90,418.39
24h Low: $86,306.77
Key Observations from the Chart:
Strong Recent Movement: The current candle is green and near the top of the chart, indicating a strong positive move in the last 4 hours, pushing the price to just over $90,000.
Resistance/Key Levels: There are horizontal lines indicating potential resistance or support levels near: $88700
The price has recently broken above these clustered resistance/support levels.
📰 Current Market Context
The price of BTC has recently seen a strong bounce back, hitting levels close to $90,000 as shown in your chart.
General Trend: Recent market activity has involved some volatility, with Bitcoin seeing a sharp sell-off that pushed it to multi-month lows, followed by a noticeable rebound.
Key Barrier: The $90,000 level has been identified by analysts as a key psychological and technical barrier. Breaking and holding above this level is crucial for continued short-term bullish momentum.
Liquidity/Short Squeeze: Market analysis suggests a concentration of short-squeeze liquidity (where price moves up sharply, forcing traders who bet on a fall to buy back their positions) in the $89,500 - $90,000 range, which likely contributed to the surge you're seeing.
$ETH
#BTCRebound90kNext?
The immediate technical outlook is bullish given the break above $90,000. However, traders will be watching closely to see if the price can hold $90,000 as a new support or if it will face rejection and retreat back to the $87,000-$88,000 zone.
📈 $BTC
BTC/USDT Chart Analysis
The image shows a BTC/USDT trading pair chart on a 4-hour (4h) timeframe, with the price at $90,004.81.
Current Price: $90,004.81
24h Change: +3.69%
24h High: $90,418.39
24h Low: $86,306.77
Key Observations from the Chart:
Strong Recent Movement: The current candle is green and near the top of the chart, indicating a strong positive move in the last 4 hours, pushing the price to just over $90,000.
Resistance/Key Levels: There are horizontal lines indicating potential resistance or support levels near: $88700
The price has recently broken above these clustered resistance/support levels.
📰 Current Market Context
The price of BTC has recently seen a strong bounce back, hitting levels close to $90,000 as shown in your chart.
General Trend: Recent market activity has involved some volatility, with Bitcoin seeing a sharp sell-off that pushed it to multi-month lows, followed by a noticeable rebound.
Key Barrier: The $90,000 level has been identified by analysts as a key psychological and technical barrier. Breaking and holding above this level is crucial for continued short-term bullish momentum.
Liquidity/Short Squeeze: Market analysis suggests a concentration of short-squeeze liquidity (where price moves up sharply, forcing traders who bet on a fall to buy back their positions) in the $89,500 - $90,000 range, which likely contributed to the surge you're seeing.
$ETH
#BTCRebound90kNext?