Summary of the Market $EDEN :
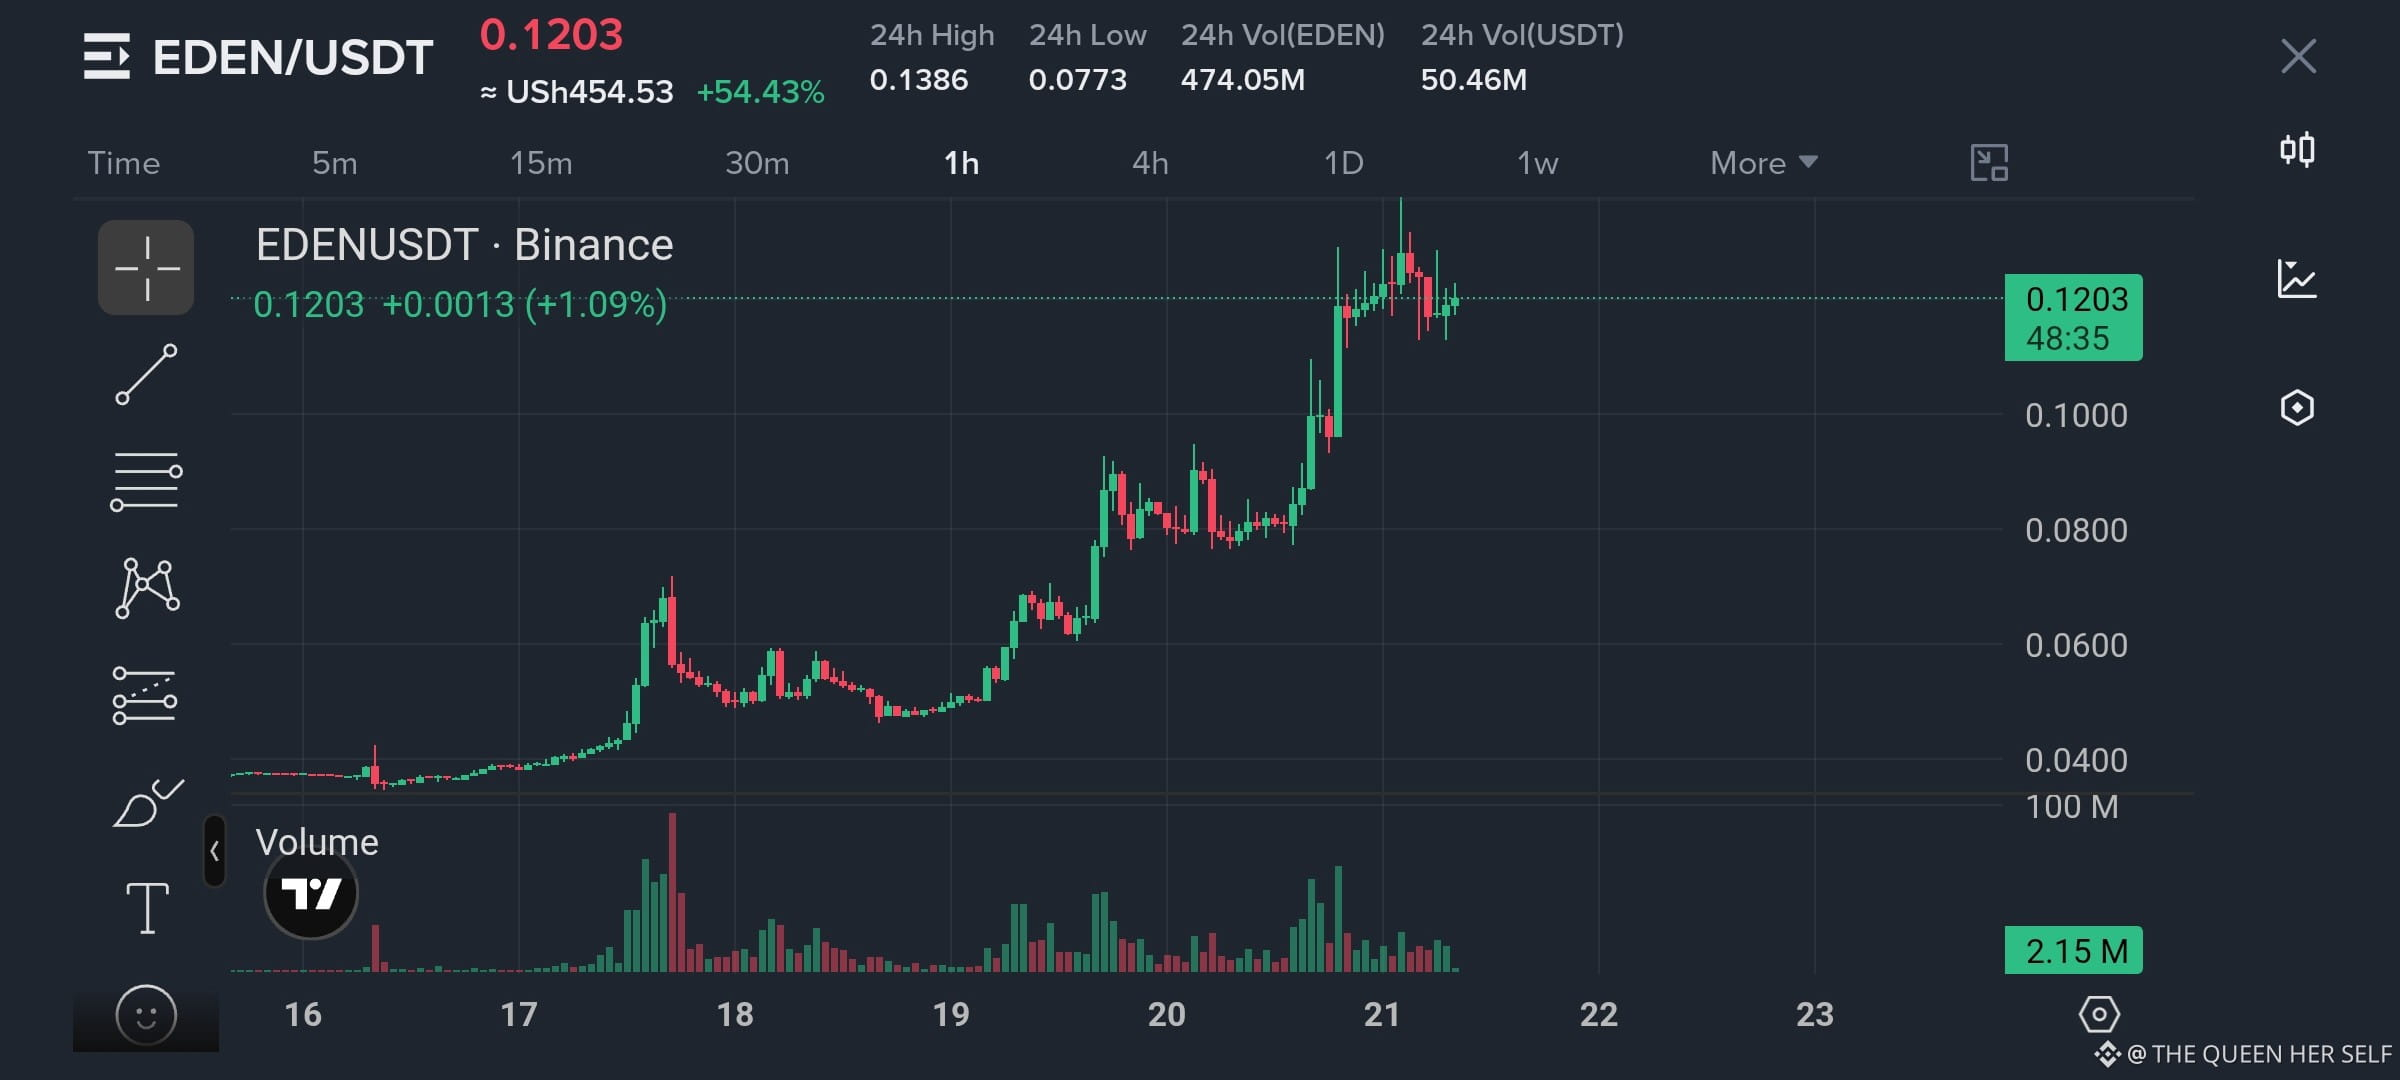
Trading Pair: EDEN/USDT (OpenEden token traded against Tether stablecoin).
Current Price: 0.1202 USDT, showing an impressive +53.12% increase over the last 24 hours.
Local Currency Conversion: Shillings equivalent is listed as USh454.1.
24h High / Low: The price peaked at 0.1386 USDT and hit a low of 0.0771 USDT during this specific daily window.
Trading Volumes: The 24-hour volume for EDEN is 473.72M tokens, while the volume for USDT sits at 50.38M, indicating very high market liquidity and trading velocity.
Historical Trends: Performance metrics at the bottom reveal a explosive +207.16% increase over the past 7 days and +253.24% over the last 30 days.
Order Book Sentiment: The buying pressure is stronger than selling pressure, sitting at 60.82% Buy versus 39.18% Sell. [1, 2, 3]
Key Technical Patterns Visible in the Selection
Uptrend Continuation: The chart displays consecutive higher lows and higher highs starting from the 19th and accelerating through the 20th.
Volume Confirmation: The bottom of the chart shows green vertical volume bars spiking in correlation with the massive price increase on the 21st, proving the move is backed by real buyer interest rather than thin liquidity.
Recent Consolidation: The far-right candlesticks showcase shorter bodies hovering around the 0.1202 range, hinting at a momentary pause or consolidation as traders build a new base before the next potential move.
Trading Pair: EDEN/USDT (OpenEden token traded against Tether stablecoin).
Current Price: 0.1202 USDT, showing an impressive +53.12% increase over the last 24 hours.
Local Currency Conversion: Shillings equivalent is listed as USh454.1.
24h High / Low: The price peaked at 0.1386 USDT and hit a low of 0.0771 USDT during this specific daily window.
Trading Volumes: The 24-hour volume for EDEN is 473.72M tokens, while the volume for USDT sits at 50.38M, indicating very high market liquidity and trading velocity.
Historical Trends: Performance metrics at the bottom reveal a explosive +207.16% increase over the past 7 days and +253.24% over the last 30 days.
Order Book Sentiment: The buying pressure is stronger than selling pressure, sitting at 60.82% Buy versus 39.18% Sell. [1, 2, 3]
Key Technical Patterns Visible in the Selection
Uptrend Continuation: The chart displays consecutive higher lows and higher highs starting from the 19th and accelerating through the 20th.
Volume Confirmation: The bottom of the chart shows green vertical volume bars spiking in correlation with the massive price increase on the 21st, proving the move is backed by real buyer interest rather than thin liquidity.
Recent Consolidation: The far-right candlesticks showcase shorter bodies hovering around the 0.1202 range, hinting at a momentary pause or consolidation as traders build a new base before the next potential move.