Trading Indicators: Exponential Moving Average (EMA)
Exponential Moving Average (EMA) is a popular trading indicator that helps traders to identify trends, determine entry and exit points, and manage risk. It is a type of moving average that places greater weight on recent price data, making it more responsive to price changes compared to simple moving average (SMA).
EMA calculation
The EMA calculation formula uses a weighting factor that exponentially decreases as the time period increases. The weighting factor for the most recent period is calculated using the formula: EMA(today) = Price(today) x (Smoothing Factor) + EMA(yesterday) x (1 - Smoothing Factor)
Where the smoothing factor = 2 / (1 + n), where n is the number of periods for the EMA.
For example, if you want to calculate the 20-day EMA, you would use a smoothing factor of 2 / (1 + 20) = 0.0952.
EMA Trading strategy
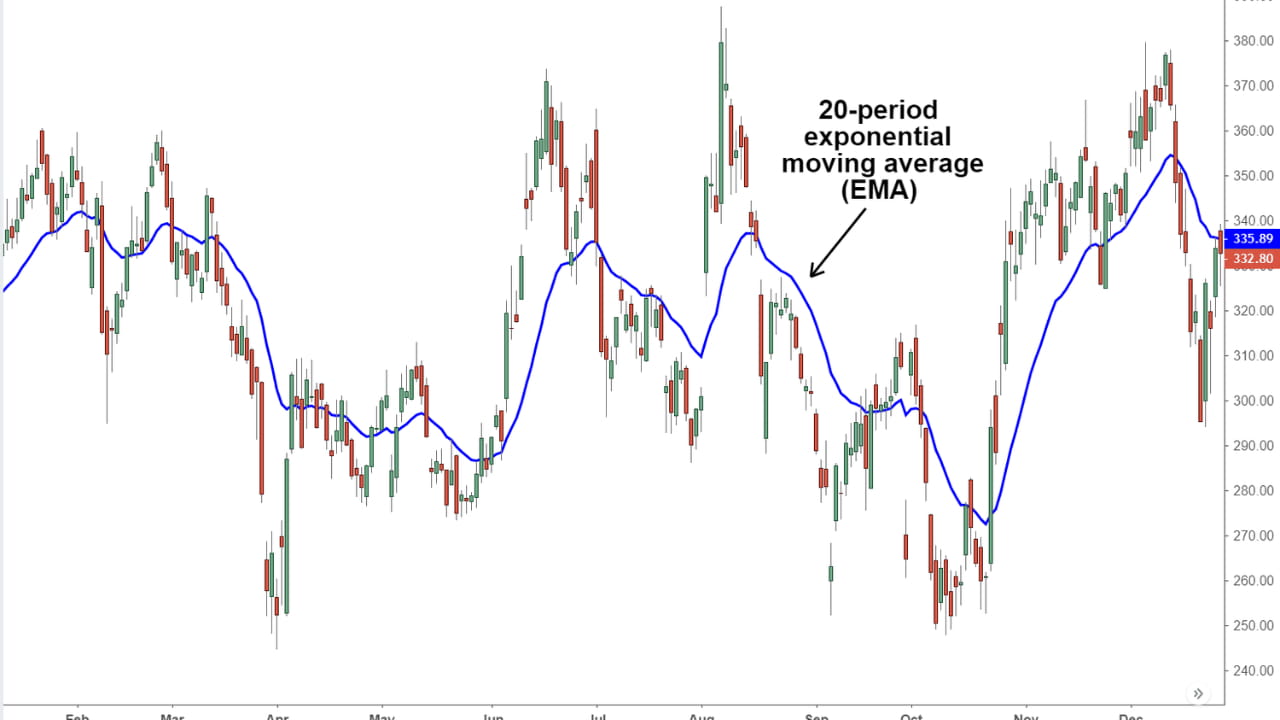
EMA can be used to identify trend direction and potential entry and exit points. When the price is above the EMA, it is considered a bullish trend, and when the price is below the EMA, it is considered a bearish trend.
Traders can use multiple EMA lines with different time periods to identify short-term and long-term trends. For example, a trader may use a 10-day EMA and a 50-day EMA to identify short-term and long-term trends, respectively. When the short-term EMA crosses above the long-term EMA, it is considered a buy signal, and when the short-term EMA crosses below the long-term EMA, it is considered a sell signal.
Another trading strategy using EMA is the EMA crossovers. In this strategy, traders use two EMA lines with different periods, such as a 12-day EMA and a 26-day EMA. When the shorter-term EMA crosses above the longer-term EMA, it is considered a bullish signal, and when the shorter-term EMA crosses below the longer-term EMA, it is considered a bearish signal.
Managing Risk with EMA
EMA can also be used to manage risk by setting stop-loss orders. Traders can use the EMA line as a reference point for setting stop-loss orders. For example, a trader may set a stop-loss order below the EMA line when going long or above the EMA line when going short.
Conclusion
EMA is a powerful trading indicator that can help traders identify trend direction, potential entry and exit points, and manage risk. It is important to remember that no trading indicator is perfect, and traders should always use multiple indicators and risk management strategies to develop a profitable trading strategy.