

612 Ceros
25.1k Publications

612 Ceros
 Compte Square Vérifié+
Signaler
Bloquer l’utilisateur
📊 Crypto strategist | Market signals daily | Trade smart, not emotional. Find me on X: @612Ceros
Trade fréquemment
5 an(s)
12 Suivis
177.8K+ Abonnés
226.3K+ J’aime
Publications
Tous
Citations
PINNED
·
--
Haussier
🚀 Master the Market. Elevate Your Edge with 612 Ceros Futures Prime.
The crypto market does not forgive mistakes. Navigating the immense volatility of Binance Futures requires more than just luck or intuition—it demands a proven system, strict discipline, and a deep understanding of market mechanics.
If you are tired of trading in the dark and ready to take your strategy to the next level, welcome to 612 Ceros Futures Prime.
We built this community for one specific purpose: to help serious traders sharpen their edge. We don't rely on hype, noise, or gambling. Instead, we focus on actionable data, objective market analysis, and executing high-probability setups.
What you gain inside Prime:
📊 Deep Market Analysis: Real-time breakdowns of price action, volume shifts, and key structural levels on Binance Futures.
🛡️ Risk & Leverage Control: Professional strategies to protect your portfolio from unexpected liquidations and optimize your leverage. 🧠 A High-Level Trading Environment: Discuss real setups, review trade executions, and grow alongside a network of driven, like-minded individuals.
Success in futures trading comes down to who you trade with and the information you process. Whether you are looking to refine your current strategies or want to be part of a sharp, highly focused community, you belong here.
👉 Step into 612 Ceros Futures Prime today:
[https://app.binance.com/uni-qr/9prSvcJT](https://app.binance.com/uni-qr/9prSvcJT)
👇 Drop a comment or send a DM if you have any questions about joining!
🚀 Master the Market. Elevate Your Edge with 612 Ceros Futures Prime.
The crypto market does not forgive mistakes. Navigating the immense volatility of Binance Futures requires more than just luck or intuition—it demands a proven system, strict discipline, and a deep understanding of market mechanics.
If you are tired of trading in the dark and ready to take your strategy to the next level, welcome to 612 Ceros Futures Prime.
We built this community for one specific purpose: to help serious traders sharpen their edge. We don't rely on hype, noise, or gambling. Instead, we focus on actionable data, objective market analysis, and executing high-probability setups.
What you gain inside Prime:
📊 Deep Market Analysis: Real-time breakdowns of price action, volume shifts, and key structural levels on Binance Futures.
🛡️ Risk & Leverage Control: Professional strategies to protect your portfolio from unexpected liquidations and optimize your leverage. 🧠 A High-Level Trading Environment: Discuss real setups, review trade executions, and grow alongside a network of driven, like-minded individuals.
Success in futures trading comes down to who you trade with and the information you process. Whether you are looking to refine your current strategies or want to be part of a sharp, highly focused community, you belong here.
👉 Step into 612 Ceros Futures Prime today:
https://app.binance.com/uni-qr/9prSvcJT
👇 Drop a comment or send a DM if you have any questions about joining!
The crypto market does not forgive mistakes. Navigating the immense volatility of Binance Futures requires more than just luck or intuition—it demands a proven system, strict discipline, and a deep understanding of market mechanics.
If you are tired of trading in the dark and ready to take your strategy to the next level, welcome to 612 Ceros Futures Prime.
We built this community for one specific purpose: to help serious traders sharpen their edge. We don't rely on hype, noise, or gambling. Instead, we focus on actionable data, objective market analysis, and executing high-probability setups.
What you gain inside Prime:
📊 Deep Market Analysis: Real-time breakdowns of price action, volume shifts, and key structural levels on Binance Futures.
🛡️ Risk & Leverage Control: Professional strategies to protect your portfolio from unexpected liquidations and optimize your leverage. 🧠 A High-Level Trading Environment: Discuss real setups, review trade executions, and grow alongside a network of driven, like-minded individuals.
Success in futures trading comes down to who you trade with and the information you process. Whether you are looking to refine your current strategies or want to be part of a sharp, highly focused community, you belong here.
👉 Step into 612 Ceros Futures Prime today:
https://app.binance.com/uni-qr/9prSvcJT
👇 Drop a comment or send a DM if you have any questions about joining!
10
1
18
2.5k
·
--
Baissier
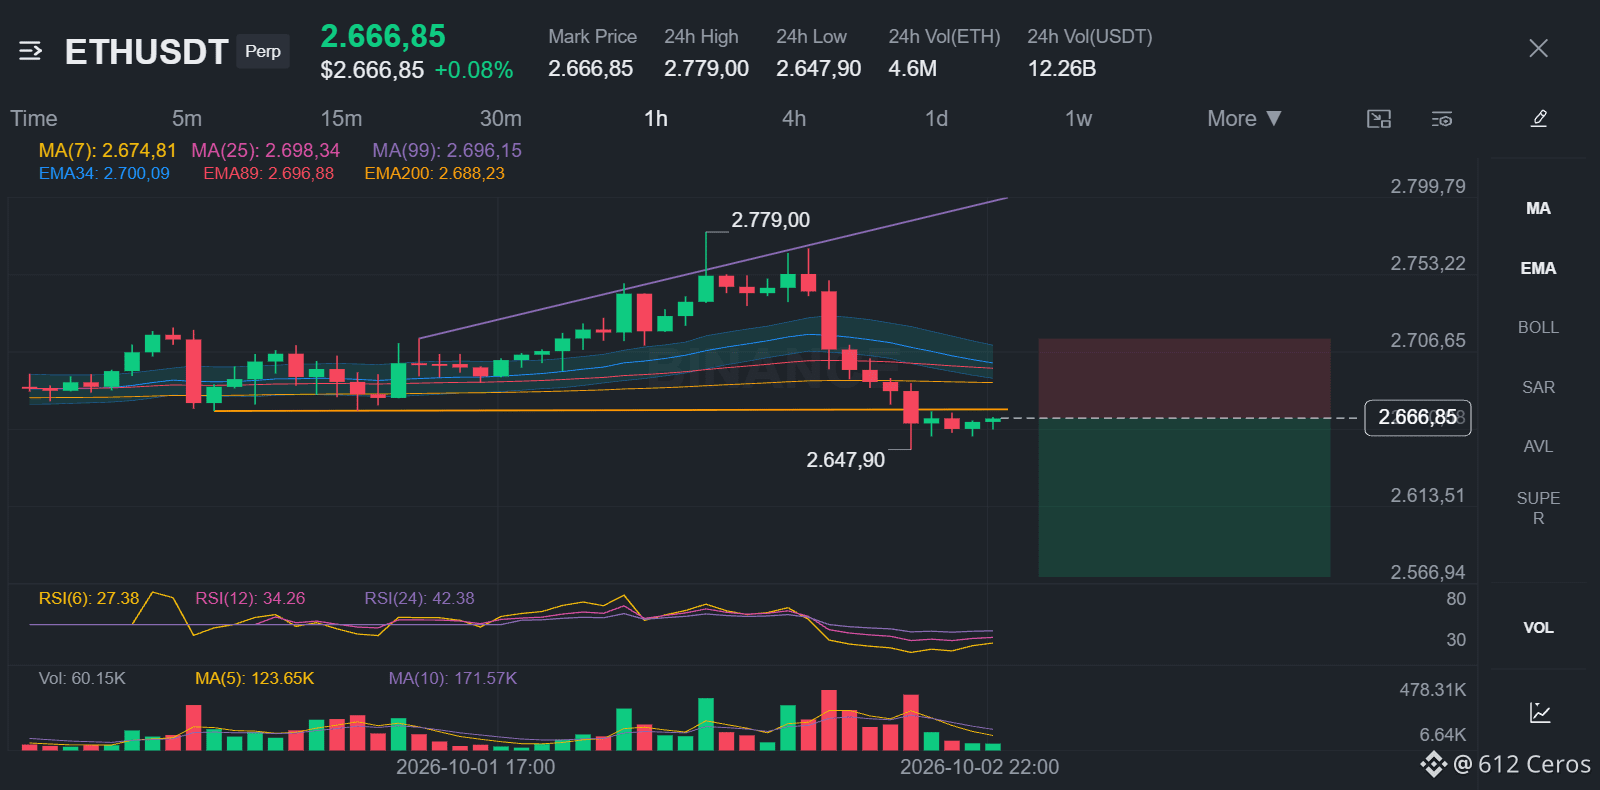
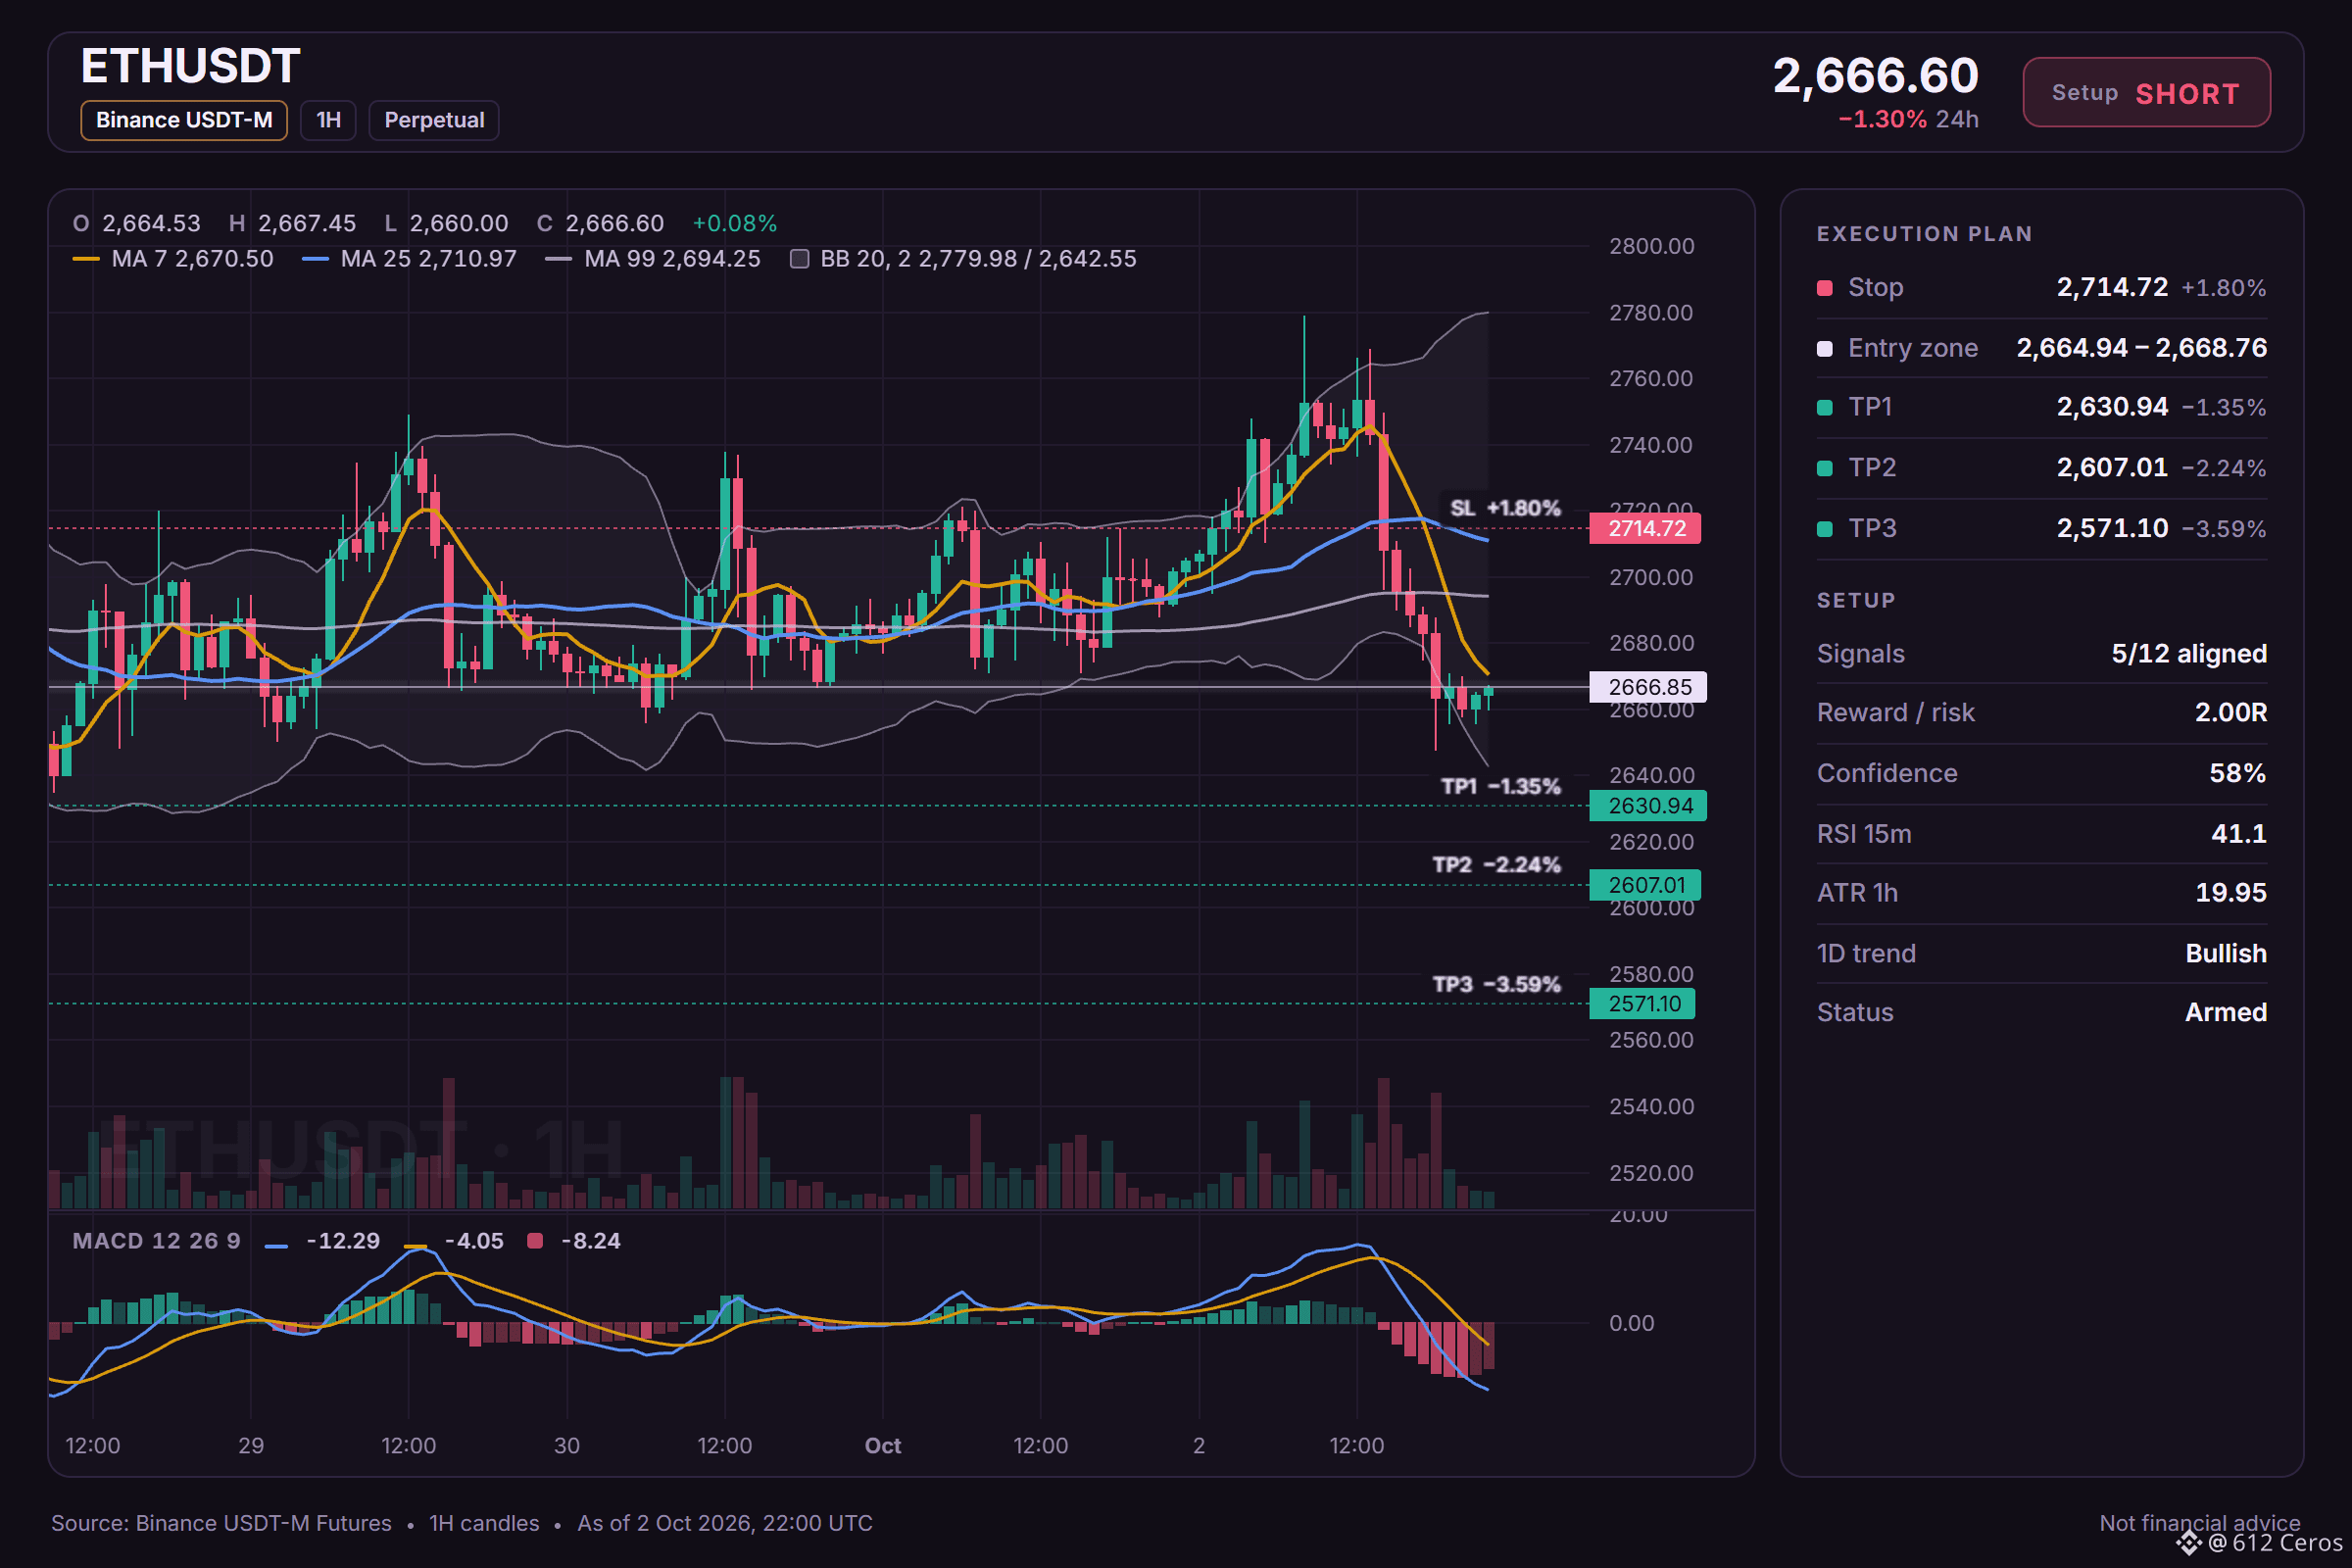
ETH short setup: the levels I'm watching
🔴 SHORT $ETH /USDT: expecting price to go DOWN
Bias: SHORT · Leaning
Entry: 2664.94 – 2668.76
TP1: 2630.94 (-1.3%)
TP2: 2607.01 (-2.2%)
TP3: 2571.10 (-3.6%)
SL: 2714.72 (+1.8%)
Plan: enter only inside the zone, take half at TP1, then move the stop to entry.
Caution: counter-trend idea backed by 5 signals only. Smaller size, hard stop.
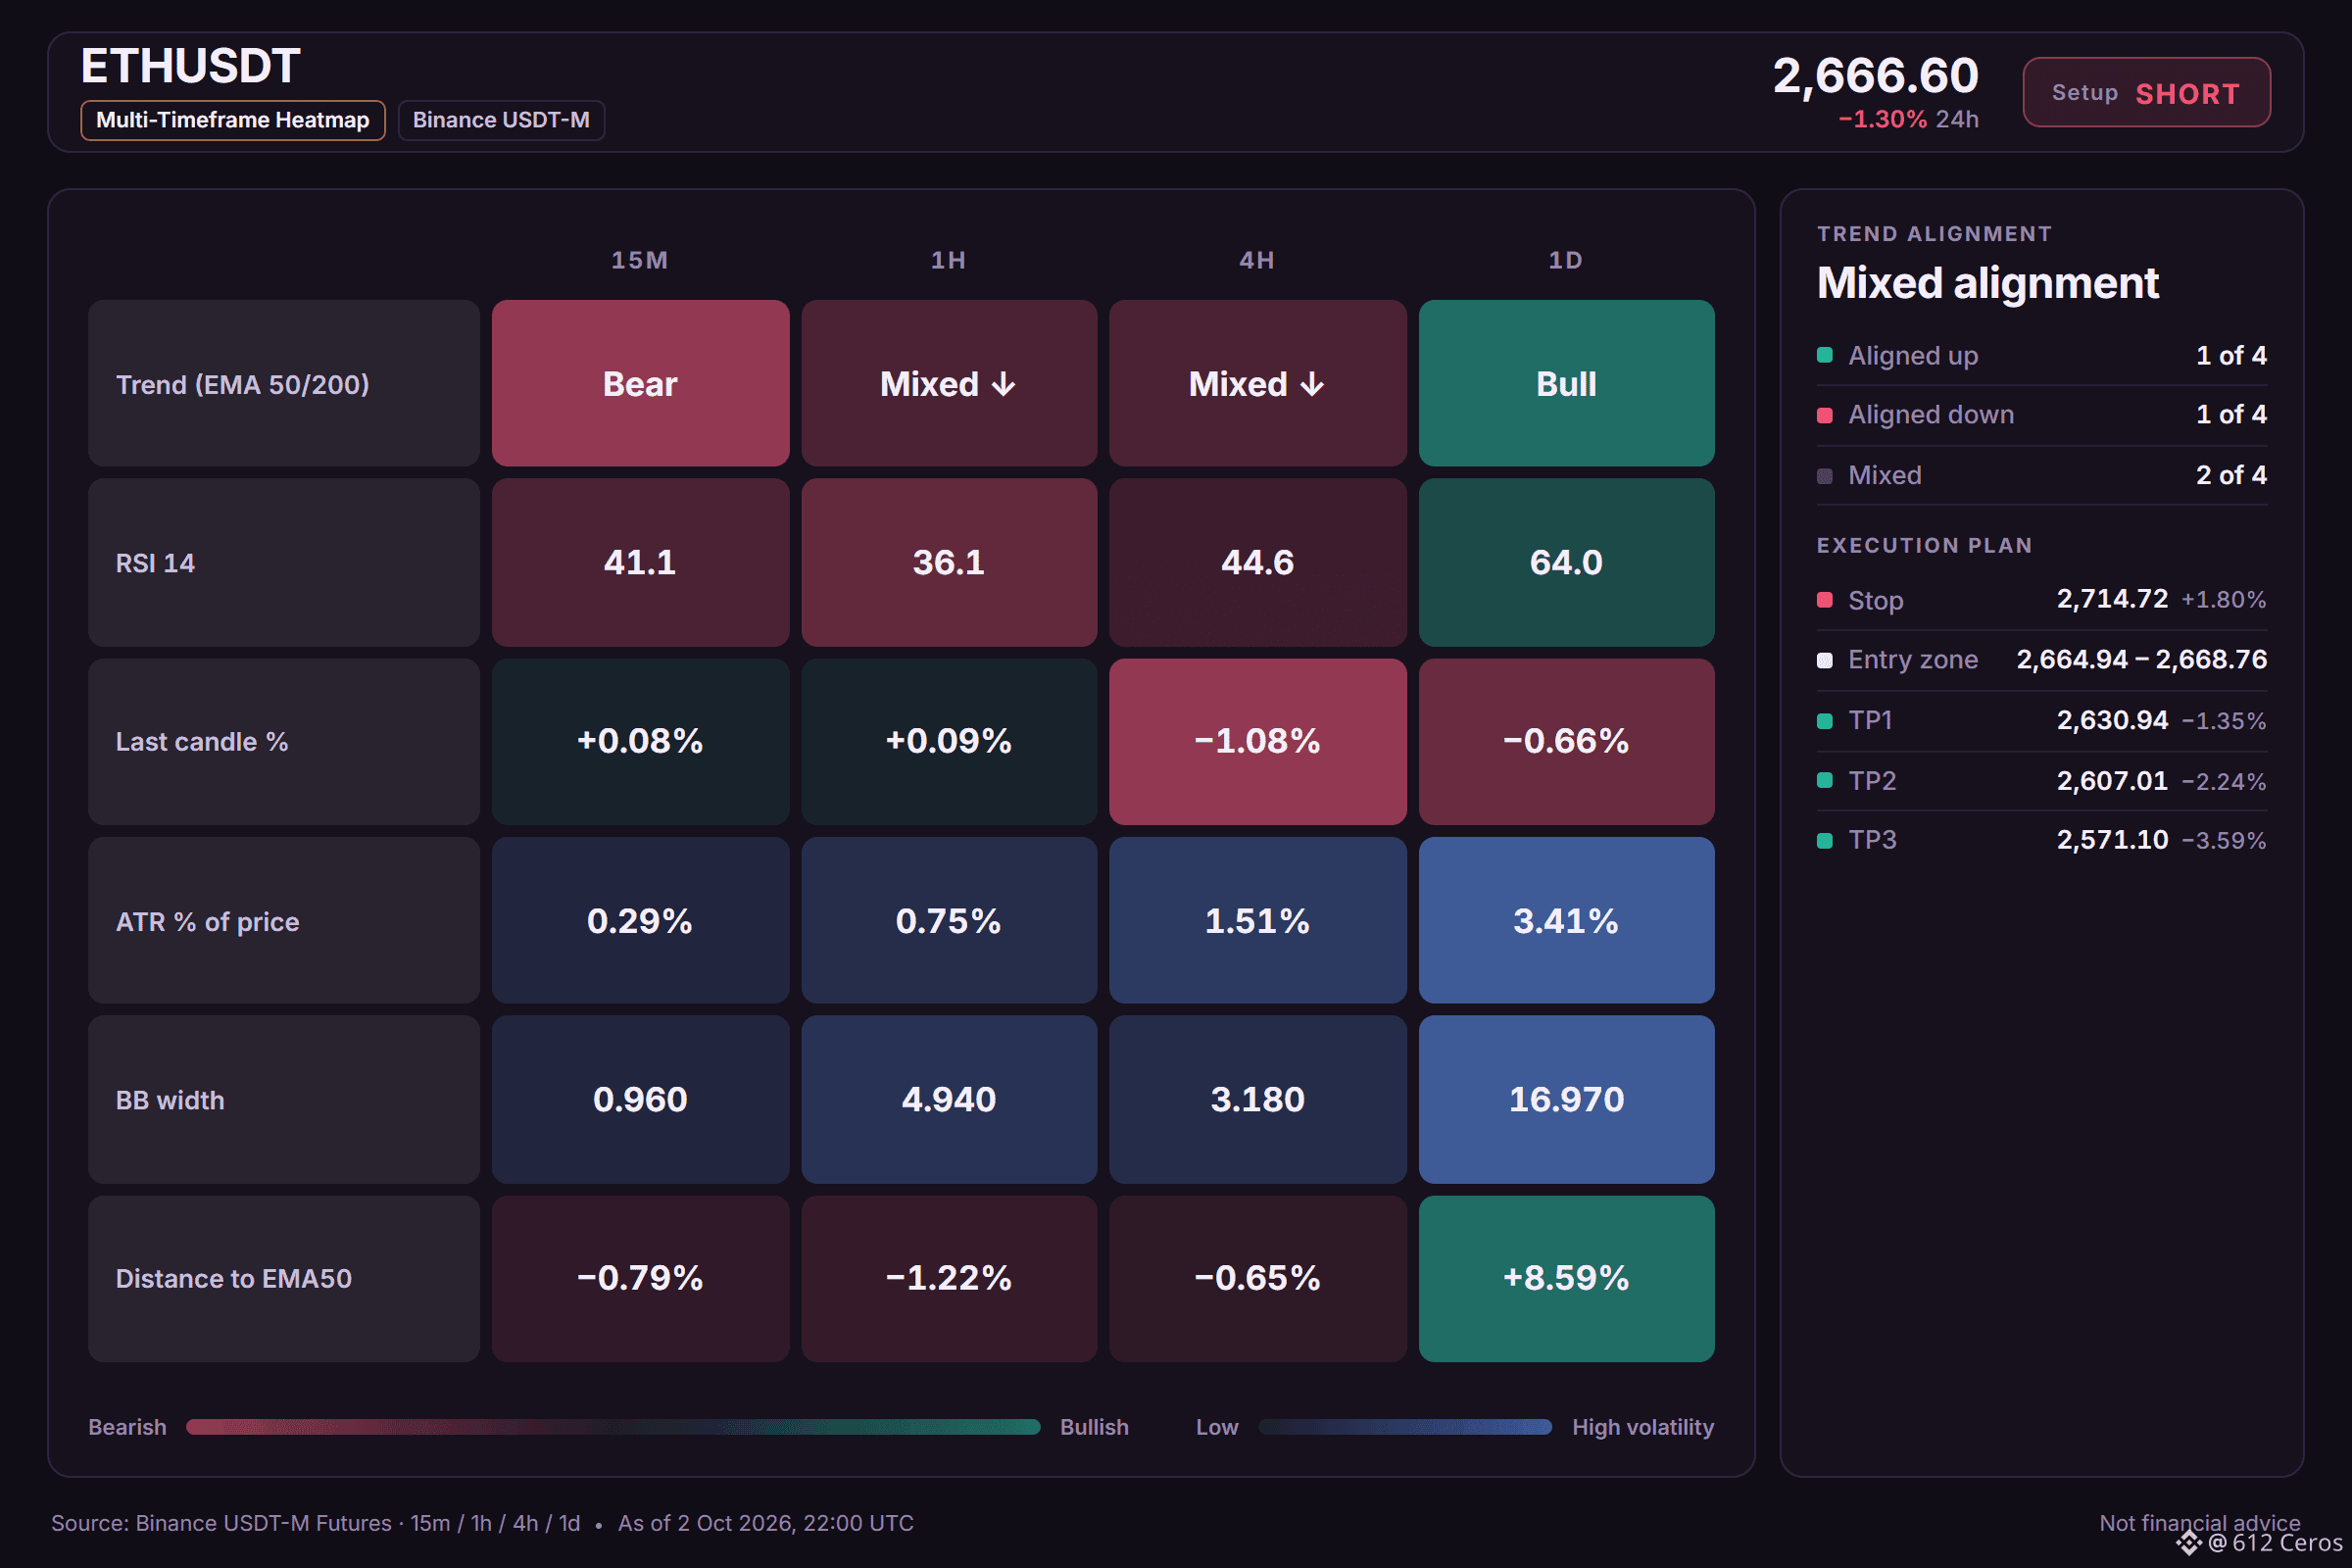
Why SHORT? Leaning call, 5/12 signals agree, 2 against, 5 undecided.
• Trend strength (ADX/DI, 15m): ADX 42.1 with sellers in control (DI+ 12.8 vs DI− 24.9) → sellers are driving the move
• BTC backdrop: BTC trend is bearish and correlation is 0.82 → BTC is falling and this coin tends to follow
• 4h RSI: 44.6, bearish momentum (below 45) → sellers have the momentum
Risk: Daily trend: price > EMA50 > EMA200, bullish stack → the big-picture trend is up
Why I like it:
The daily trend reads bullish, and 5/12 signals aligned favour the short side. The plan is to work the 2664.94 – 2668.76 zone, scale out at 2630.94 and 2607.01, and stay patient for 2571.10. A move through 2714.72 means the idea is wrong and the stop does its job. This is a counter-trend bet against the higher-timeframe trend, so size down.
Does ETH tag 2630.94 first, or the stop?
Levels mapped on the chart below.
{future}(ETHUSDT)
📲 Want more of my latest signals? Join me here:
[https://app.binance.com/uni-qr/D26WbL9t](https://app.binance.com/uni-qr/D26WbL9t)
⚠️ Personal market analysis only. NFA — manage risk and DYOR.
Educational content, not investment advice or a recommendation to buy, sell, deposit, or withdraw any asset. No paid promotion or referral/affiliate links.
ETH short setup: the levels I'm watching
🔴 SHORT $ETH /USDT: expecting price to go DOWN
Bias: SHORT · Leaning
Entry: 2664.94 – 2668.76
TP1: 2630.94 (-1.3%)
TP2: 2607.01 (-2.2%)
TP3: 2571.10 (-3.6%)
SL: 2714.72 (+1.8%)
Plan: enter only inside the zone, take half at TP1, then move the stop to entry.
Caution: counter-trend idea backed by 5 signals only. Smaller size, hard stop.
Why SHORT? Leaning call, 5/12 signals agree, 2 against, 5 undecided.
• Trend strength (ADX/DI, 15m): ADX 42.1 with sellers in control (DI+ 12.8 vs DI− 24.9) → sellers are driving the move
• BTC backdrop: BTC trend is bearish and correlation is 0.82 → BTC is falling and this coin tends to follow
• 4h RSI: 44.6, bearish momentum (below 45) → sellers have the momentum
Risk: Daily trend: price > EMA50 > EMA200, bullish stack → the big-picture trend is up
Why I like it:
The daily trend reads bullish, and 5/12 signals aligned favour the short side. The plan is to work the 2664.94 – 2668.76 zone, scale out at 2630.94 and 2607.01, and stay patient for 2571.10. A move through 2714.72 means the idea is wrong and the stop does its job. This is a counter-trend bet against the higher-timeframe trend, so size down.
Does ETH tag 2630.94 first, or the stop?
Levels mapped on the chart below.
📲 Want more of my latest signals? Join me here:
https://app.binance.com/uni-qr/D26WbL9t
⚠️ Personal market analysis only. NFA — manage risk and DYOR.
Educational content, not investment advice or a recommendation to buy, sell, deposit, or withdraw any asset. No paid promotion or referral/affiliate links.
🔴 SHORT $ETH /USDT: expecting price to go DOWN
Bias: SHORT · Leaning
Entry: 2664.94 – 2668.76
TP1: 2630.94 (-1.3%)
TP2: 2607.01 (-2.2%)
TP3: 2571.10 (-3.6%)
SL: 2714.72 (+1.8%)
Plan: enter only inside the zone, take half at TP1, then move the stop to entry.
Caution: counter-trend idea backed by 5 signals only. Smaller size, hard stop.
Why SHORT? Leaning call, 5/12 signals agree, 2 against, 5 undecided.
• Trend strength (ADX/DI, 15m): ADX 42.1 with sellers in control (DI+ 12.8 vs DI− 24.9) → sellers are driving the move
• BTC backdrop: BTC trend is bearish and correlation is 0.82 → BTC is falling and this coin tends to follow
• 4h RSI: 44.6, bearish momentum (below 45) → sellers have the momentum
Risk: Daily trend: price > EMA50 > EMA200, bullish stack → the big-picture trend is up
Why I like it:
The daily trend reads bullish, and 5/12 signals aligned favour the short side. The plan is to work the 2664.94 – 2668.76 zone, scale out at 2630.94 and 2607.01, and stay patient for 2571.10. A move through 2714.72 means the idea is wrong and the stop does its job. This is a counter-trend bet against the higher-timeframe trend, so size down.
Does ETH tag 2630.94 first, or the stop?
Levels mapped on the chart below.
📲 Want more of my latest signals? Join me here:
https://app.binance.com/uni-qr/D26WbL9t
⚠️ Personal market analysis only. NFA — manage risk and DYOR.
Educational content, not investment advice or a recommendation to buy, sell, deposit, or withdraw any asset. No paid promotion or referral/affiliate links.
185
·
--
Haussier
Most traders will fade this one higher, but the daily trend says otherwise.
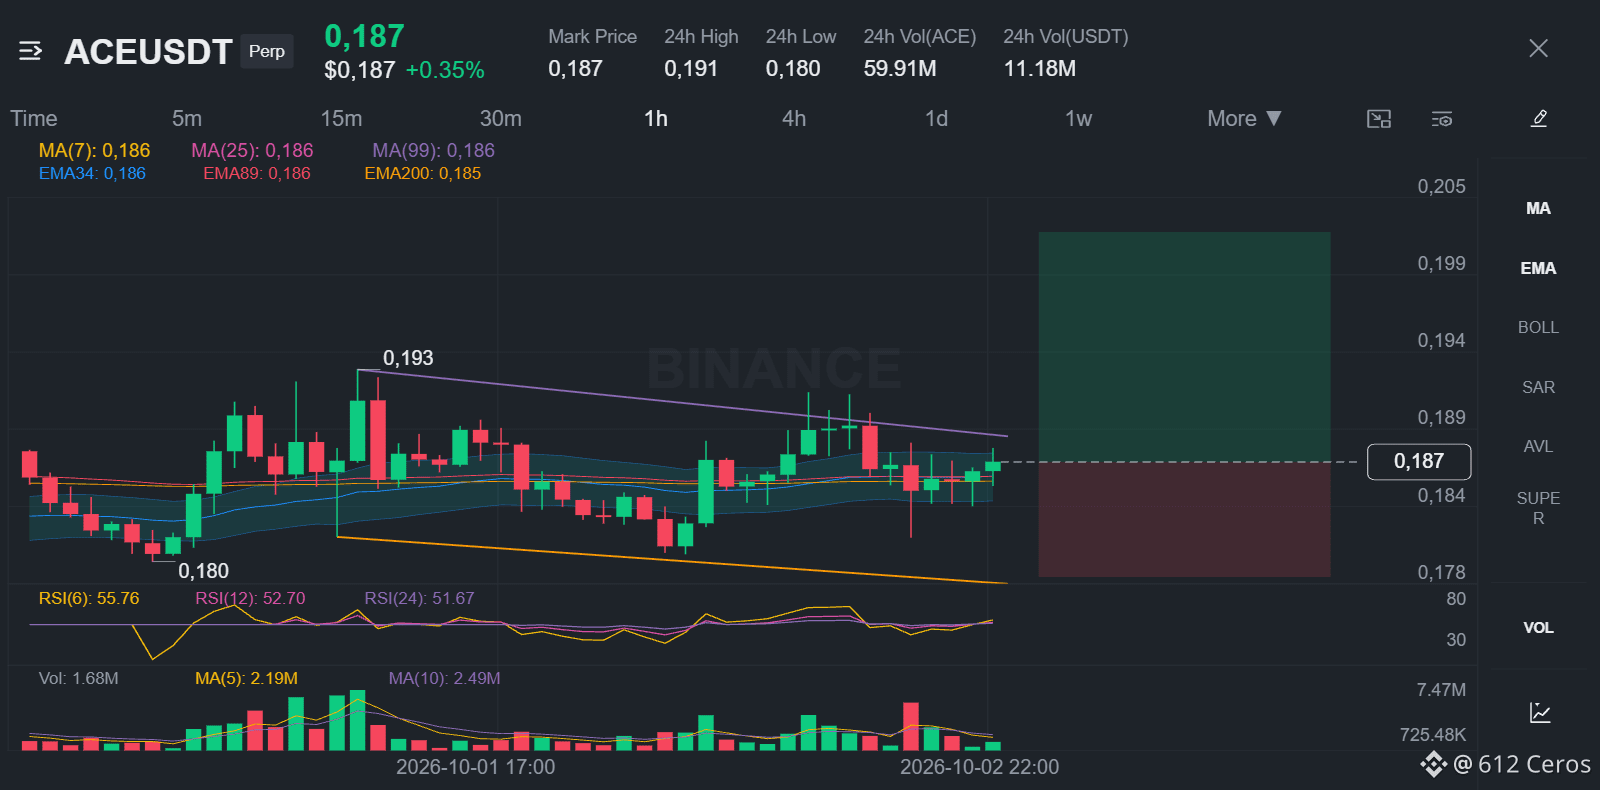
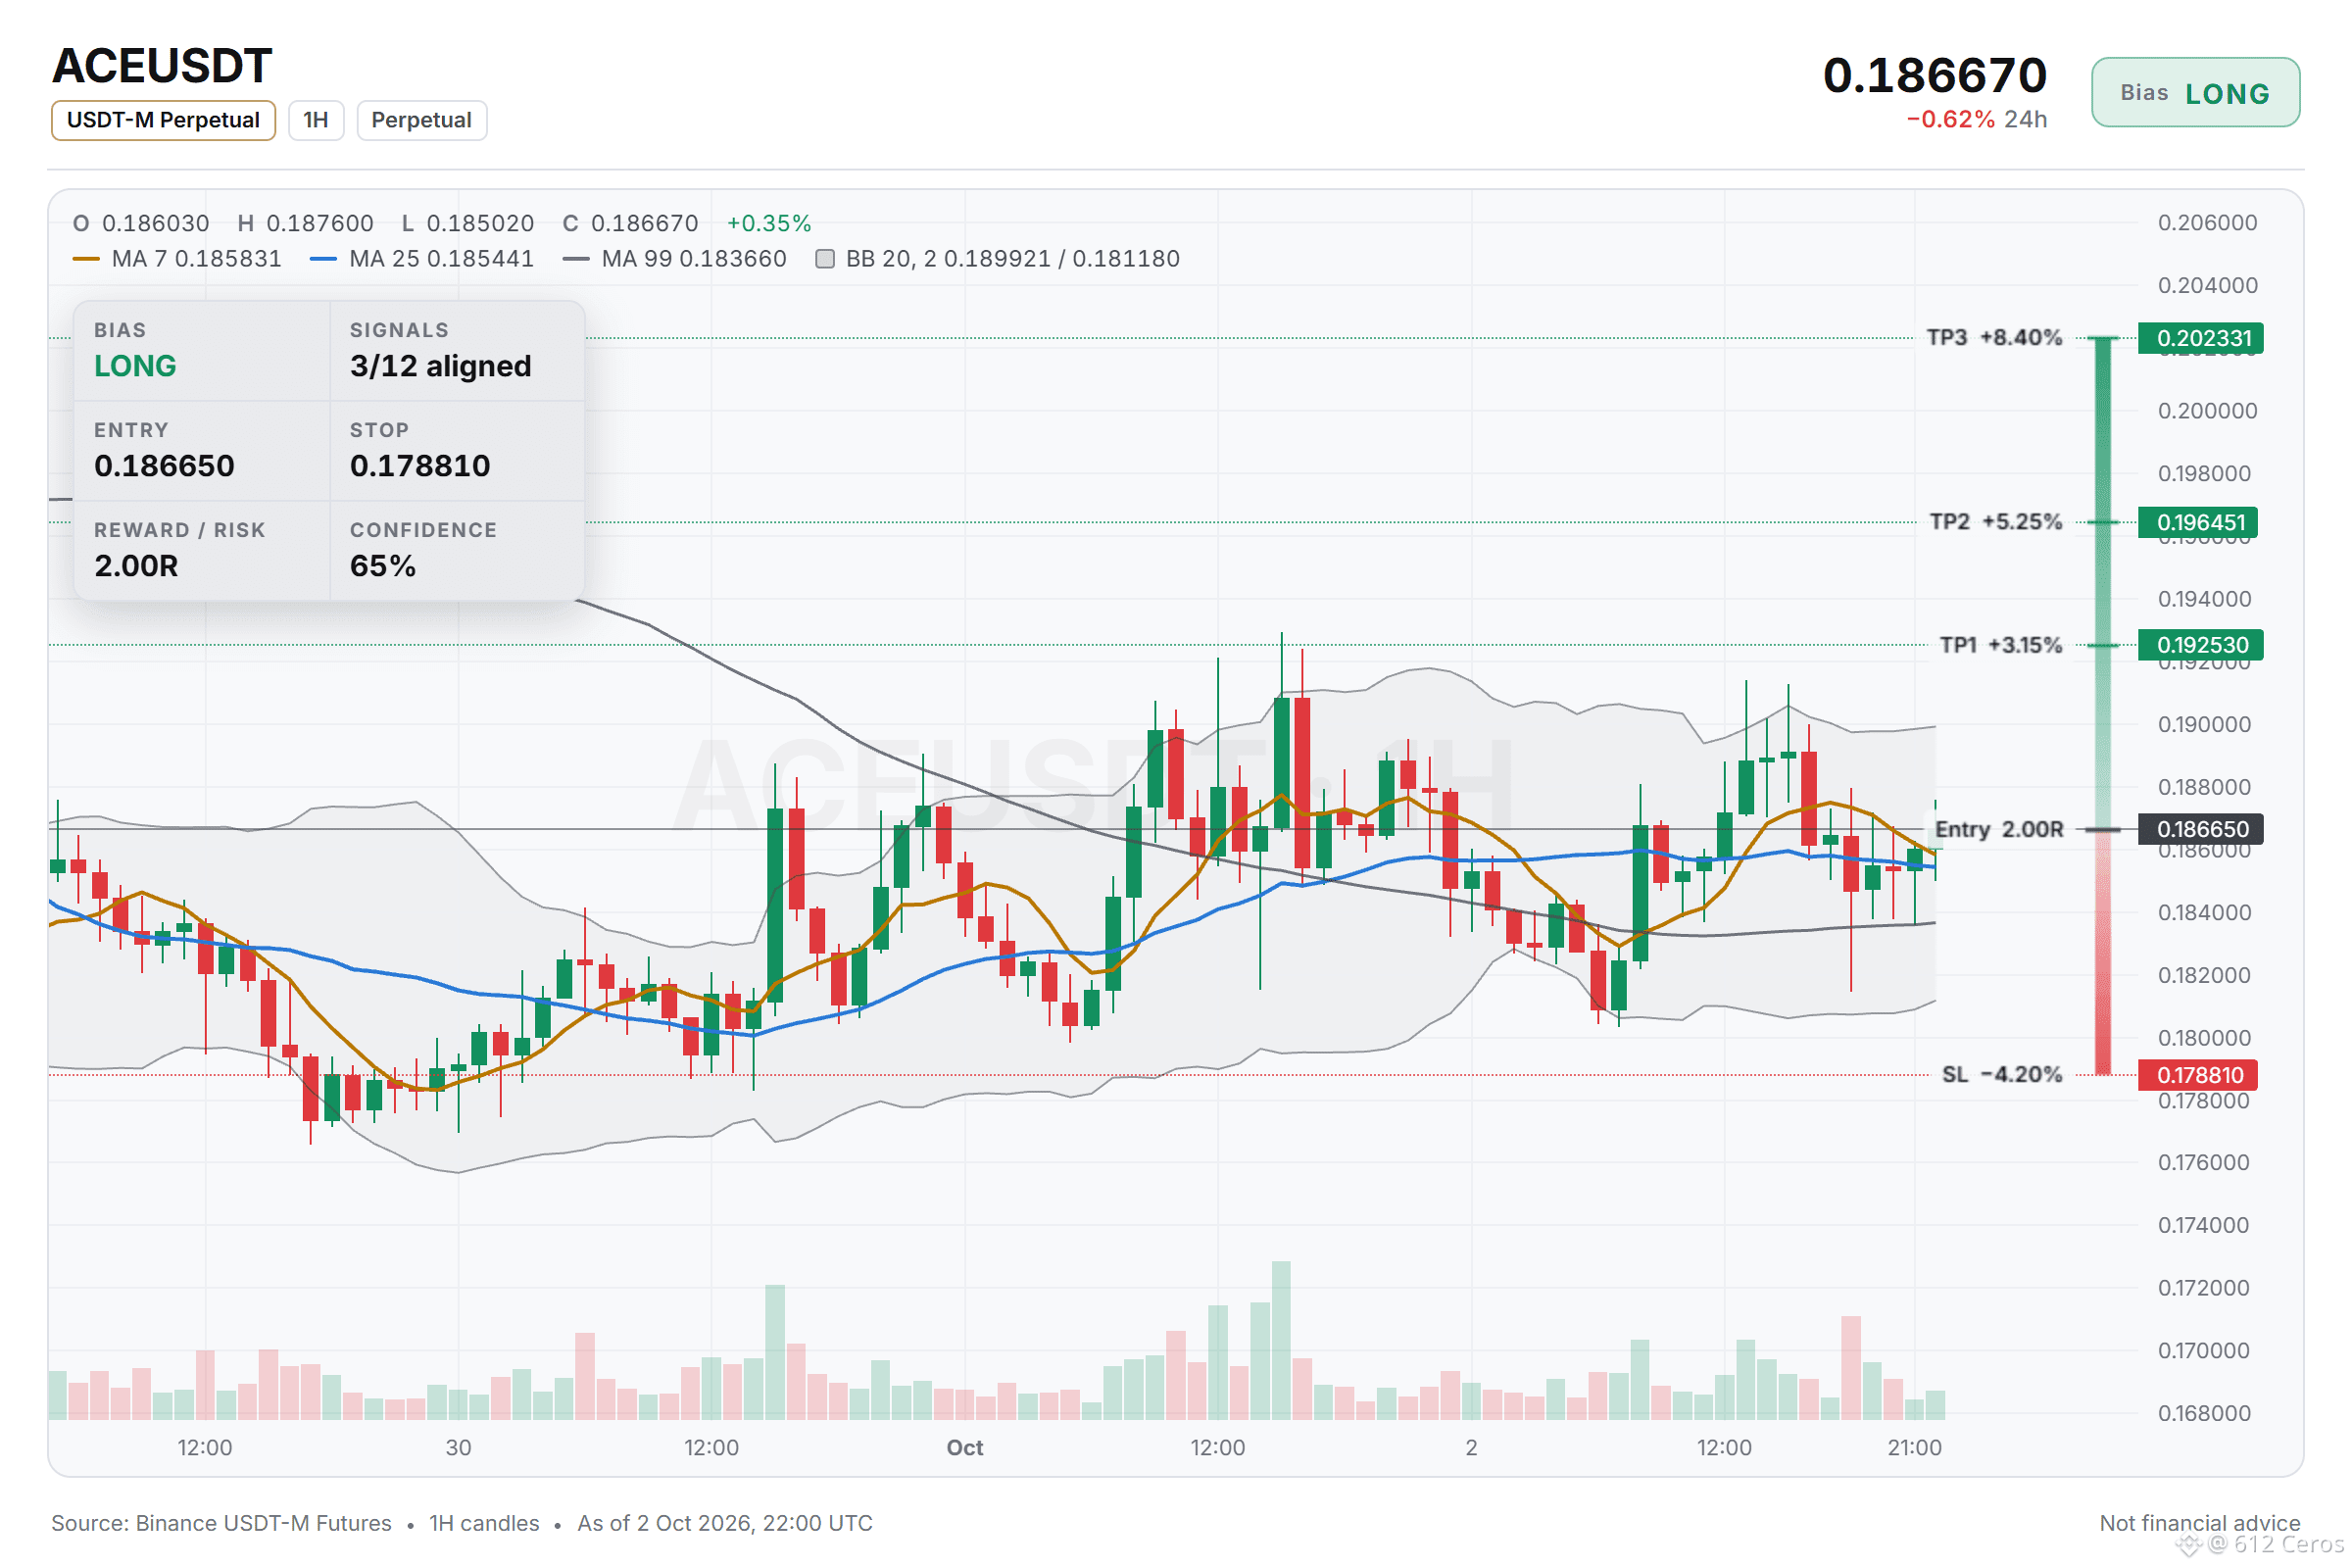
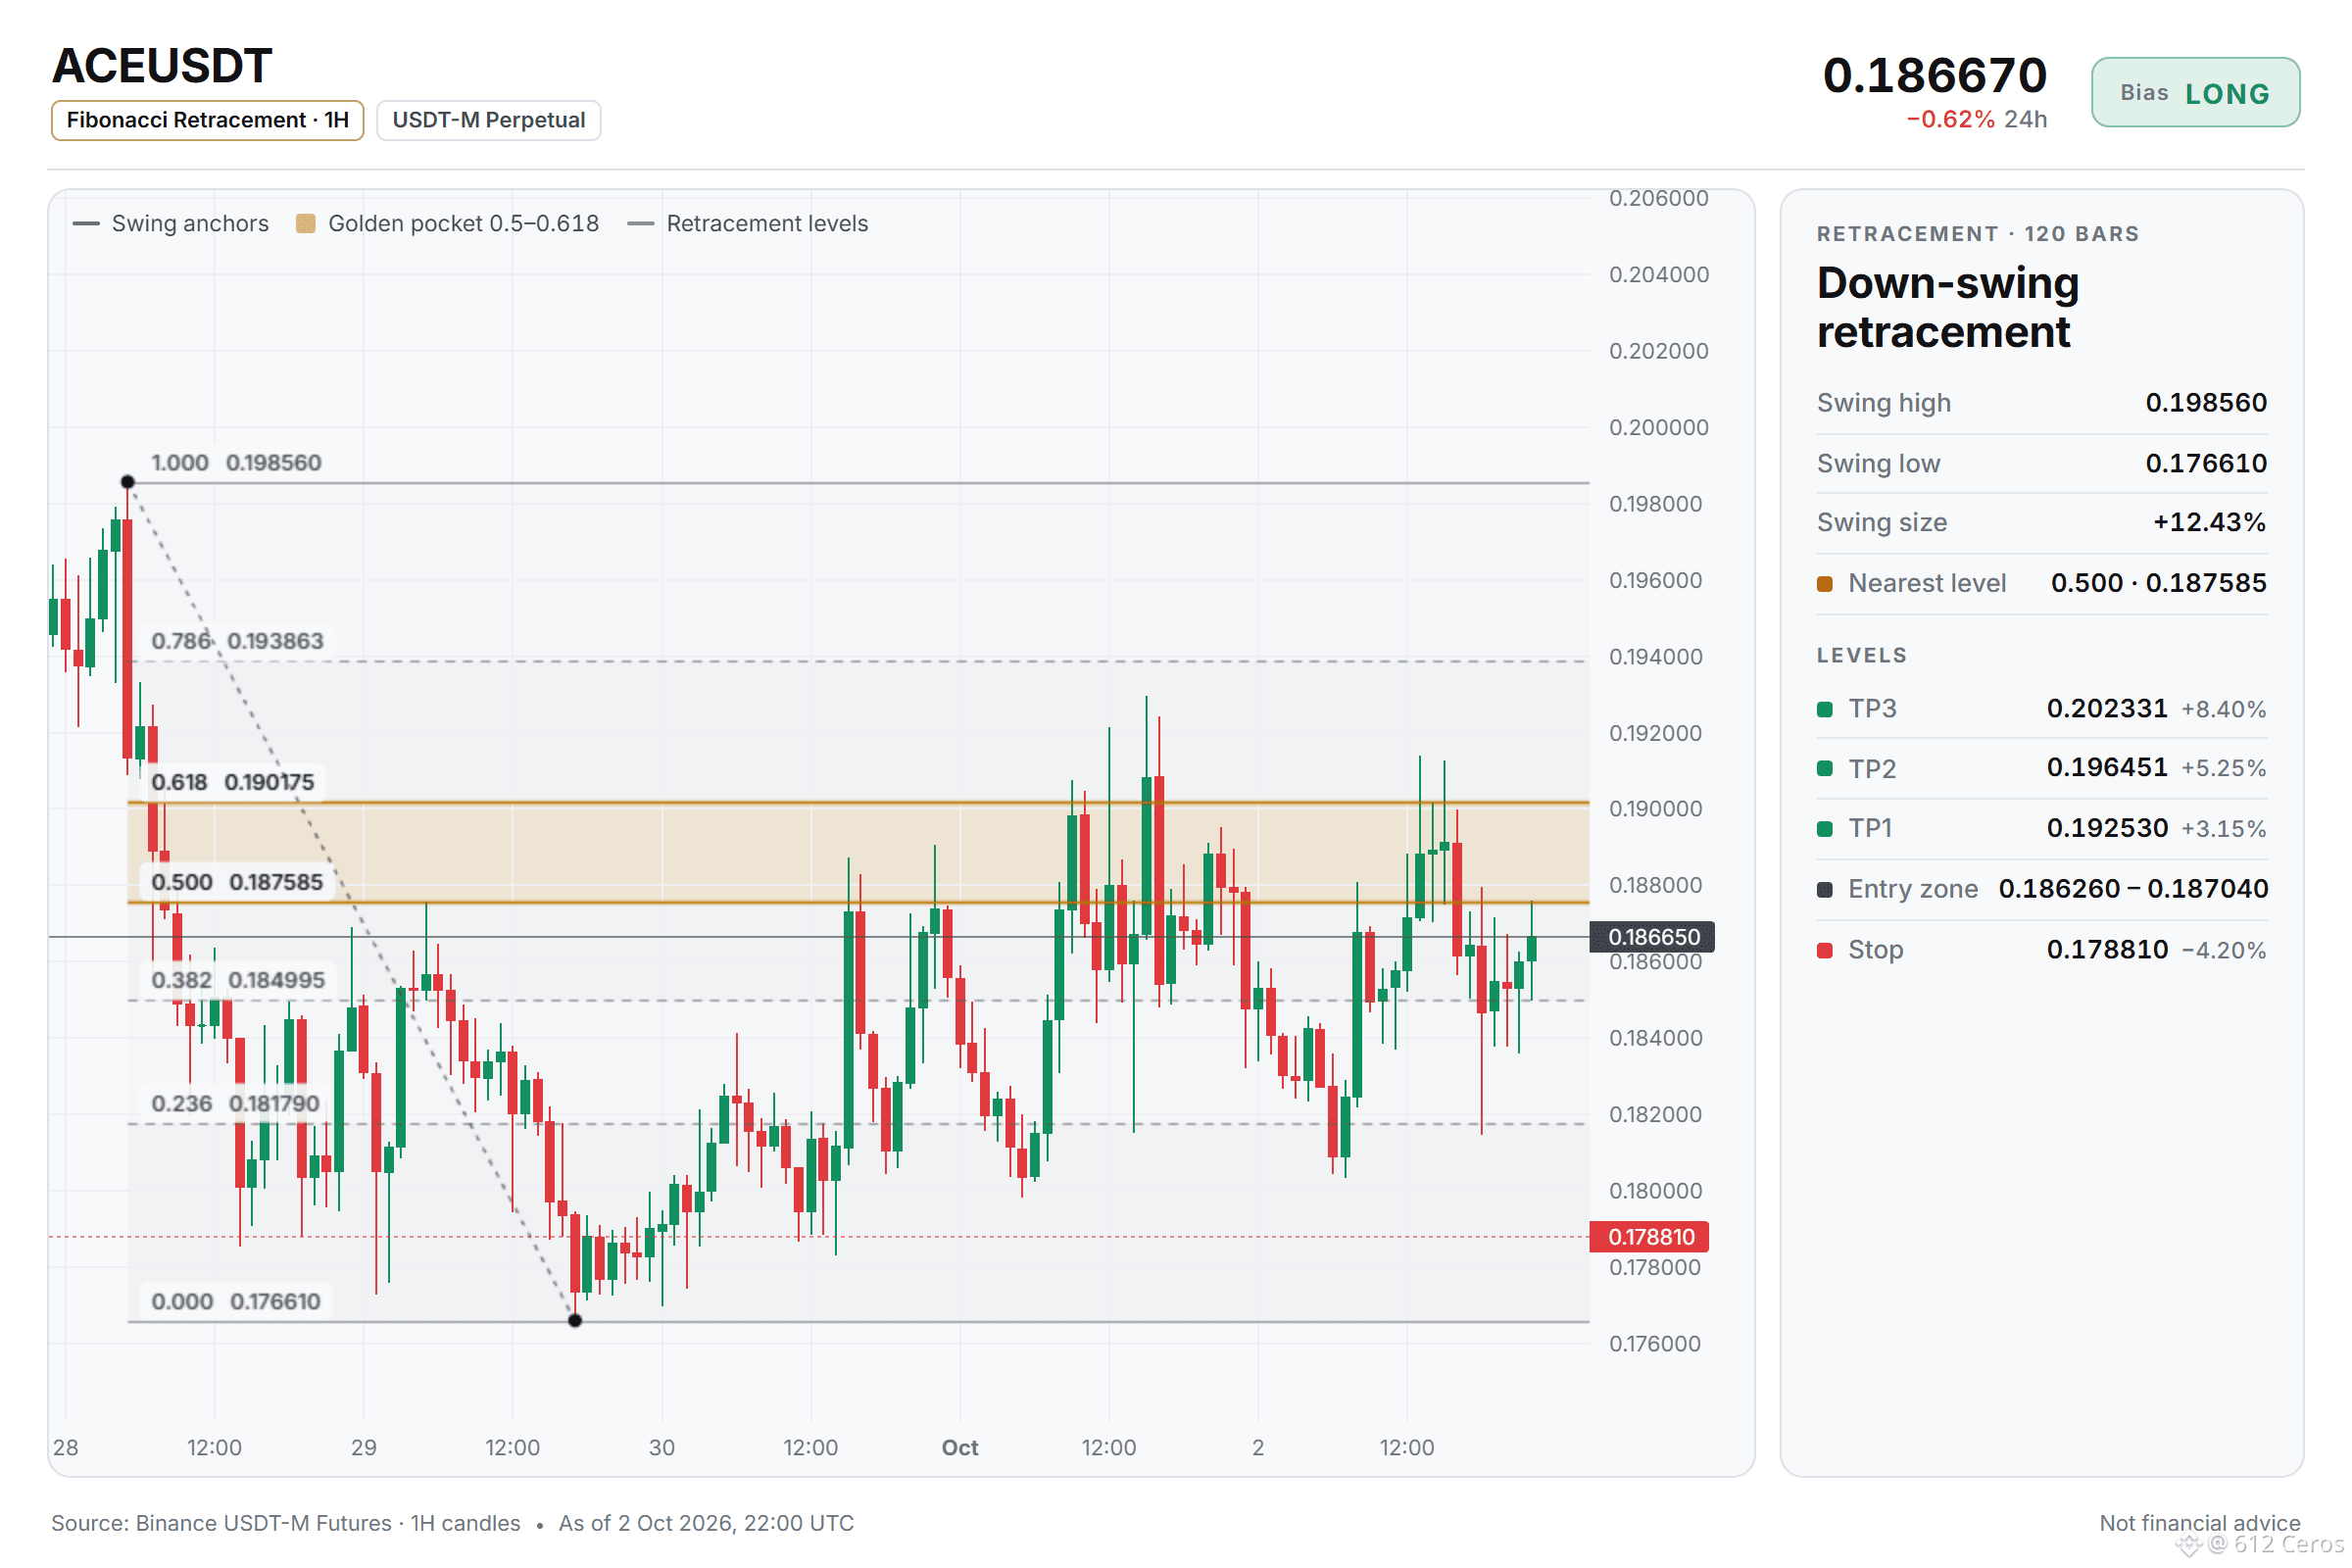
🟢 LONG $ACE /USDT: expecting price to go UP
Bias: LONG · Leaning
Entry: 0.186260 – 0.187040
TP1: 0.192530 (+3.2%)
TP2: 0.196451 (+5.3%)
TP3: 0.202331 (+8.4%)
SL: 0.178810 (-4.2%)
Plan: enter only inside the zone, take half at TP1, then move the stop to entry.
Note: moderate conviction only, keep size light.
Why LONG? ACE checklist: 3/12 signals agree, 0 against, 9 undecided
• Daily trend: price > EMA50 > EMA200, bullish stack → the big-picture trend is up
• 4h trend: price > EMA50 > EMA200, bullish stack → the swing trend is up
• 1h trend: price > EMA50 > EMA200, bullish stack → the short-term trend is up
Watch: The idea is wrong if price reaches the stop at 0.178810
Bottom line: The daily trend is bullish, which means the big-picture trend is up, but the 1h trend is also bullish, so the short-term trend is up as well, while the 4h trend is bullish meaning the swing trend is up, which gives a lean lean conviction because the 1h RSI is neutral and no other factors support the idea.
What is your entry level if the price pulls back to the low end of the range?
Levels mapped on the chart below.
{future}(ACEUSDT)
📲 Want more of my latest signals? Join me here:
[https://app.binance.com/uni-qr/D26WbL9t](https://app.binance.com/uni-qr/D26WbL9t)
⚠️ Personal market analysis only. NFA — manage risk and DYOR.
Educational content, not investment advice or a recommendation to buy, sell, deposit, or withdraw any asset. No paid promotion or referral/affiliate links.
Most traders will fade this one higher, but the daily trend says otherwise.
🟢 LONG $ACE /USDT: expecting price to go UP
Bias: LONG · Leaning
Entry: 0.186260 – 0.187040
TP1: 0.192530 (+3.2%)
TP2: 0.196451 (+5.3%)
TP3: 0.202331 (+8.4%)
SL: 0.178810 (-4.2%)
Plan: enter only inside the zone, take half at TP1, then move the stop to entry.
Note: moderate conviction only, keep size light.
Why LONG? ACE checklist: 3/12 signals agree, 0 against, 9 undecided
• Daily trend: price > EMA50 > EMA200, bullish stack → the big-picture trend is up
• 4h trend: price > EMA50 > EMA200, bullish stack → the swing trend is up
• 1h trend: price > EMA50 > EMA200, bullish stack → the short-term trend is up
Watch: The idea is wrong if price reaches the stop at 0.178810
Bottom line: The daily trend is bullish, which means the big-picture trend is up, but the 1h trend is also bullish, so the short-term trend is up as well, while the 4h trend is bullish meaning the swing trend is up, which gives a lean lean conviction because the 1h RSI is neutral and no other factors support the idea.
What is your entry level if the price pulls back to the low end of the range?
Levels mapped on the chart below.
📲 Want more of my latest signals? Join me here:
https://app.binance.com/uni-qr/D26WbL9t
⚠️ Personal market analysis only. NFA — manage risk and DYOR.
Educational content, not investment advice or a recommendation to buy, sell, deposit, or withdraw any asset. No paid promotion or referral/affiliate links.
🟢 LONG $ACE /USDT: expecting price to go UP
Bias: LONG · Leaning
Entry: 0.186260 – 0.187040
TP1: 0.192530 (+3.2%)
TP2: 0.196451 (+5.3%)
TP3: 0.202331 (+8.4%)
SL: 0.178810 (-4.2%)
Plan: enter only inside the zone, take half at TP1, then move the stop to entry.
Note: moderate conviction only, keep size light.
Why LONG? ACE checklist: 3/12 signals agree, 0 against, 9 undecided
• Daily trend: price > EMA50 > EMA200, bullish stack → the big-picture trend is up
• 4h trend: price > EMA50 > EMA200, bullish stack → the swing trend is up
• 1h trend: price > EMA50 > EMA200, bullish stack → the short-term trend is up
Watch: The idea is wrong if price reaches the stop at 0.178810
Bottom line: The daily trend is bullish, which means the big-picture trend is up, but the 1h trend is also bullish, so the short-term trend is up as well, while the 4h trend is bullish meaning the swing trend is up, which gives a lean lean conviction because the 1h RSI is neutral and no other factors support the idea.
What is your entry level if the price pulls back to the low end of the range?
Levels mapped on the chart below.
📲 Want more of my latest signals? Join me here:
https://app.binance.com/uni-qr/D26WbL9t
⚠️ Personal market analysis only. NFA — manage risk and DYOR.
Educational content, not investment advice or a recommendation to buy, sell, deposit, or withdraw any asset. No paid promotion or referral/affiliate links.
1
1
244
·
--
Haussier
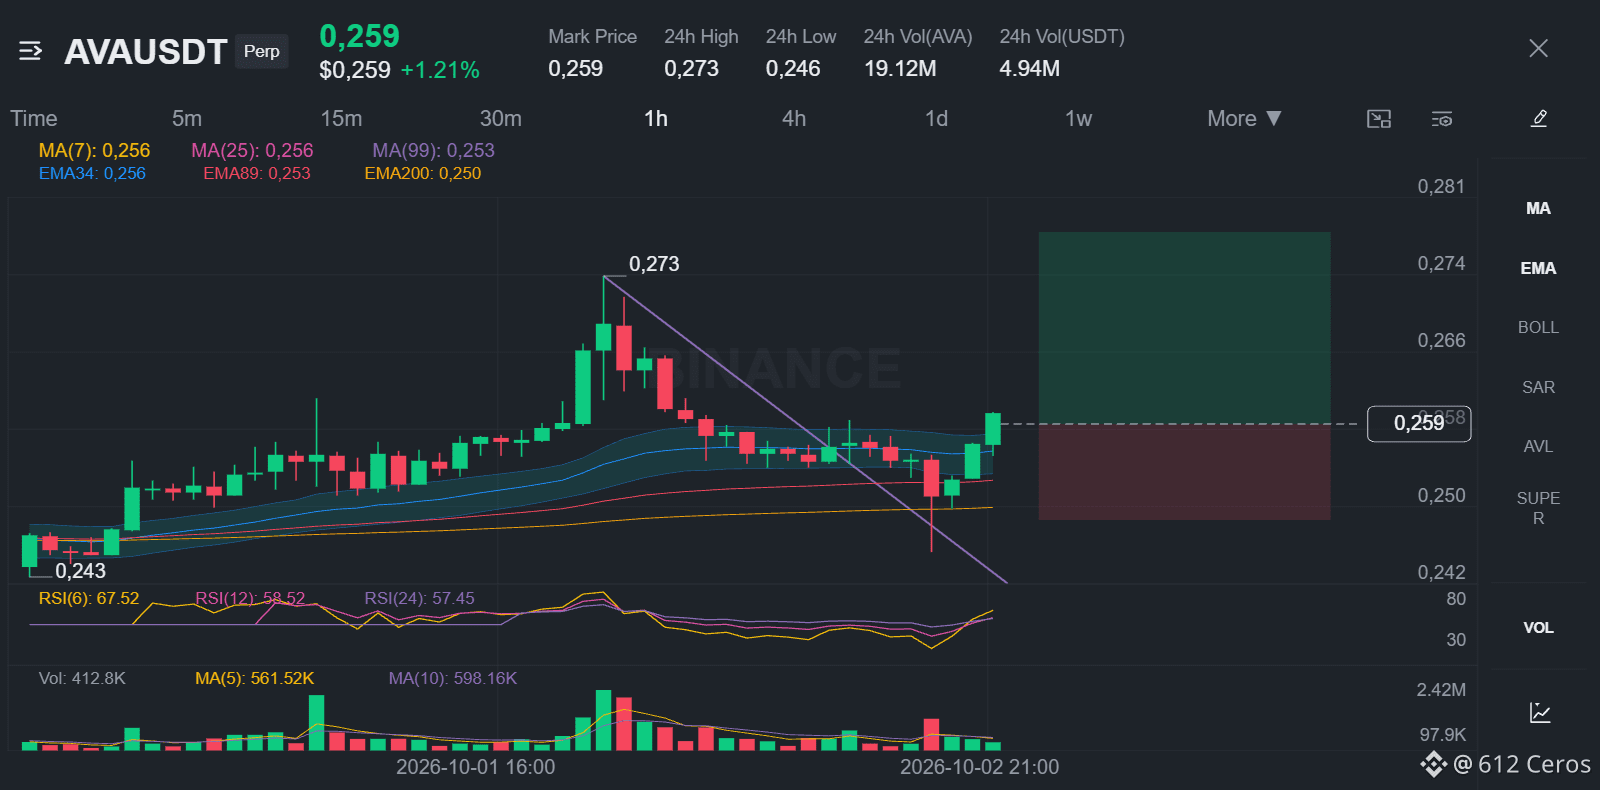
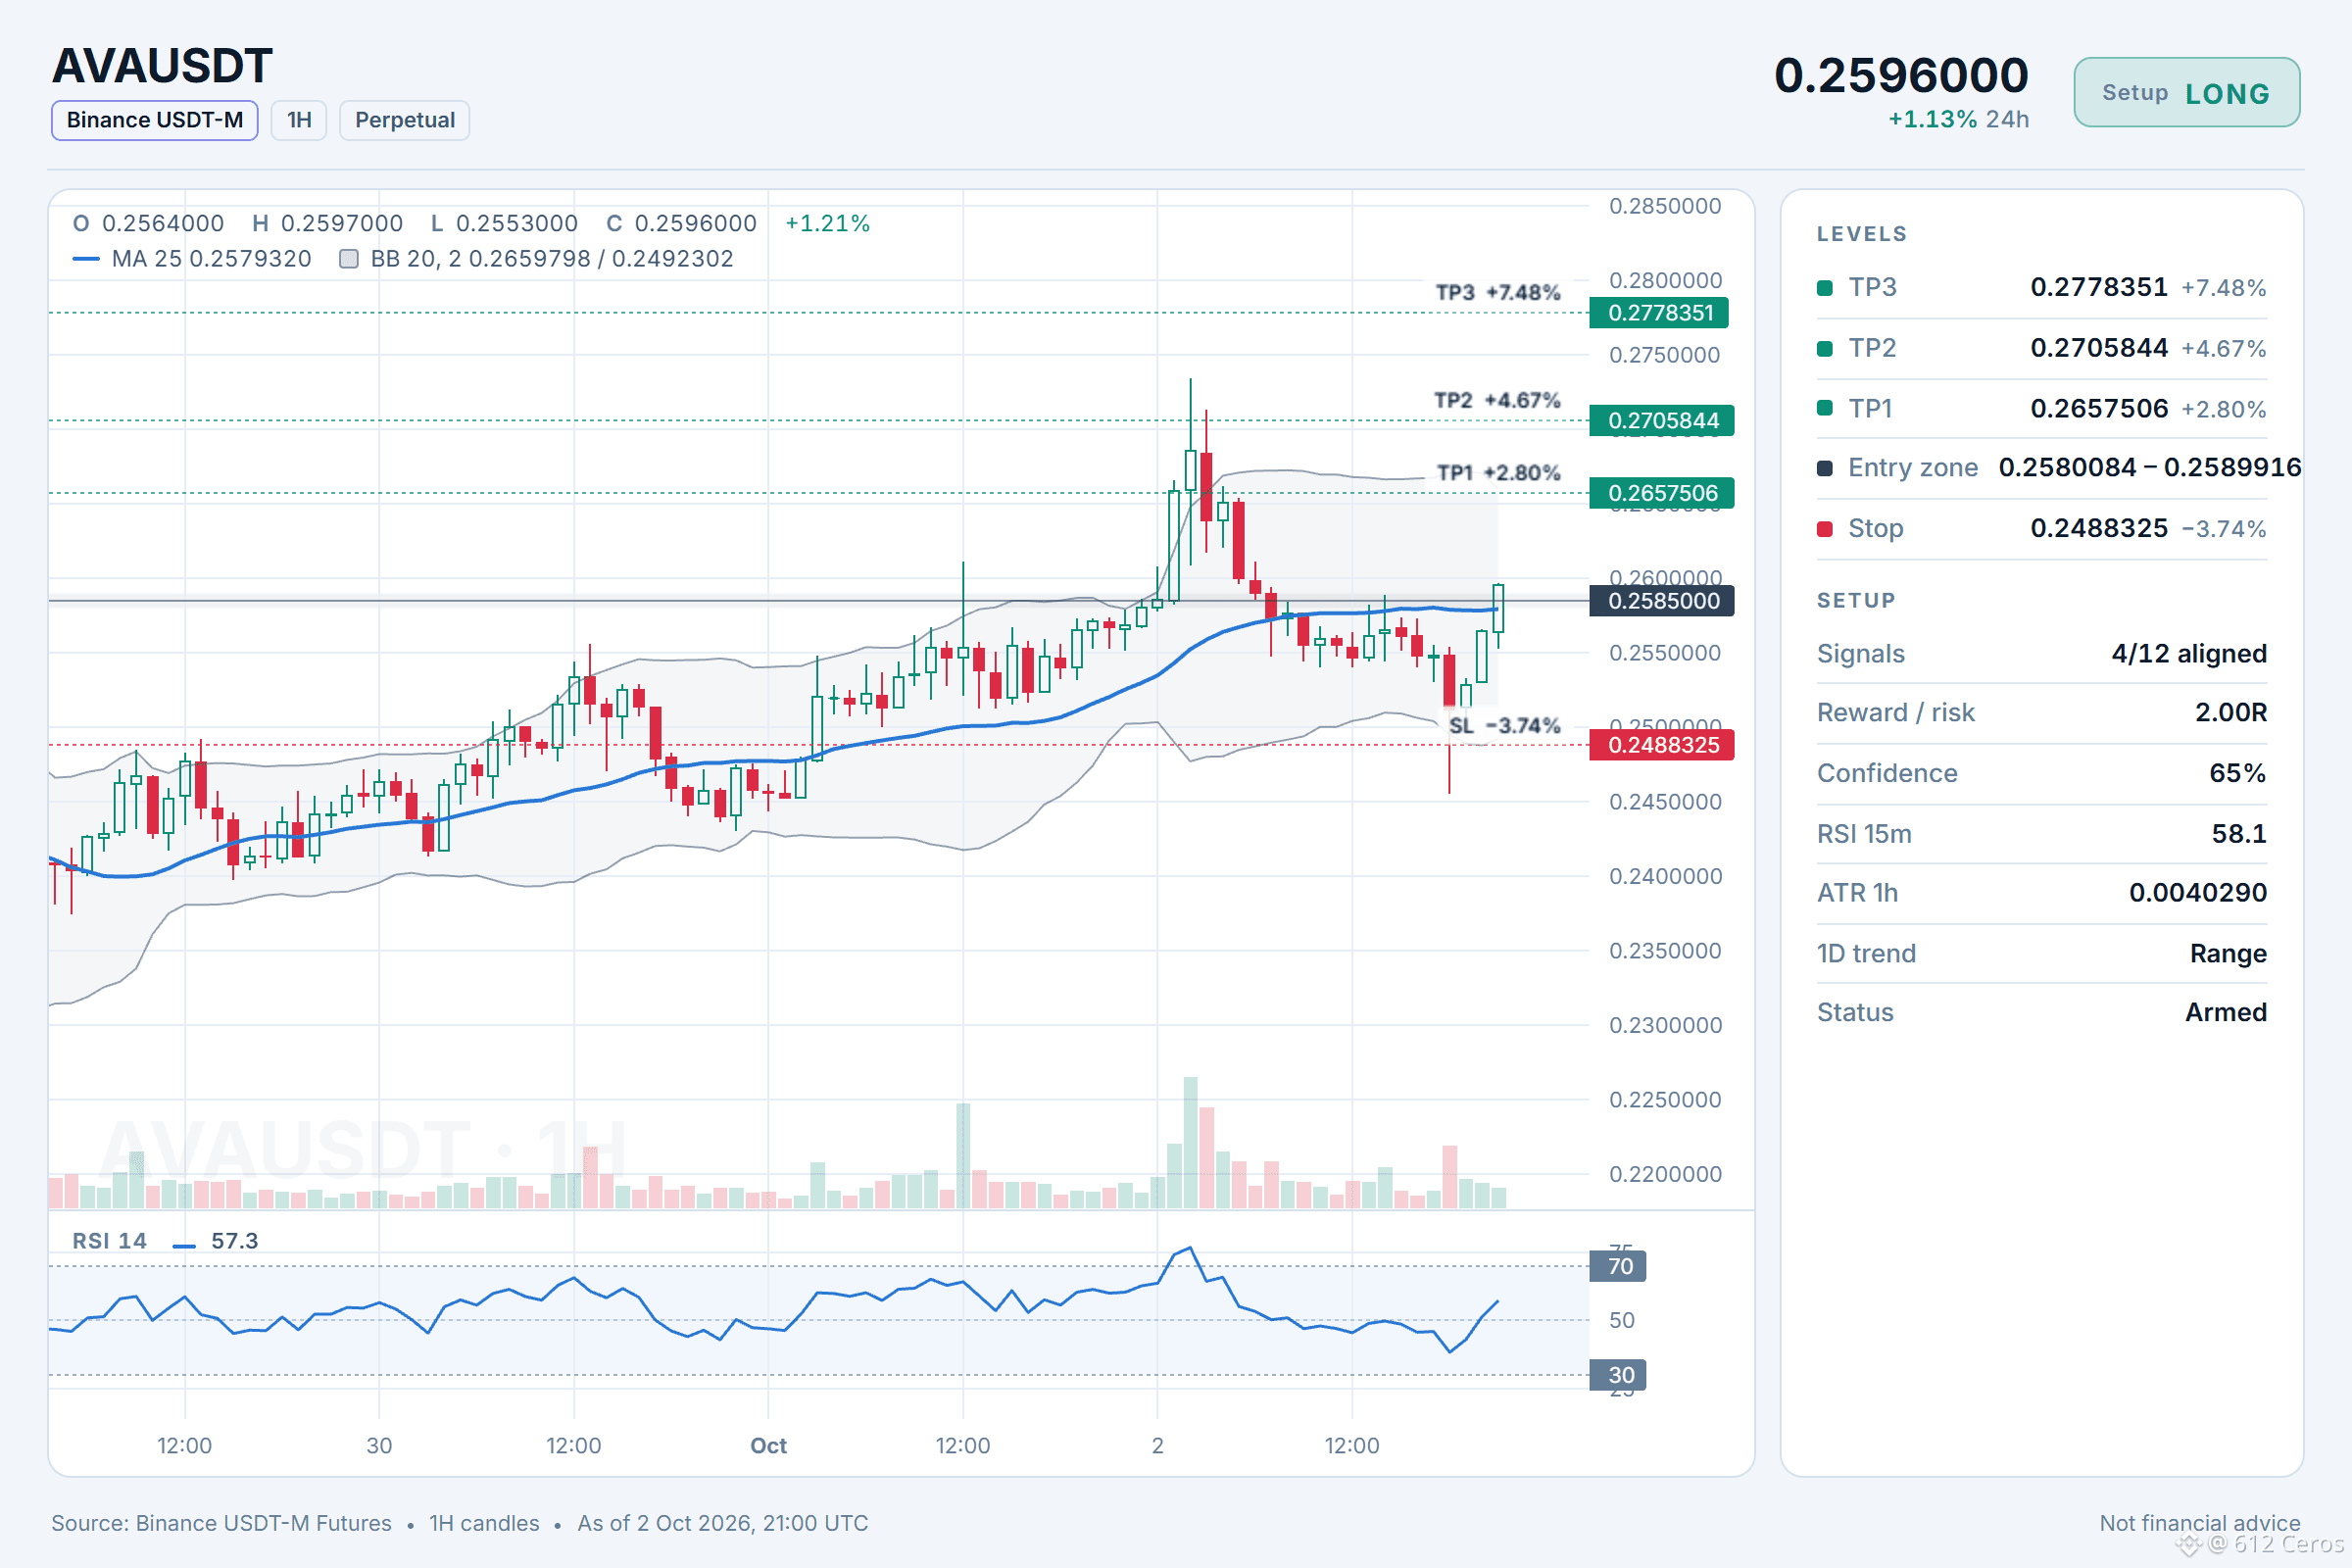
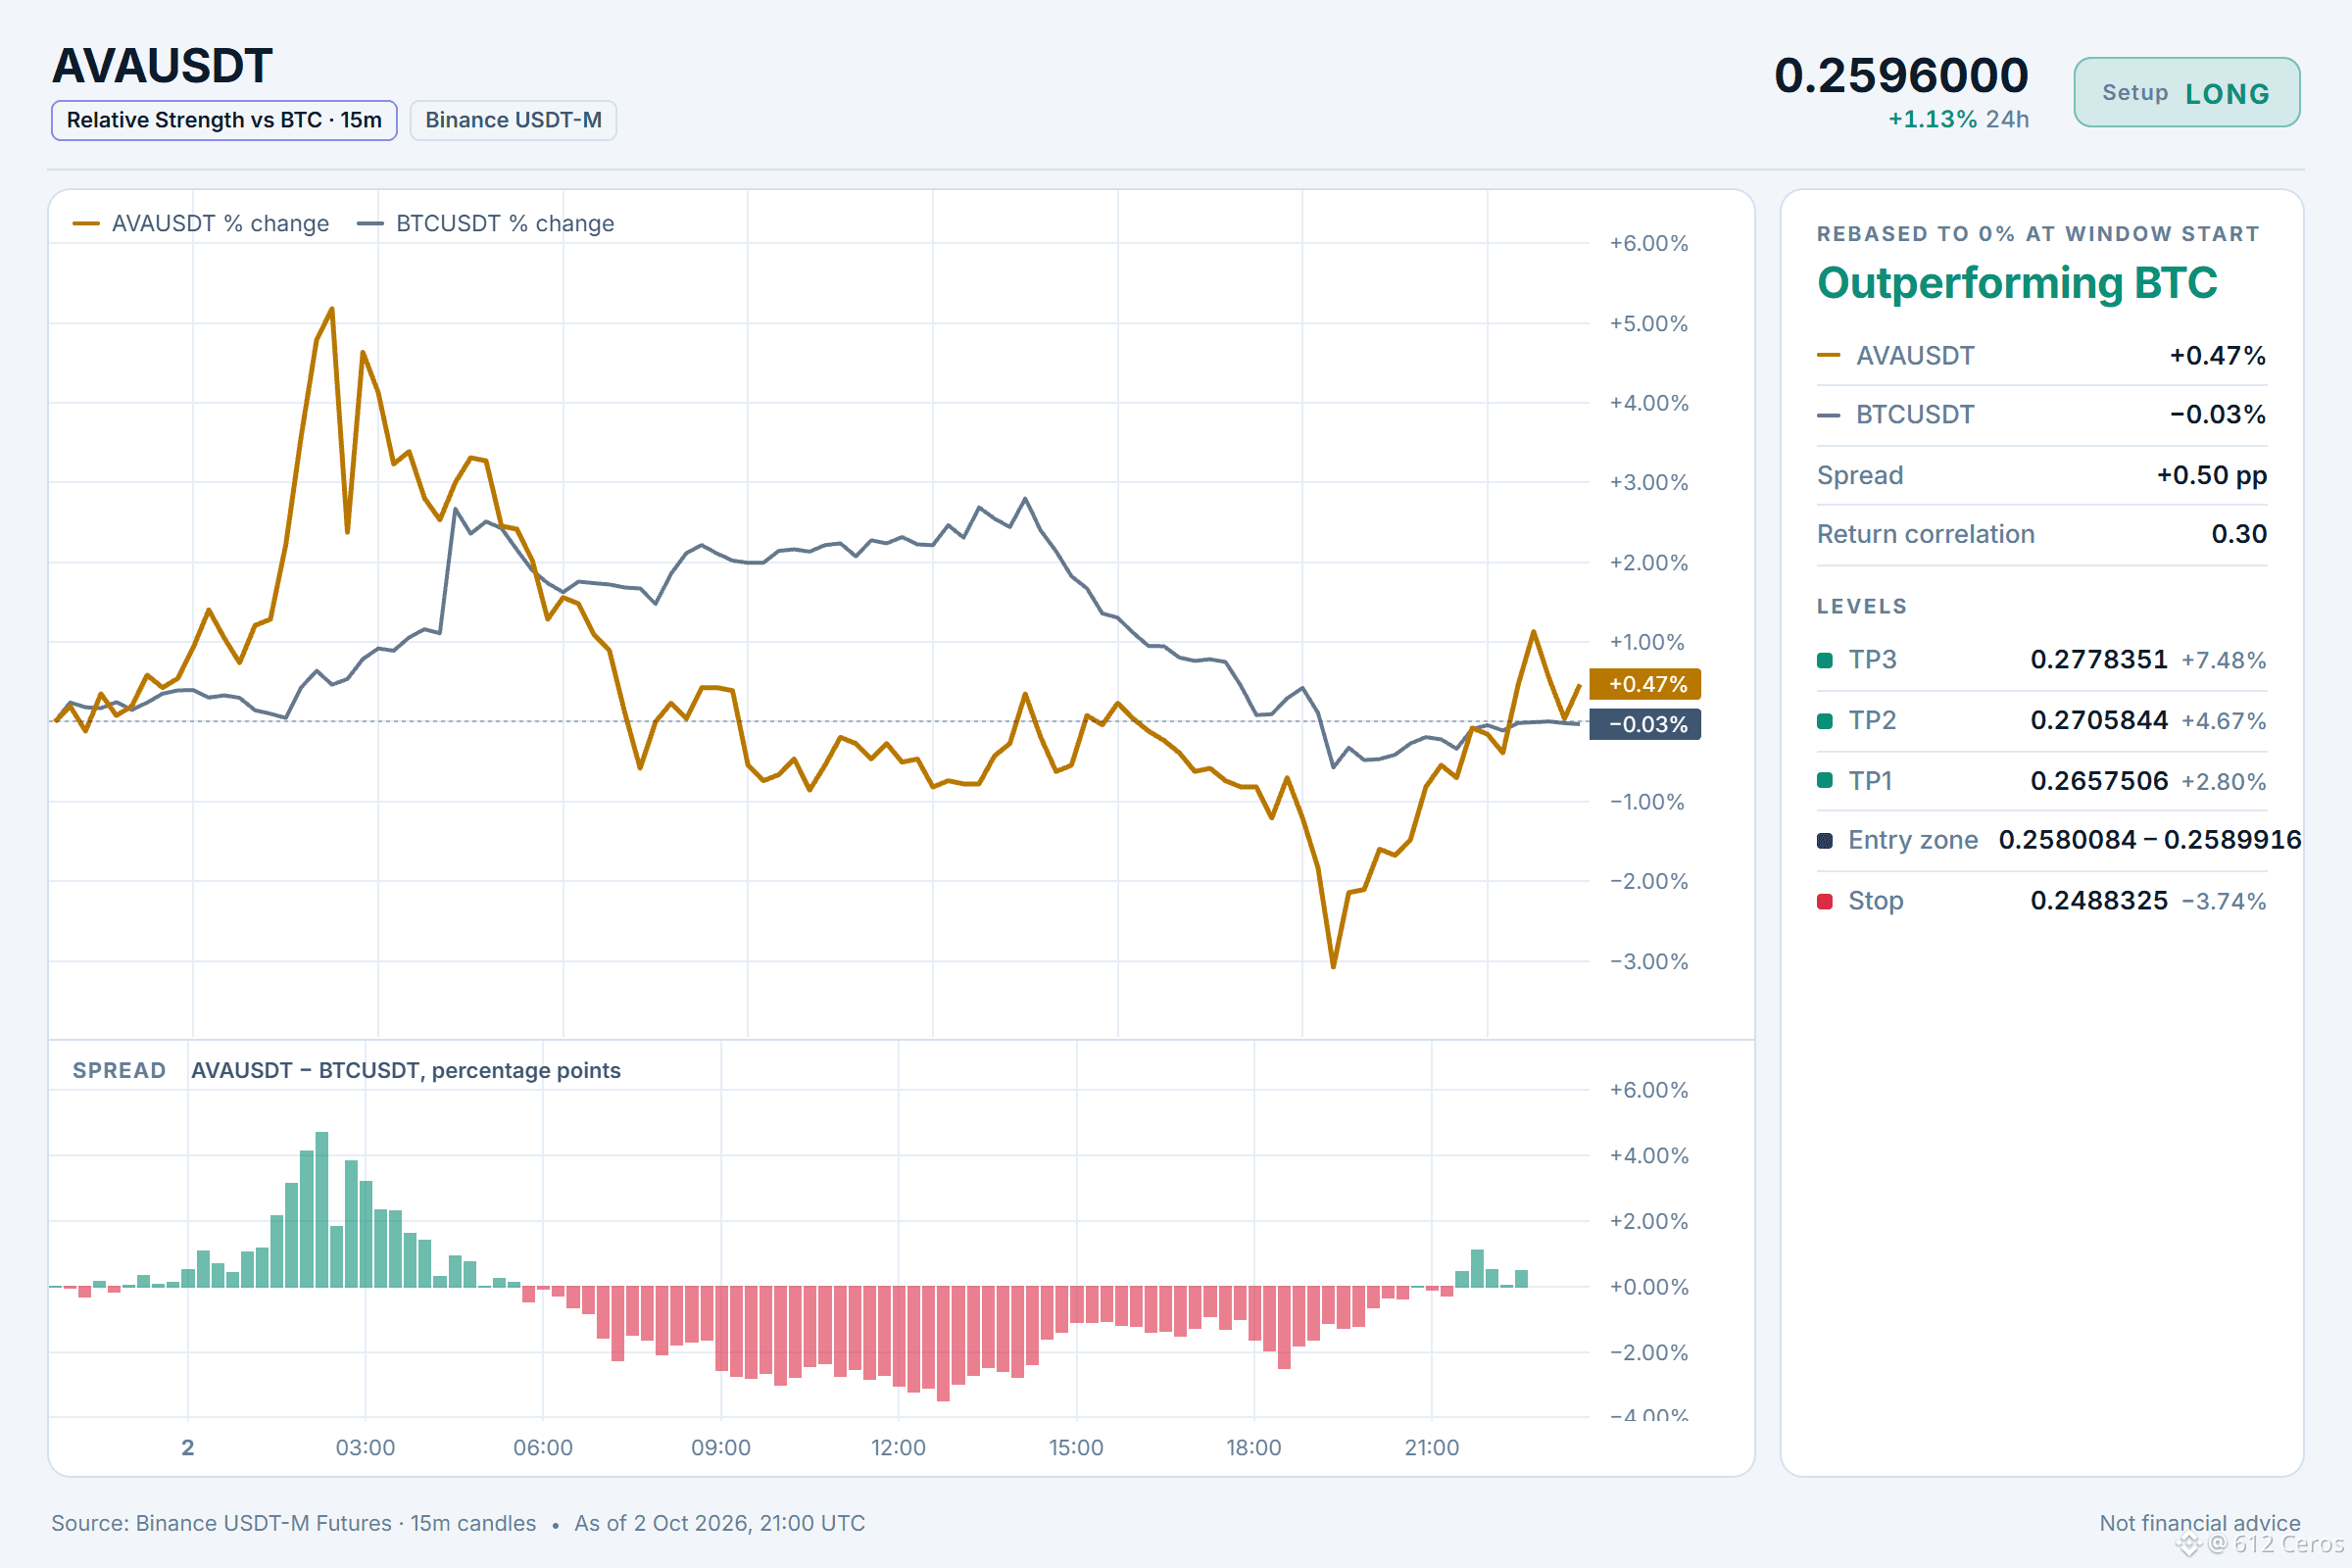
🟢 LONG $AVA /USDT: expecting price to go UP
Bias: LONG · Leaning
Entry: 0.2580084 – 0.2589916
TP1: 0.2657506 (+2.8%)
TP2: 0.2705844 (+4.7%)
TP3: 0.2778351 (+7.5%)
SL: 0.2488325 (-3.7%)
Plan: enter only inside the zone, take half at TP1, then move the stop to entry.
Note: moderate conviction only, keep size light.
AVA is range-bound, but the swing trend says buy.
Why LONG? Leaning call, 4/12 signals agree, 0 against, 8 undecided.
• 4h trend: price > EMA50 > EMA200, bullish stack → the swing trend is up
• 1h trend: price > EMA50 > EMA200, bullish stack → the short-term trend is up
• 1h RSI: 57.3, bullish momentum (above 55) → buyers have the momentum
The 4h trend shows price above EMA50 above EMA200, a bullish stack. The 1h RSI at 57.3 shows buyers have momentum.
Would you wait for the daily trend to break range, or are you comfortable entering at the 1h level?
Full setup on the chart below.
{future}(AVAUSDT)
📲 Want more of my latest signals? Join me here:
[https://app.binance.com/uni-qr/D26WbL9t](https://app.binance.com/uni-qr/D26WbL9t)
⚠️ Personal market analysis only. NFA — manage risk and DYOR.
Educational content, not investment advice or a recommendation to buy, sell, deposit, or withdraw any asset. No paid promotion or referral/affiliate links.
🟢 LONG $AVA /USDT: expecting price to go UP
Bias: LONG · Leaning
Entry: 0.2580084 – 0.2589916
TP1: 0.2657506 (+2.8%)
TP2: 0.2705844 (+4.7%)
TP3: 0.2778351 (+7.5%)
SL: 0.2488325 (-3.7%)
Plan: enter only inside the zone, take half at TP1, then move the stop to entry.
Note: moderate conviction only, keep size light.
AVA is range-bound, but the swing trend says buy.
Why LONG? Leaning call, 4/12 signals agree, 0 against, 8 undecided.
• 4h trend: price > EMA50 > EMA200, bullish stack → the swing trend is up
• 1h trend: price > EMA50 > EMA200, bullish stack → the short-term trend is up
• 1h RSI: 57.3, bullish momentum (above 55) → buyers have the momentum
The 4h trend shows price above EMA50 above EMA200, a bullish stack. The 1h RSI at 57.3 shows buyers have momentum.
Would you wait for the daily trend to break range, or are you comfortable entering at the 1h level?
Full setup on the chart below.
📲 Want more of my latest signals? Join me here:
https://app.binance.com/uni-qr/D26WbL9t
⚠️ Personal market analysis only. NFA — manage risk and DYOR.
Educational content, not investment advice or a recommendation to buy, sell, deposit, or withdraw any asset. No paid promotion or referral/affiliate links.
Bias: LONG · Leaning
Entry: 0.2580084 – 0.2589916
TP1: 0.2657506 (+2.8%)
TP2: 0.2705844 (+4.7%)
TP3: 0.2778351 (+7.5%)
SL: 0.2488325 (-3.7%)
Plan: enter only inside the zone, take half at TP1, then move the stop to entry.
Note: moderate conviction only, keep size light.
AVA is range-bound, but the swing trend says buy.
Why LONG? Leaning call, 4/12 signals agree, 0 against, 8 undecided.
• 4h trend: price > EMA50 > EMA200, bullish stack → the swing trend is up
• 1h trend: price > EMA50 > EMA200, bullish stack → the short-term trend is up
• 1h RSI: 57.3, bullish momentum (above 55) → buyers have the momentum
The 4h trend shows price above EMA50 above EMA200, a bullish stack. The 1h RSI at 57.3 shows buyers have momentum.
Would you wait for the daily trend to break range, or are you comfortable entering at the 1h level?
Full setup on the chart below.
📲 Want more of my latest signals? Join me here:
https://app.binance.com/uni-qr/D26WbL9t
⚠️ Personal market analysis only. NFA — manage risk and DYOR.
Educational content, not investment advice or a recommendation to buy, sell, deposit, or withdraw any asset. No paid promotion or referral/affiliate links.
224
·
--
Baissier
What if MARSCOIN keeps falling in this range?
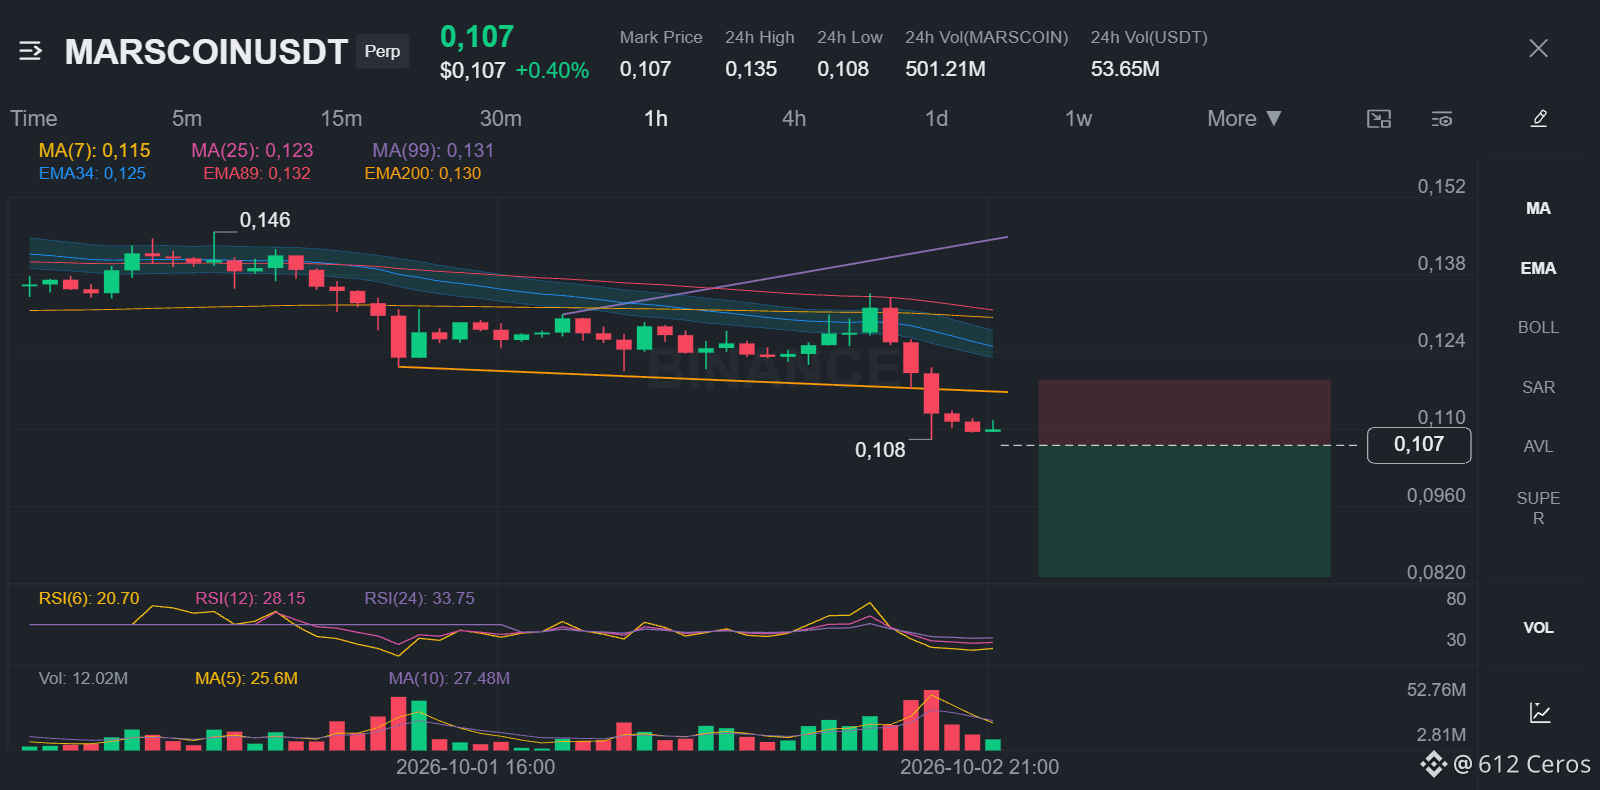
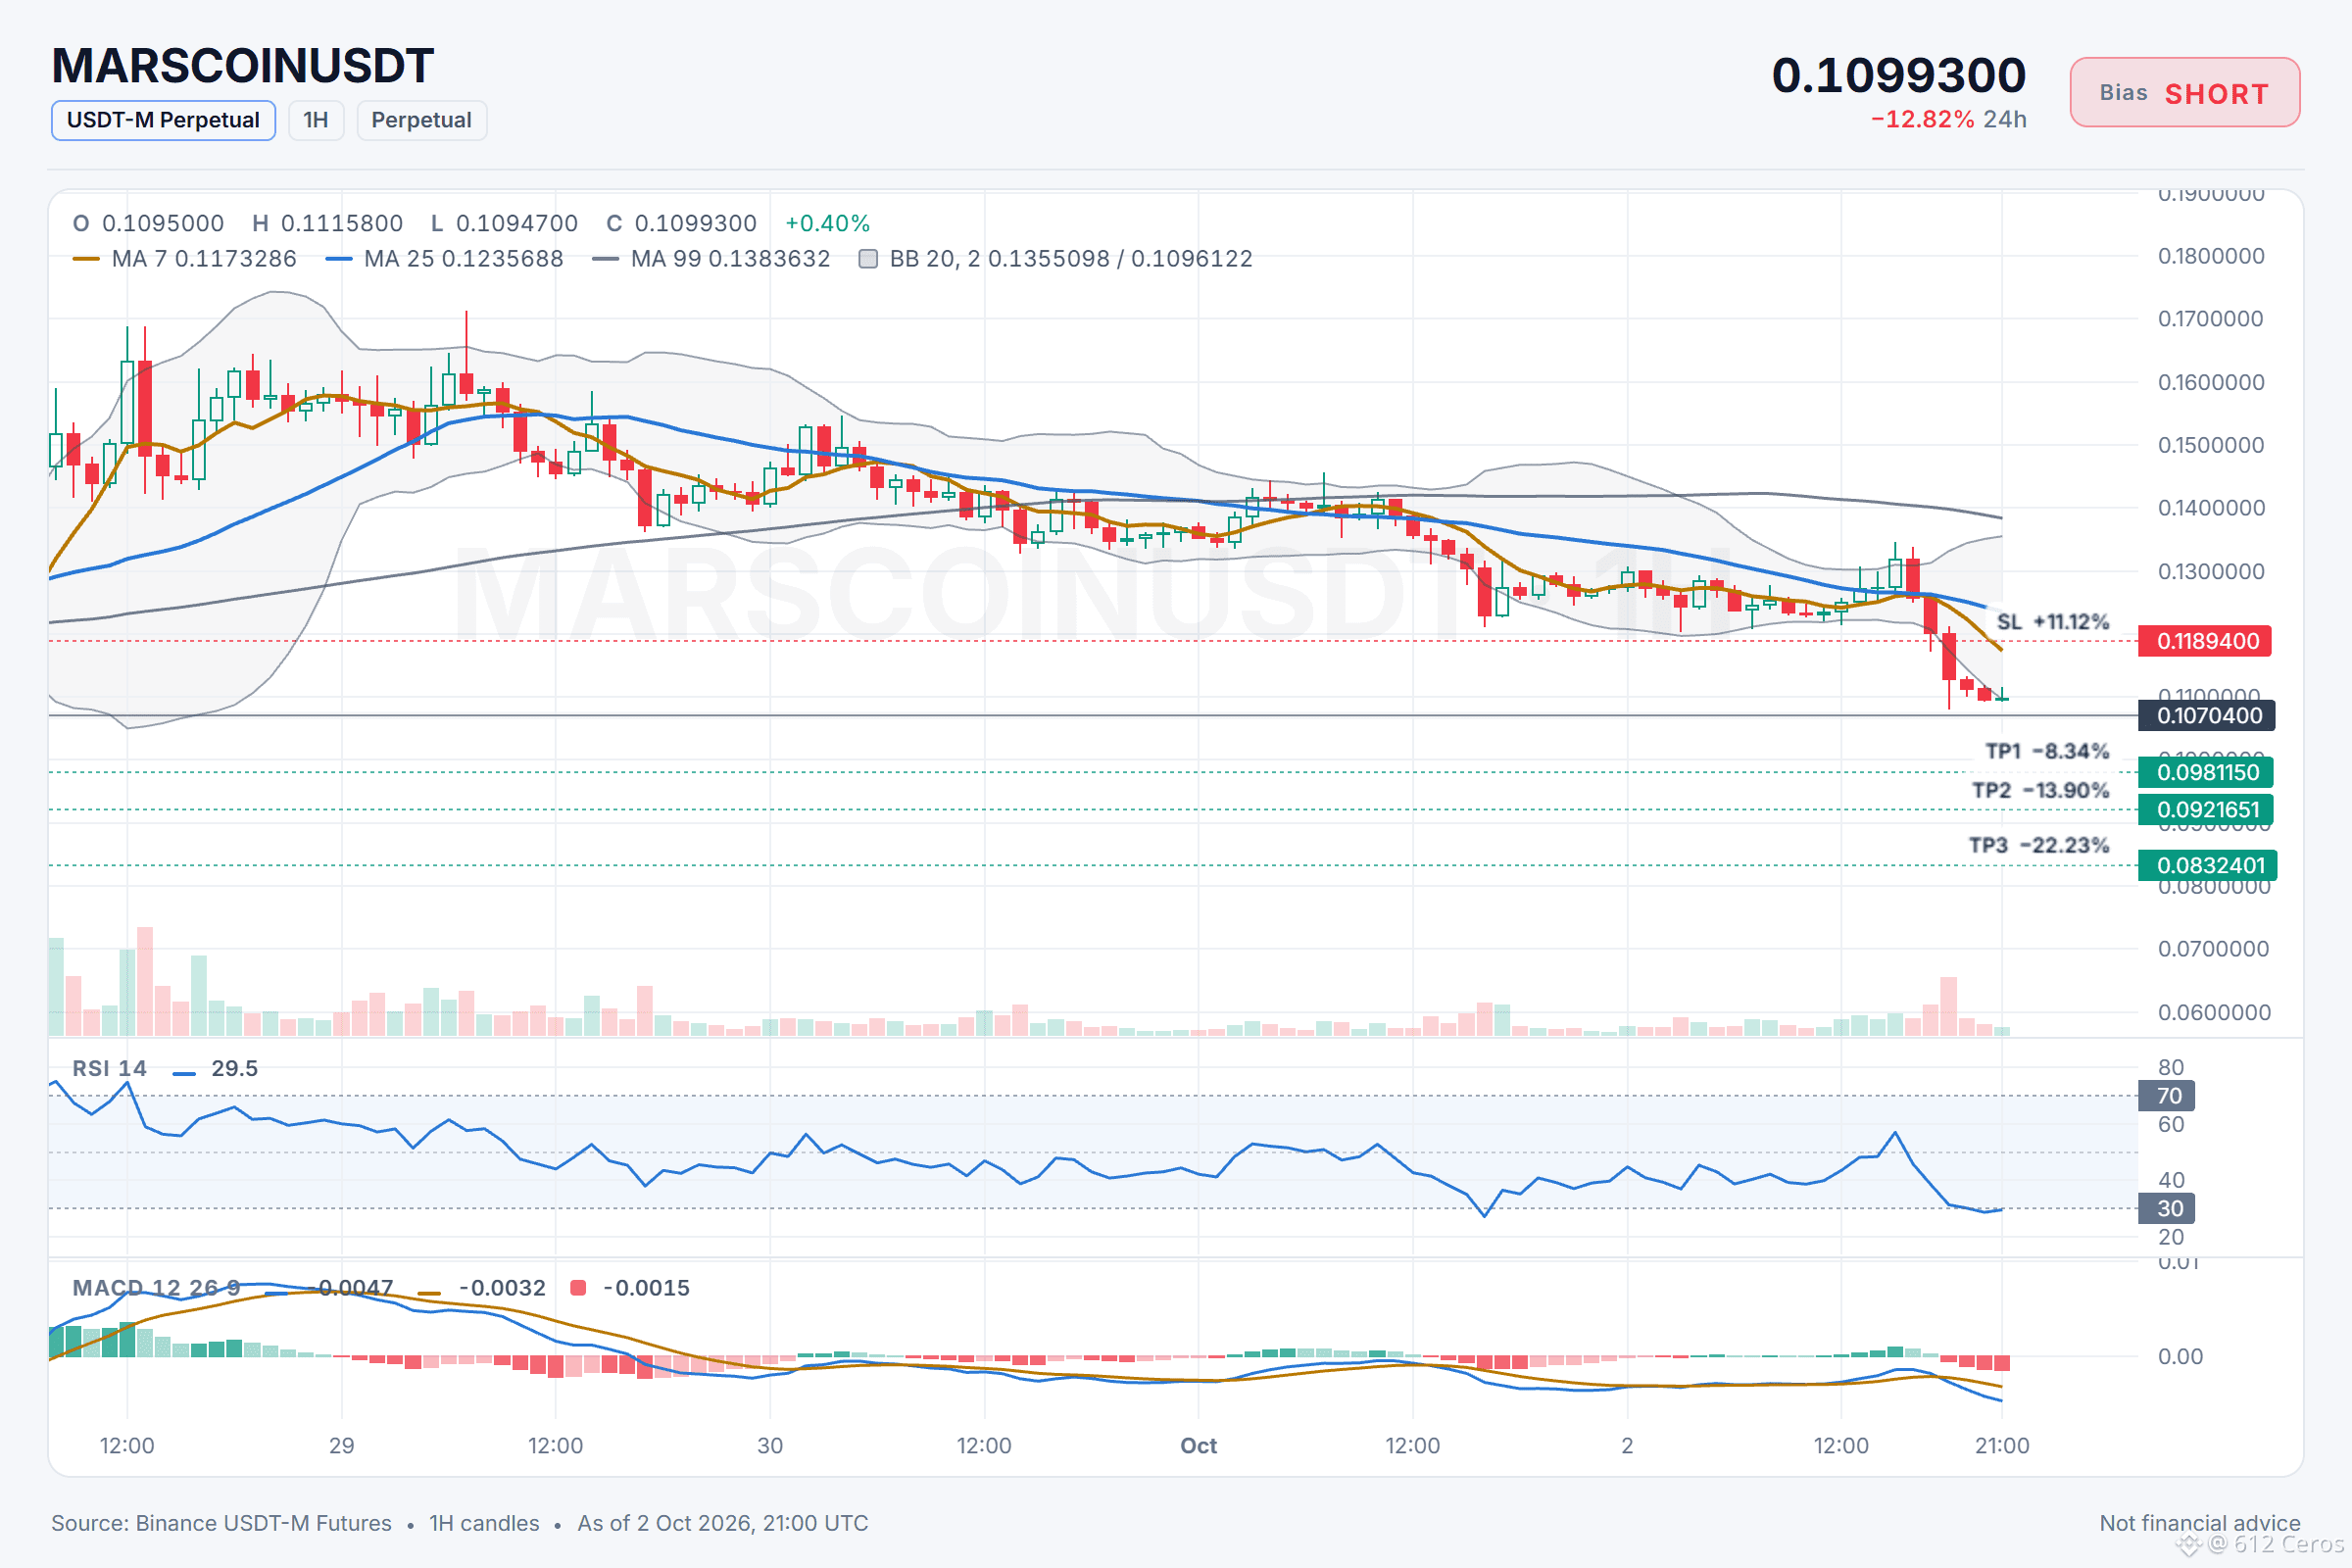
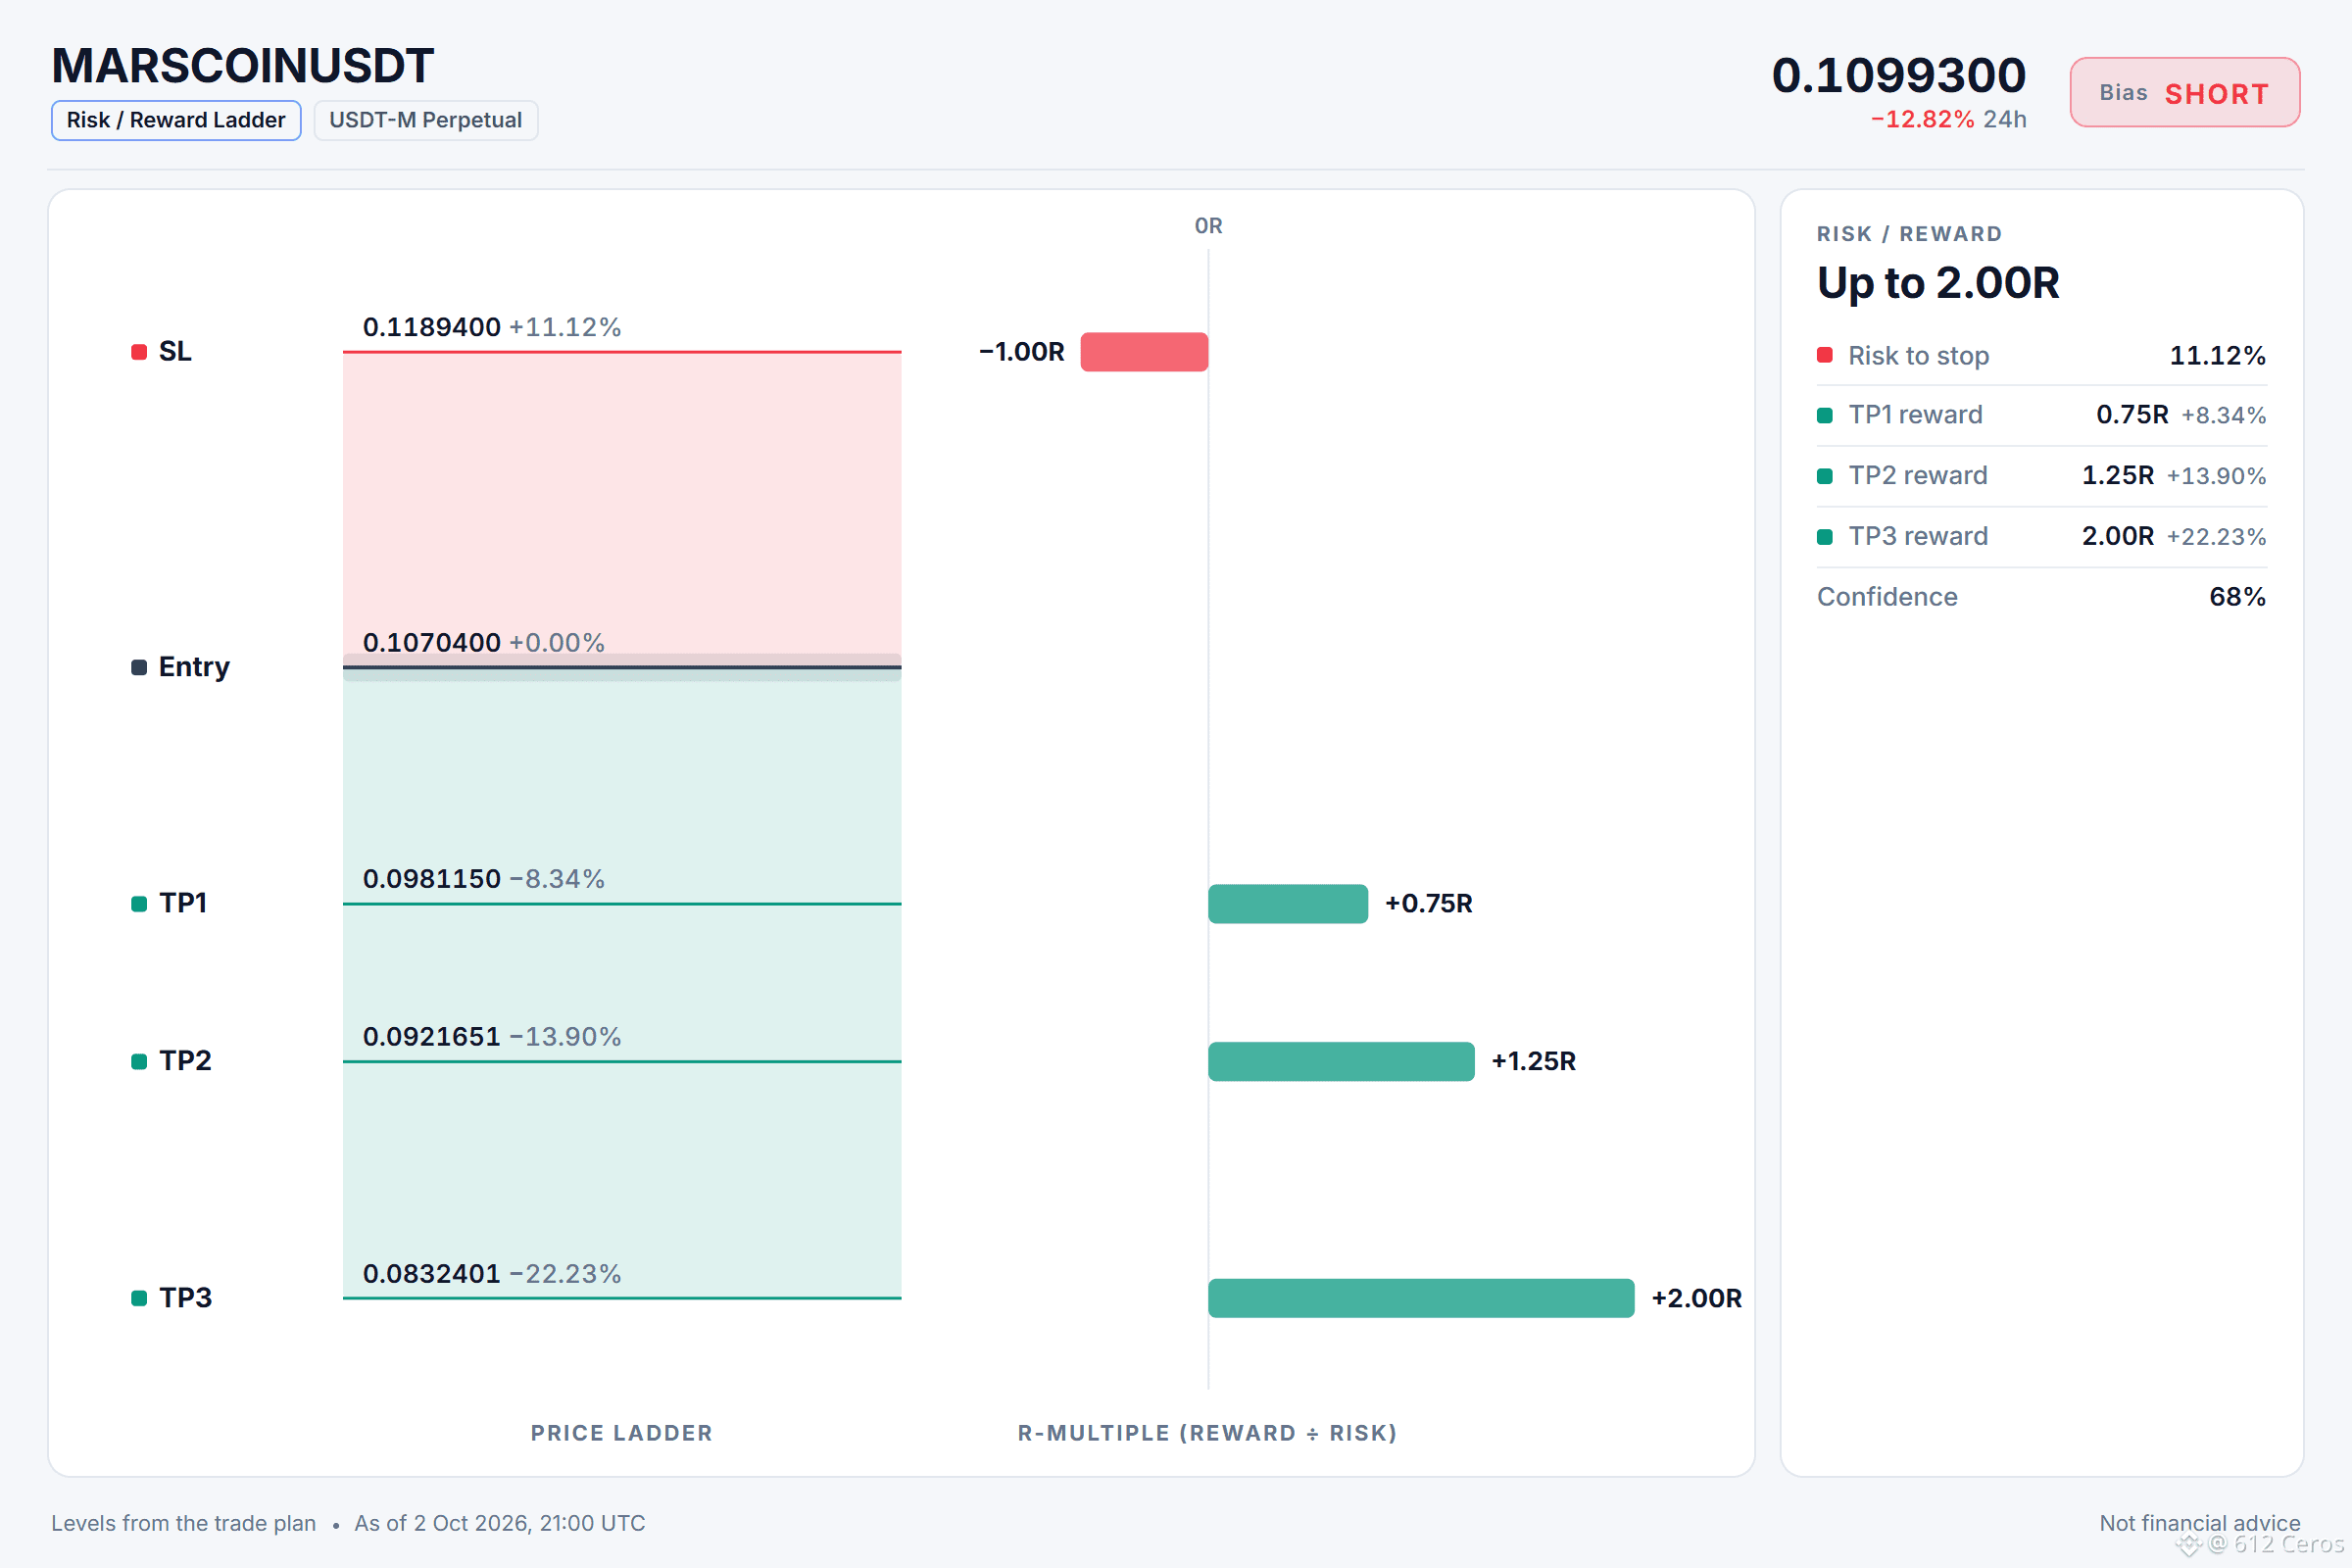
🔴 SHORT $MARSCOIN /USDT: expecting price to go DOWN
Bias: SHORT · Strong
Entry: 0.1065114 – 0.1075686
TP1: 0.0981150 (-8.3%)
TP2: 0.0921651 (-13.9%)
TP3: 0.0832401 (-22.2%)
SL: 0.1189400 (+11.1%)
Plan: enter only inside the zone, take half at TP1, then move the stop to entry.
Why SHORT? Strong call, 5/10 signals agree, 1 against, 4 undecided.
• 1h trend: price < EMA50 < EMA200, bearish stack → the short-term trend is down
• Trend strength (ADX/DI, 15m): ADX 38.9 with sellers in control (DI+ 13.3 vs DI− 37.9) → sellers are driving the move
• 4h RSI: 34.2, bearish momentum (below 45) → sellers have the momentum
Risk: Distance from 1h EMA50: −4.2 ATR from the 1h EMA50, overextended with bounce risk → price fell far below its average, a bounce is likely
Trade note: MARSCOIN
I'm watching for a short entry because the 1h trend is bearish and the 4h RSI shows sellers have momentum. I want to see a reaction near the entry level of 0.1065114. The main risk is that the price is 4.2 ATR below the 1h EMA50, which means a bounce is possible.
At what level would you place your invalidation for this short?
Levels mapped on the chart below.
{future}(MARSCOINUSDT)
📲 Want more of my latest signals? Join me here:
[https://app.binance.com/uni-qr/D26WbL9t](https://app.binance.com/uni-qr/D26WbL9t)
⚠️ Personal market analysis only. NFA — manage risk and DYOR.
Educational content, not investment advice or a recommendation to buy, sell, deposit, or withdraw any asset. No paid promotion or referral/affiliate links.
What if MARSCOIN keeps falling in this range?
🔴 SHORT $MARSCOIN /USDT: expecting price to go DOWN
Bias: SHORT · Strong
Entry: 0.1065114 – 0.1075686
TP1: 0.0981150 (-8.3%)
TP2: 0.0921651 (-13.9%)
TP3: 0.0832401 (-22.2%)
SL: 0.1189400 (+11.1%)
Plan: enter only inside the zone, take half at TP1, then move the stop to entry.
Why SHORT? Strong call, 5/10 signals agree, 1 against, 4 undecided.
• 1h trend: price < EMA50 < EMA200, bearish stack → the short-term trend is down
• Trend strength (ADX/DI, 15m): ADX 38.9 with sellers in control (DI+ 13.3 vs DI− 37.9) → sellers are driving the move
• 4h RSI: 34.2, bearish momentum (below 45) → sellers have the momentum
Risk: Distance from 1h EMA50: −4.2 ATR from the 1h EMA50, overextended with bounce risk → price fell far below its average, a bounce is likely
Trade note: MARSCOIN
I'm watching for a short entry because the 1h trend is bearish and the 4h RSI shows sellers have momentum. I want to see a reaction near the entry level of 0.1065114. The main risk is that the price is 4.2 ATR below the 1h EMA50, which means a bounce is possible.
At what level would you place your invalidation for this short?
Levels mapped on the chart below.
📲 Want more of my latest signals? Join me here:
https://app.binance.com/uni-qr/D26WbL9t
⚠️ Personal market analysis only. NFA — manage risk and DYOR.
Educational content, not investment advice or a recommendation to buy, sell, deposit, or withdraw any asset. No paid promotion or referral/affiliate links.
🔴 SHORT $MARSCOIN /USDT: expecting price to go DOWN
Bias: SHORT · Strong
Entry: 0.1065114 – 0.1075686
TP1: 0.0981150 (-8.3%)
TP2: 0.0921651 (-13.9%)
TP3: 0.0832401 (-22.2%)
SL: 0.1189400 (+11.1%)
Plan: enter only inside the zone, take half at TP1, then move the stop to entry.
Why SHORT? Strong call, 5/10 signals agree, 1 against, 4 undecided.
• 1h trend: price < EMA50 < EMA200, bearish stack → the short-term trend is down
• Trend strength (ADX/DI, 15m): ADX 38.9 with sellers in control (DI+ 13.3 vs DI− 37.9) → sellers are driving the move
• 4h RSI: 34.2, bearish momentum (below 45) → sellers have the momentum
Risk: Distance from 1h EMA50: −4.2 ATR from the 1h EMA50, overextended with bounce risk → price fell far below its average, a bounce is likely
Trade note: MARSCOIN
I'm watching for a short entry because the 1h trend is bearish and the 4h RSI shows sellers have momentum. I want to see a reaction near the entry level of 0.1065114. The main risk is that the price is 4.2 ATR below the 1h EMA50, which means a bounce is possible.
At what level would you place your invalidation for this short?
Levels mapped on the chart below.
📲 Want more of my latest signals? Join me here:
https://app.binance.com/uni-qr/D26WbL9t
⚠️ Personal market analysis only. NFA — manage risk and DYOR.
Educational content, not investment advice or a recommendation to buy, sell, deposit, or withdraw any asset. No paid promotion or referral/affiliate links.
634
·
--
Baissier
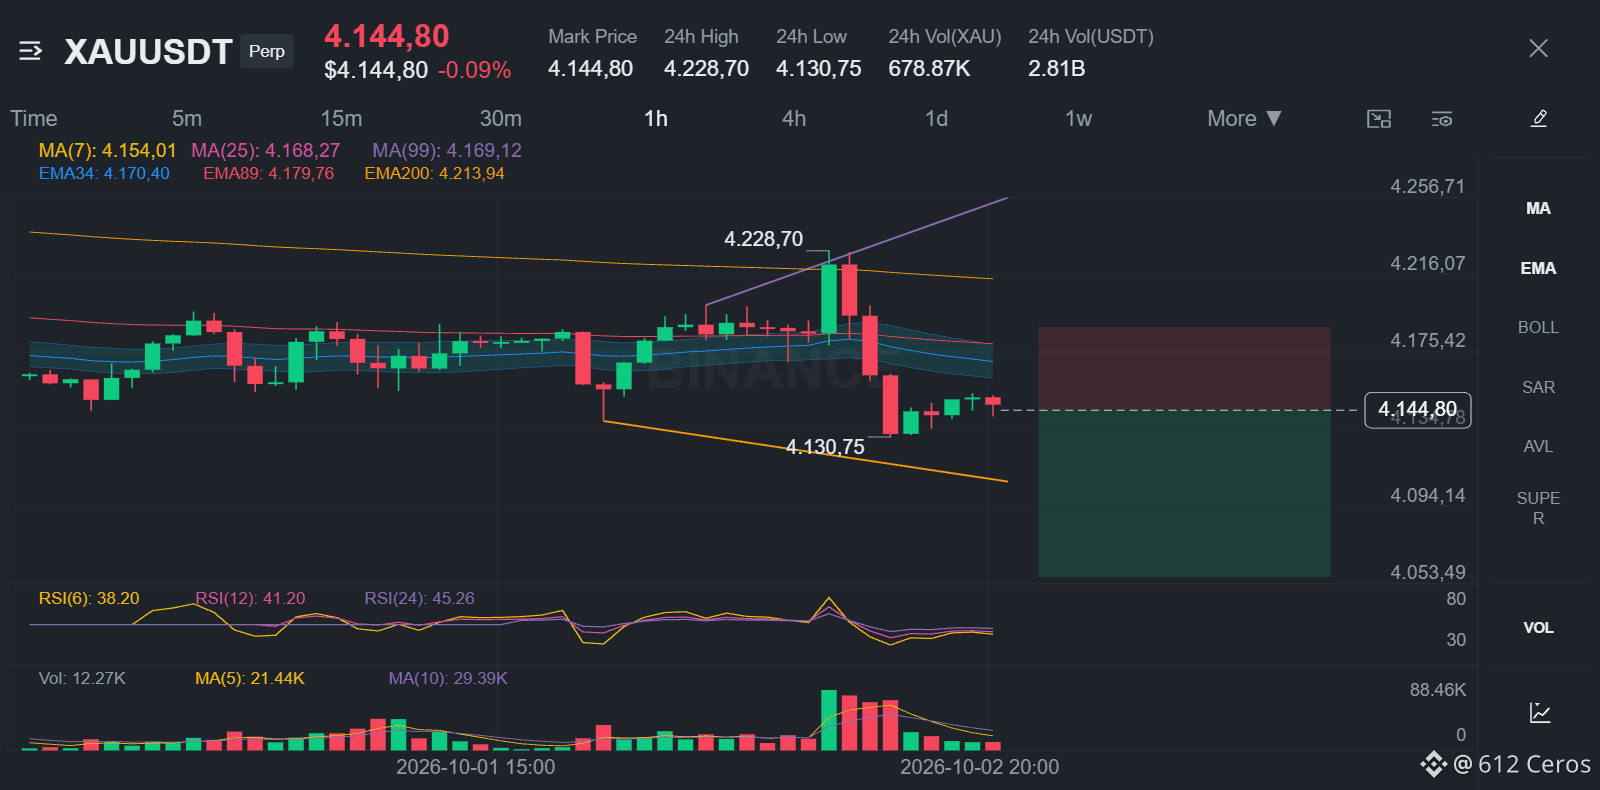
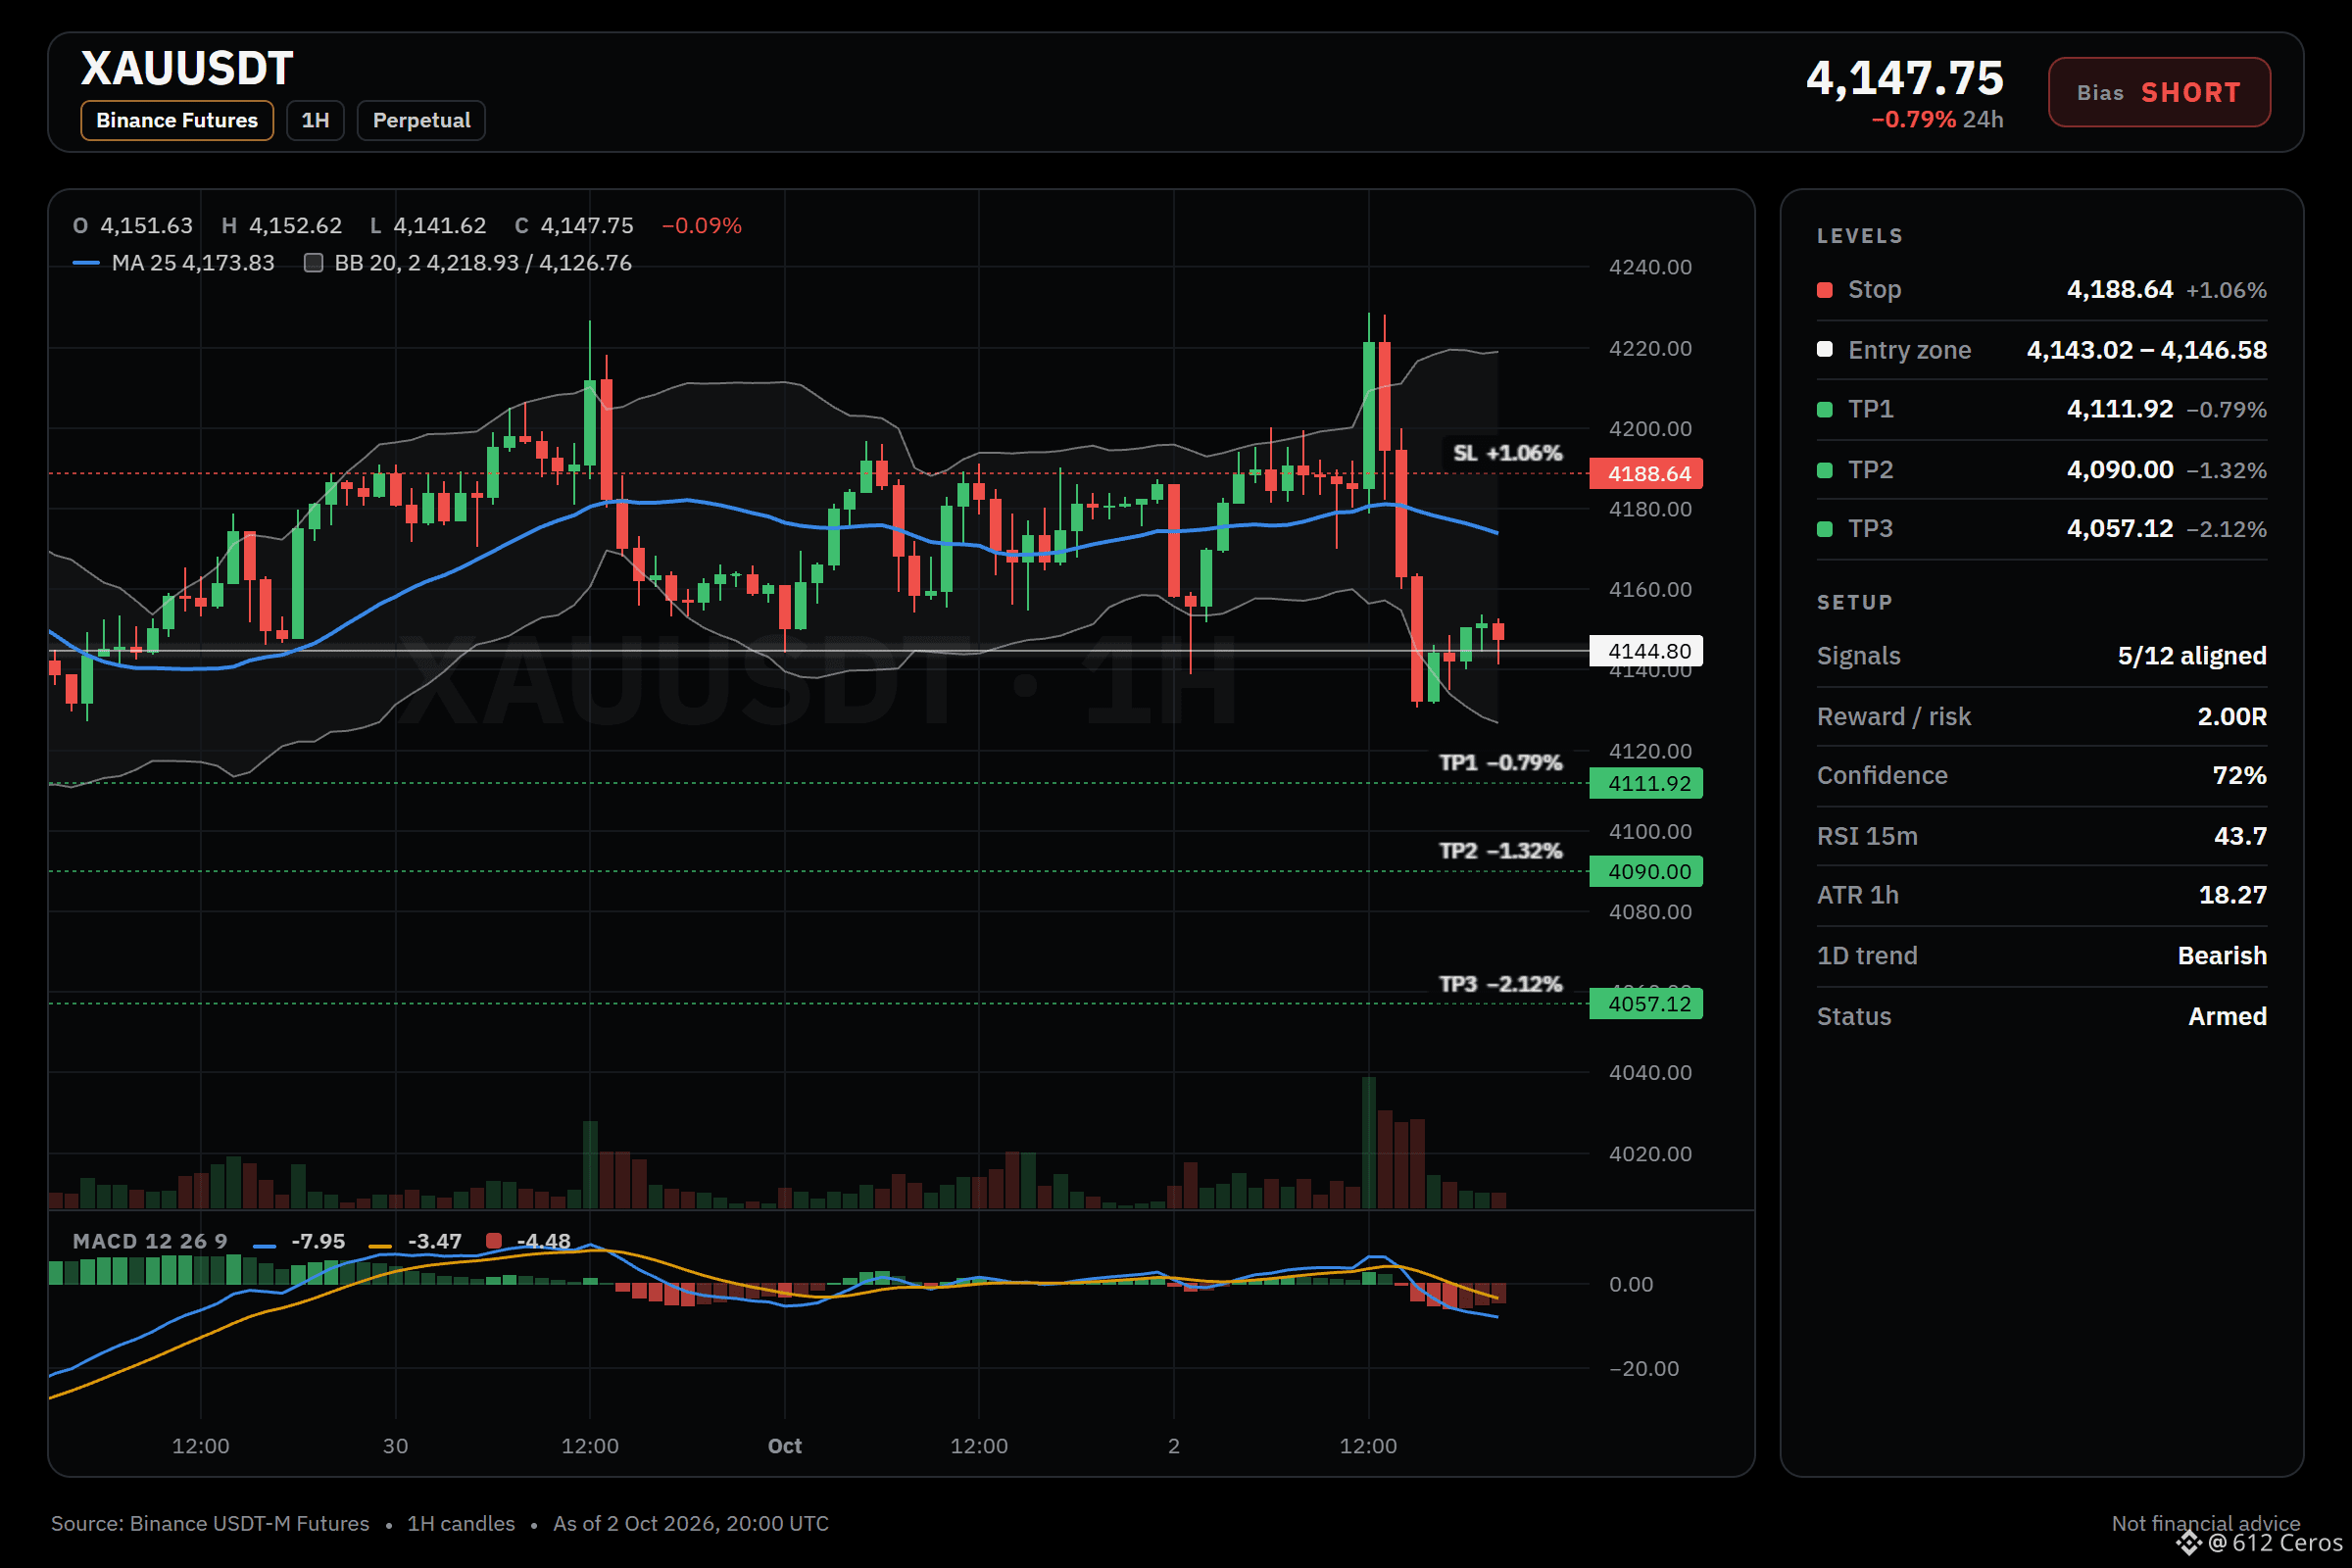
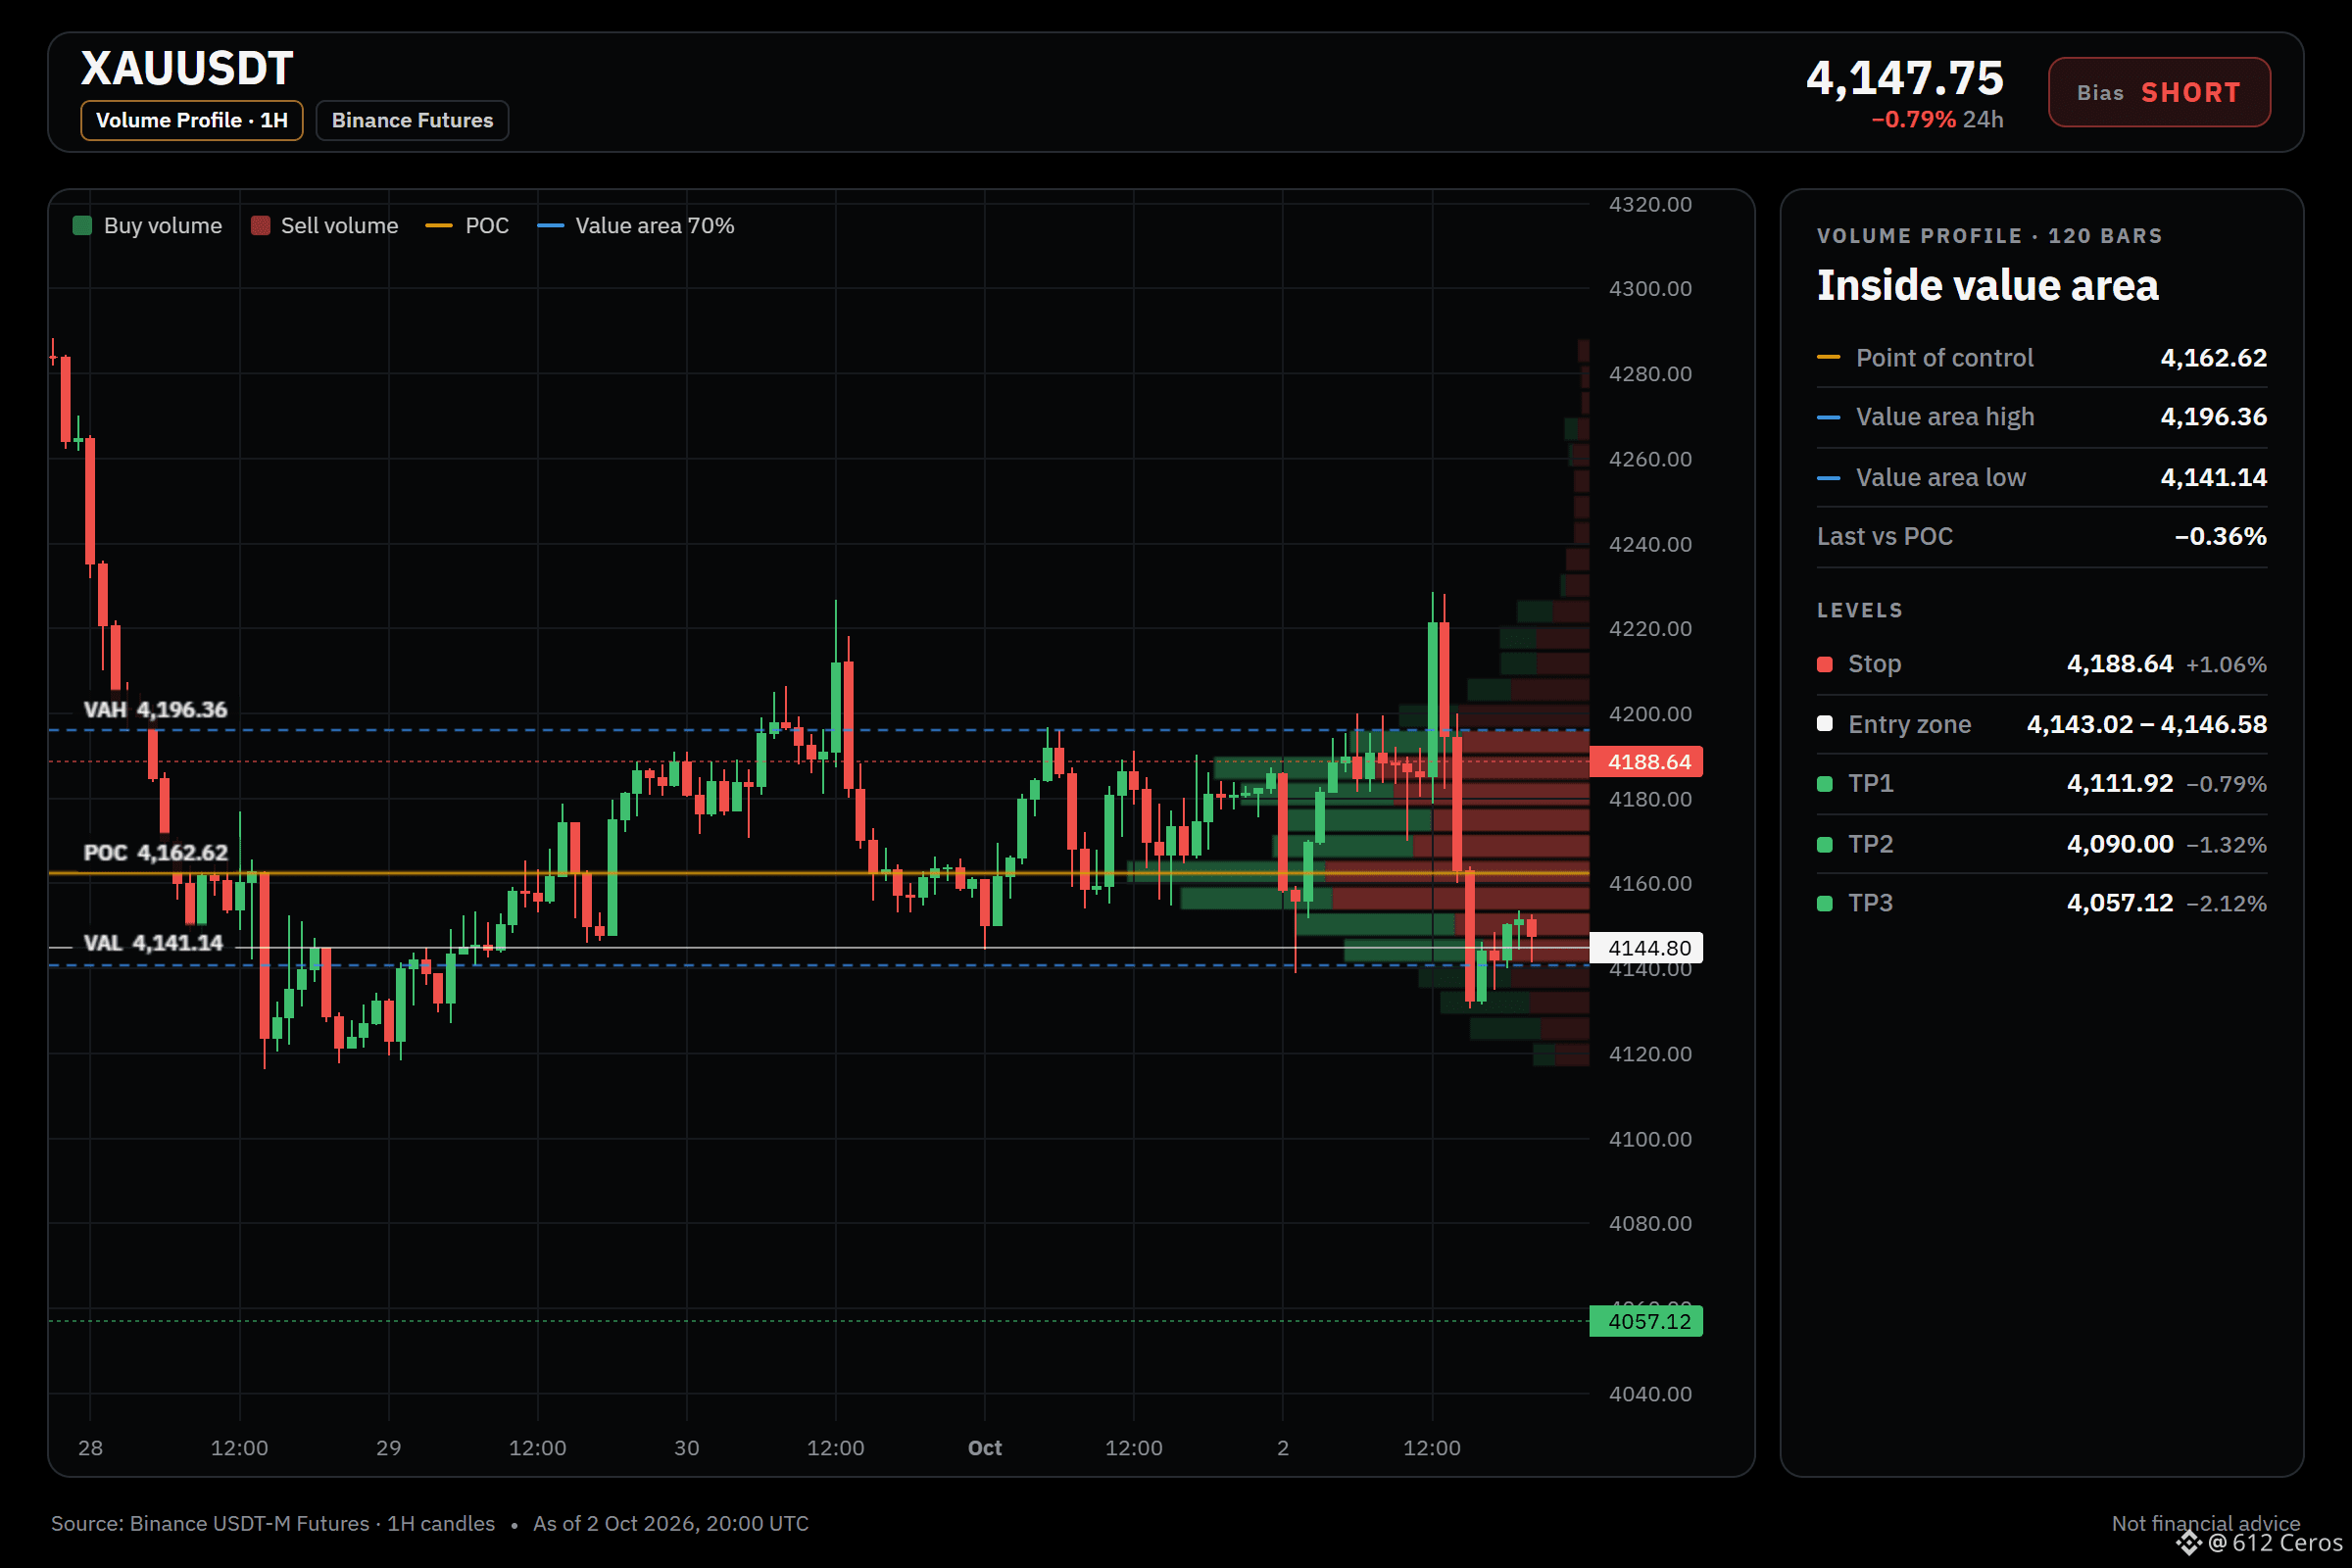
XAU short setup: the levels I'm watching
🔴 SHORT $XAU /USDT: expecting price to go DOWN
Bias: SHORT · Leaning
Entry: 4143.02 – 4146.58
TP1: 4111.92 (-0.8%)
TP2: 4090.00 (-1.3%)
TP3: 4057.12 (-2.1%)
SL: 4188.64 (+1.1%)
Plan: enter only inside the zone, take half at TP1, then move the stop to entry.
Note: moderate conviction only, keep size light.
Why SHORT? Leaning call, 5/12 signals agree, 0 against, 7 undecided.
• Daily trend: price < EMA50 < EMA200, bearish stack → the big-picture trend is down
• 4h trend: price < EMA50 < EMA200, bearish stack → the swing trend is down
• 1h trend: price < EMA50 < EMA200, bearish stack → the short-term trend is down
The reasoning:
The daily trend reads bearish, and 5/12 signals aligned favour the short side. The plan is to work the 4143.02 – 4146.58 zone, scale out at 4111.92 and 4090.00, and stay patient for 4057.12. A move through 4188.64 means the idea is wrong and the stop does its job.
Does XAU tag 4111.92 first, or the stop?
Chart with every level below.
{future}(XAUUSDT)
📲 Want more of my latest signals? Join me here:
[https://app.binance.com/uni-qr/D26WbL9t](https://app.binance.com/uni-qr/D26WbL9t)
⚠️ Personal market analysis only. NFA — manage risk and DYOR.
Educational content, not investment advice or a recommendation to buy, sell, deposit, or withdraw any asset. No paid promotion or referral/affiliate links.
XAU short setup: the levels I'm watching
🔴 SHORT $XAU /USDT: expecting price to go DOWN
Bias: SHORT · Leaning
Entry: 4143.02 – 4146.58
TP1: 4111.92 (-0.8%)
TP2: 4090.00 (-1.3%)
TP3: 4057.12 (-2.1%)
SL: 4188.64 (+1.1%)
Plan: enter only inside the zone, take half at TP1, then move the stop to entry.
Note: moderate conviction only, keep size light.
Why SHORT? Leaning call, 5/12 signals agree, 0 against, 7 undecided.
• Daily trend: price < EMA50 < EMA200, bearish stack → the big-picture trend is down
• 4h trend: price < EMA50 < EMA200, bearish stack → the swing trend is down
• 1h trend: price < EMA50 < EMA200, bearish stack → the short-term trend is down
The reasoning:
The daily trend reads bearish, and 5/12 signals aligned favour the short side. The plan is to work the 4143.02 – 4146.58 zone, scale out at 4111.92 and 4090.00, and stay patient for 4057.12. A move through 4188.64 means the idea is wrong and the stop does its job.
Does XAU tag 4111.92 first, or the stop?
Chart with every level below.
📲 Want more of my latest signals? Join me here:
https://app.binance.com/uni-qr/D26WbL9t
⚠️ Personal market analysis only. NFA — manage risk and DYOR.
Educational content, not investment advice or a recommendation to buy, sell, deposit, or withdraw any asset. No paid promotion or referral/affiliate links.
🔴 SHORT $XAU /USDT: expecting price to go DOWN
Bias: SHORT · Leaning
Entry: 4143.02 – 4146.58
TP1: 4111.92 (-0.8%)
TP2: 4090.00 (-1.3%)
TP3: 4057.12 (-2.1%)
SL: 4188.64 (+1.1%)
Plan: enter only inside the zone, take half at TP1, then move the stop to entry.
Note: moderate conviction only, keep size light.
Why SHORT? Leaning call, 5/12 signals agree, 0 against, 7 undecided.
• Daily trend: price < EMA50 < EMA200, bearish stack → the big-picture trend is down
• 4h trend: price < EMA50 < EMA200, bearish stack → the swing trend is down
• 1h trend: price < EMA50 < EMA200, bearish stack → the short-term trend is down
The reasoning:
The daily trend reads bearish, and 5/12 signals aligned favour the short side. The plan is to work the 4143.02 – 4146.58 zone, scale out at 4111.92 and 4090.00, and stay patient for 4057.12. A move through 4188.64 means the idea is wrong and the stop does its job.
Does XAU tag 4111.92 first, or the stop?
Chart with every level below.
📲 Want more of my latest signals? Join me here:
https://app.binance.com/uni-qr/D26WbL9t
⚠️ Personal market analysis only. NFA — manage risk and DYOR.
Educational content, not investment advice or a recommendation to buy, sell, deposit, or withdraw any asset. No paid promotion or referral/affiliate links.
859
·
--
Baissier
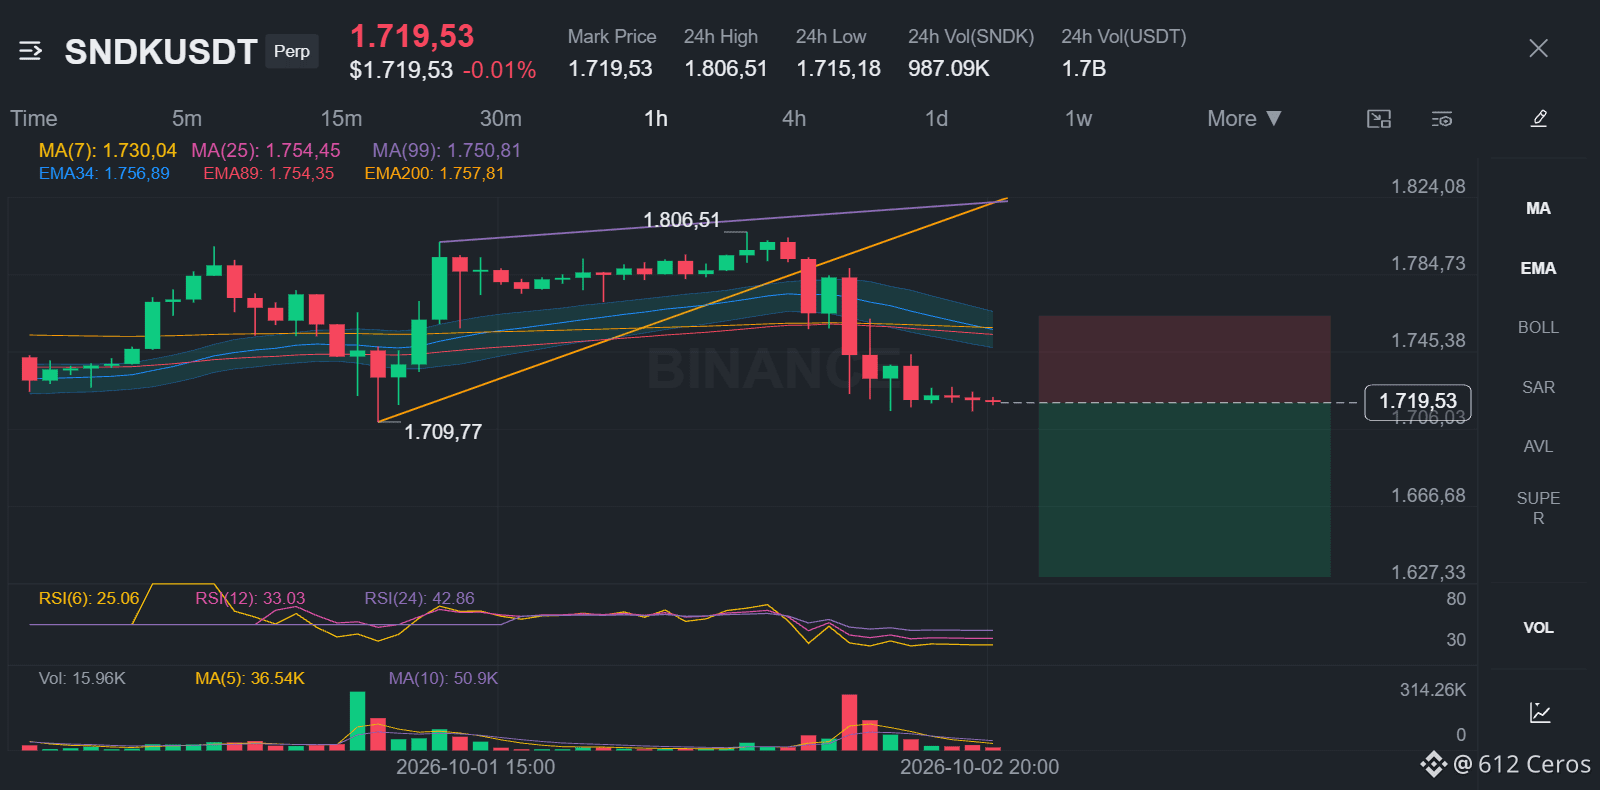
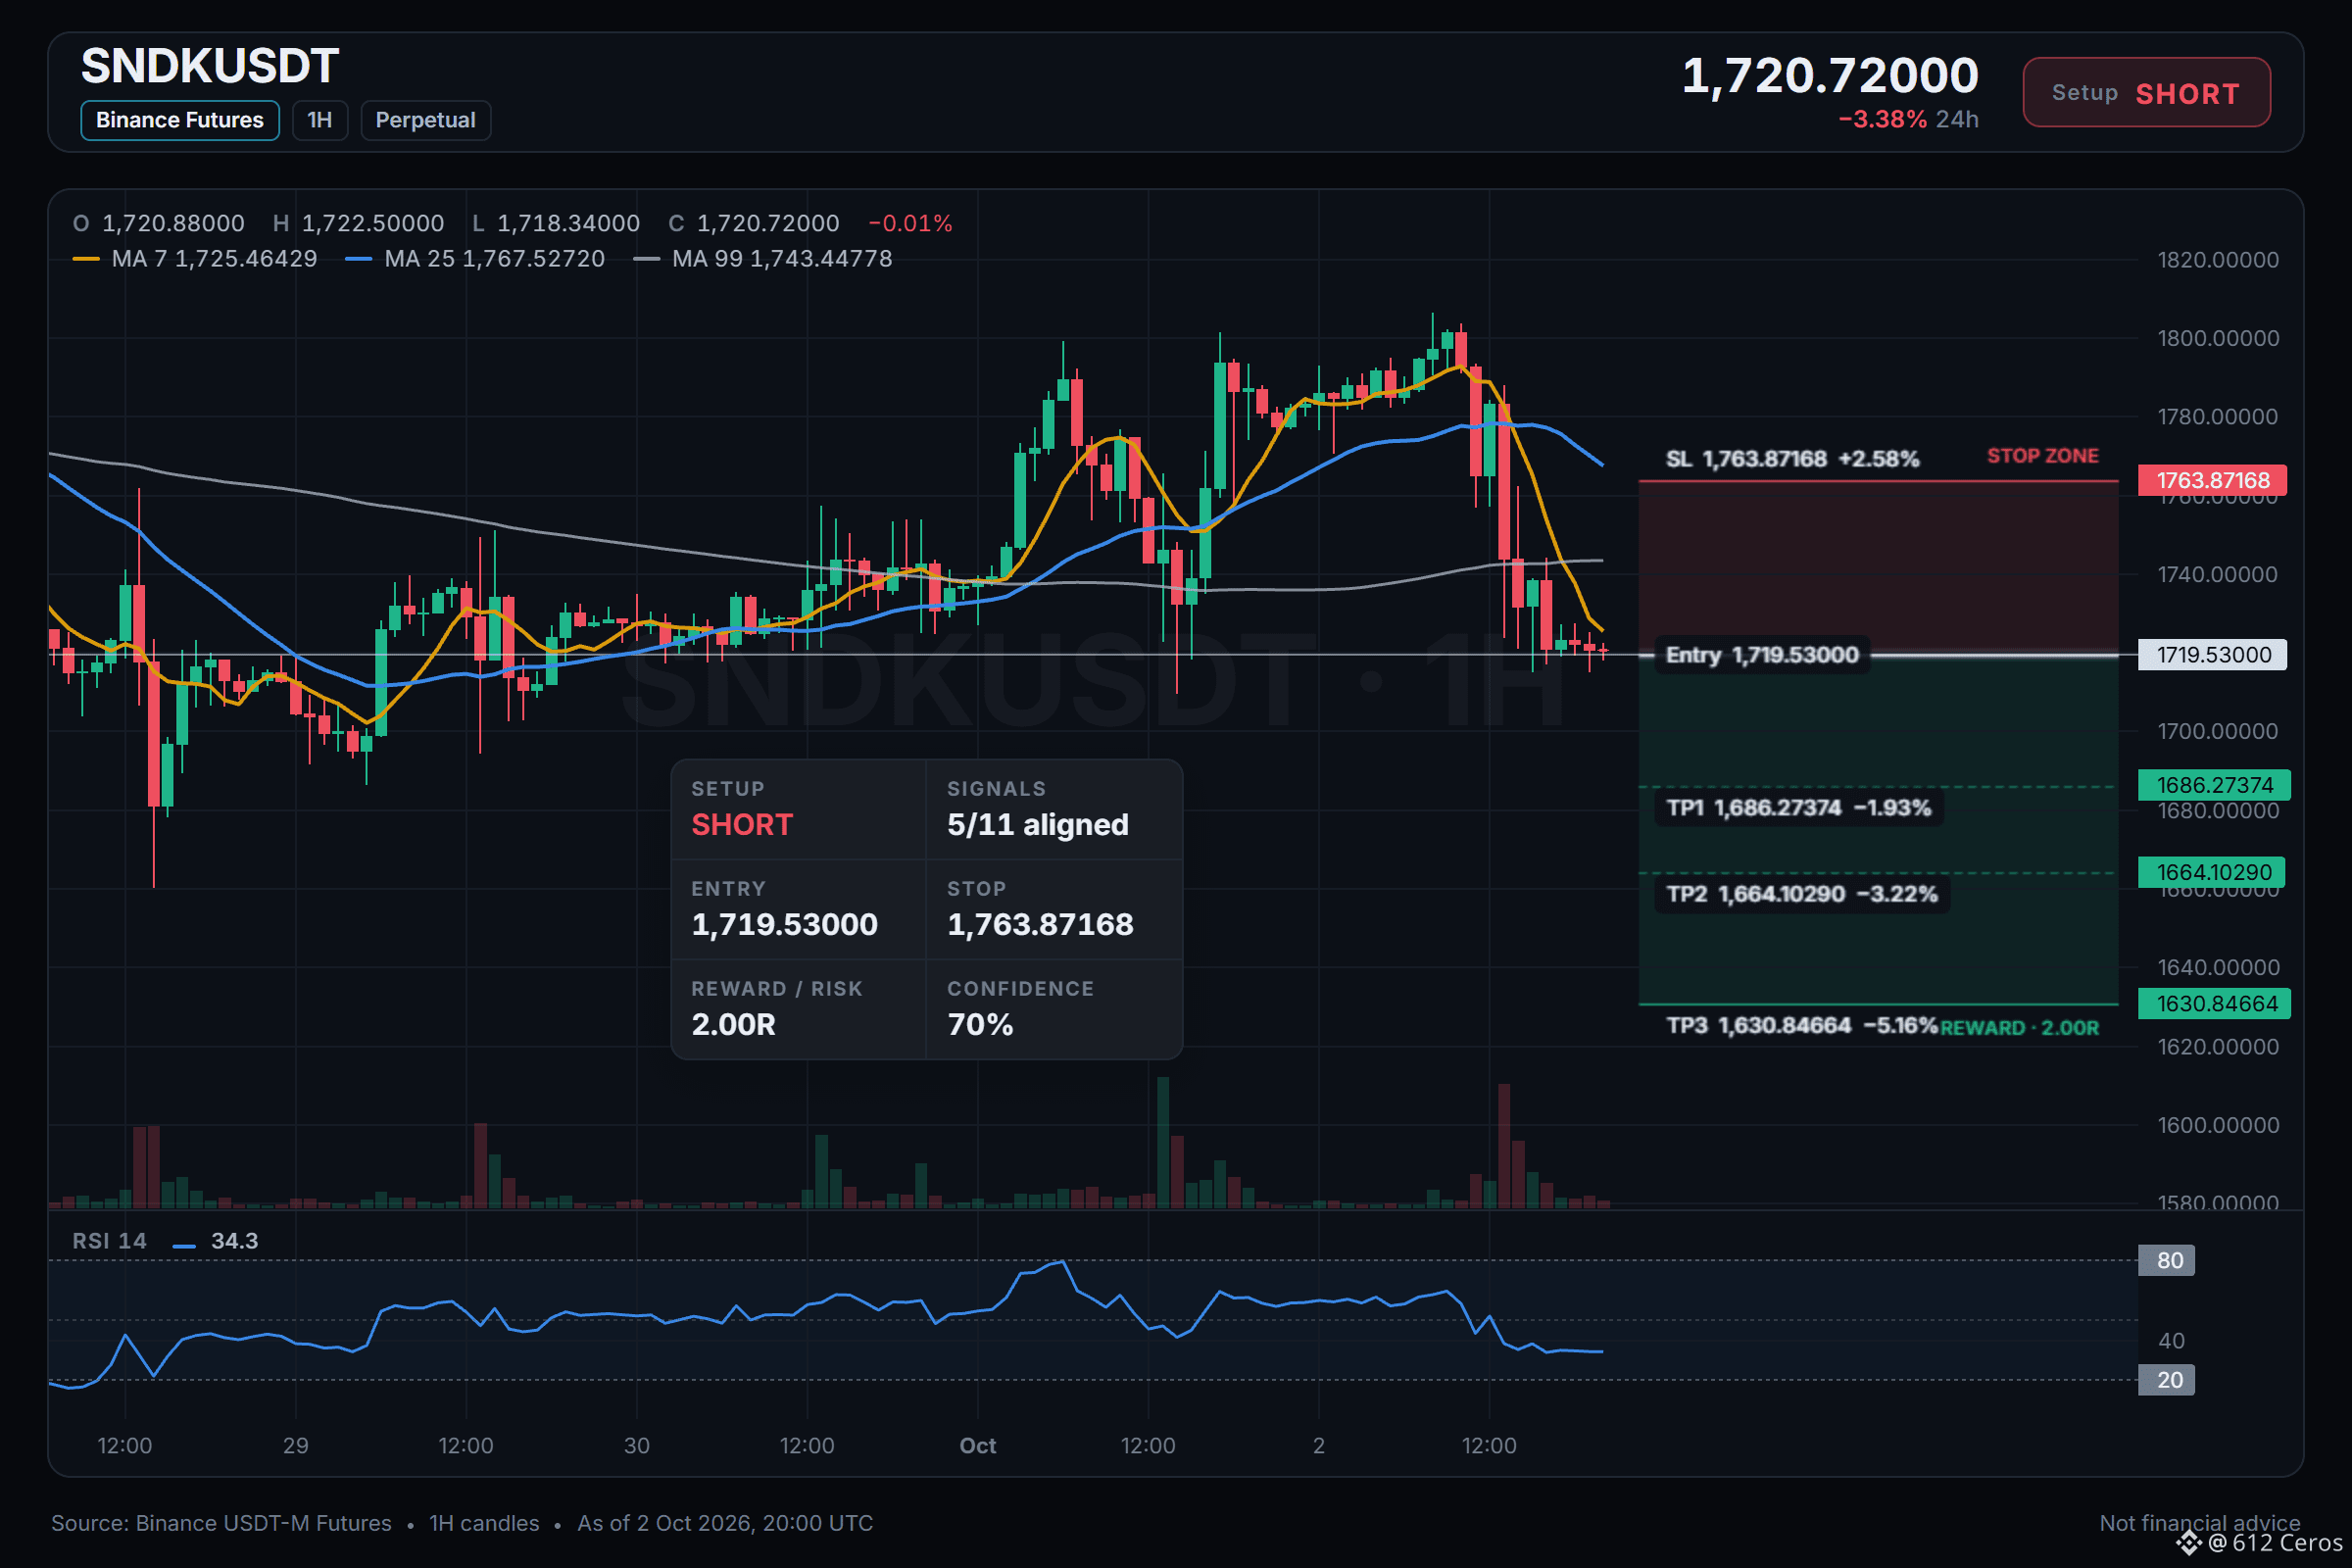
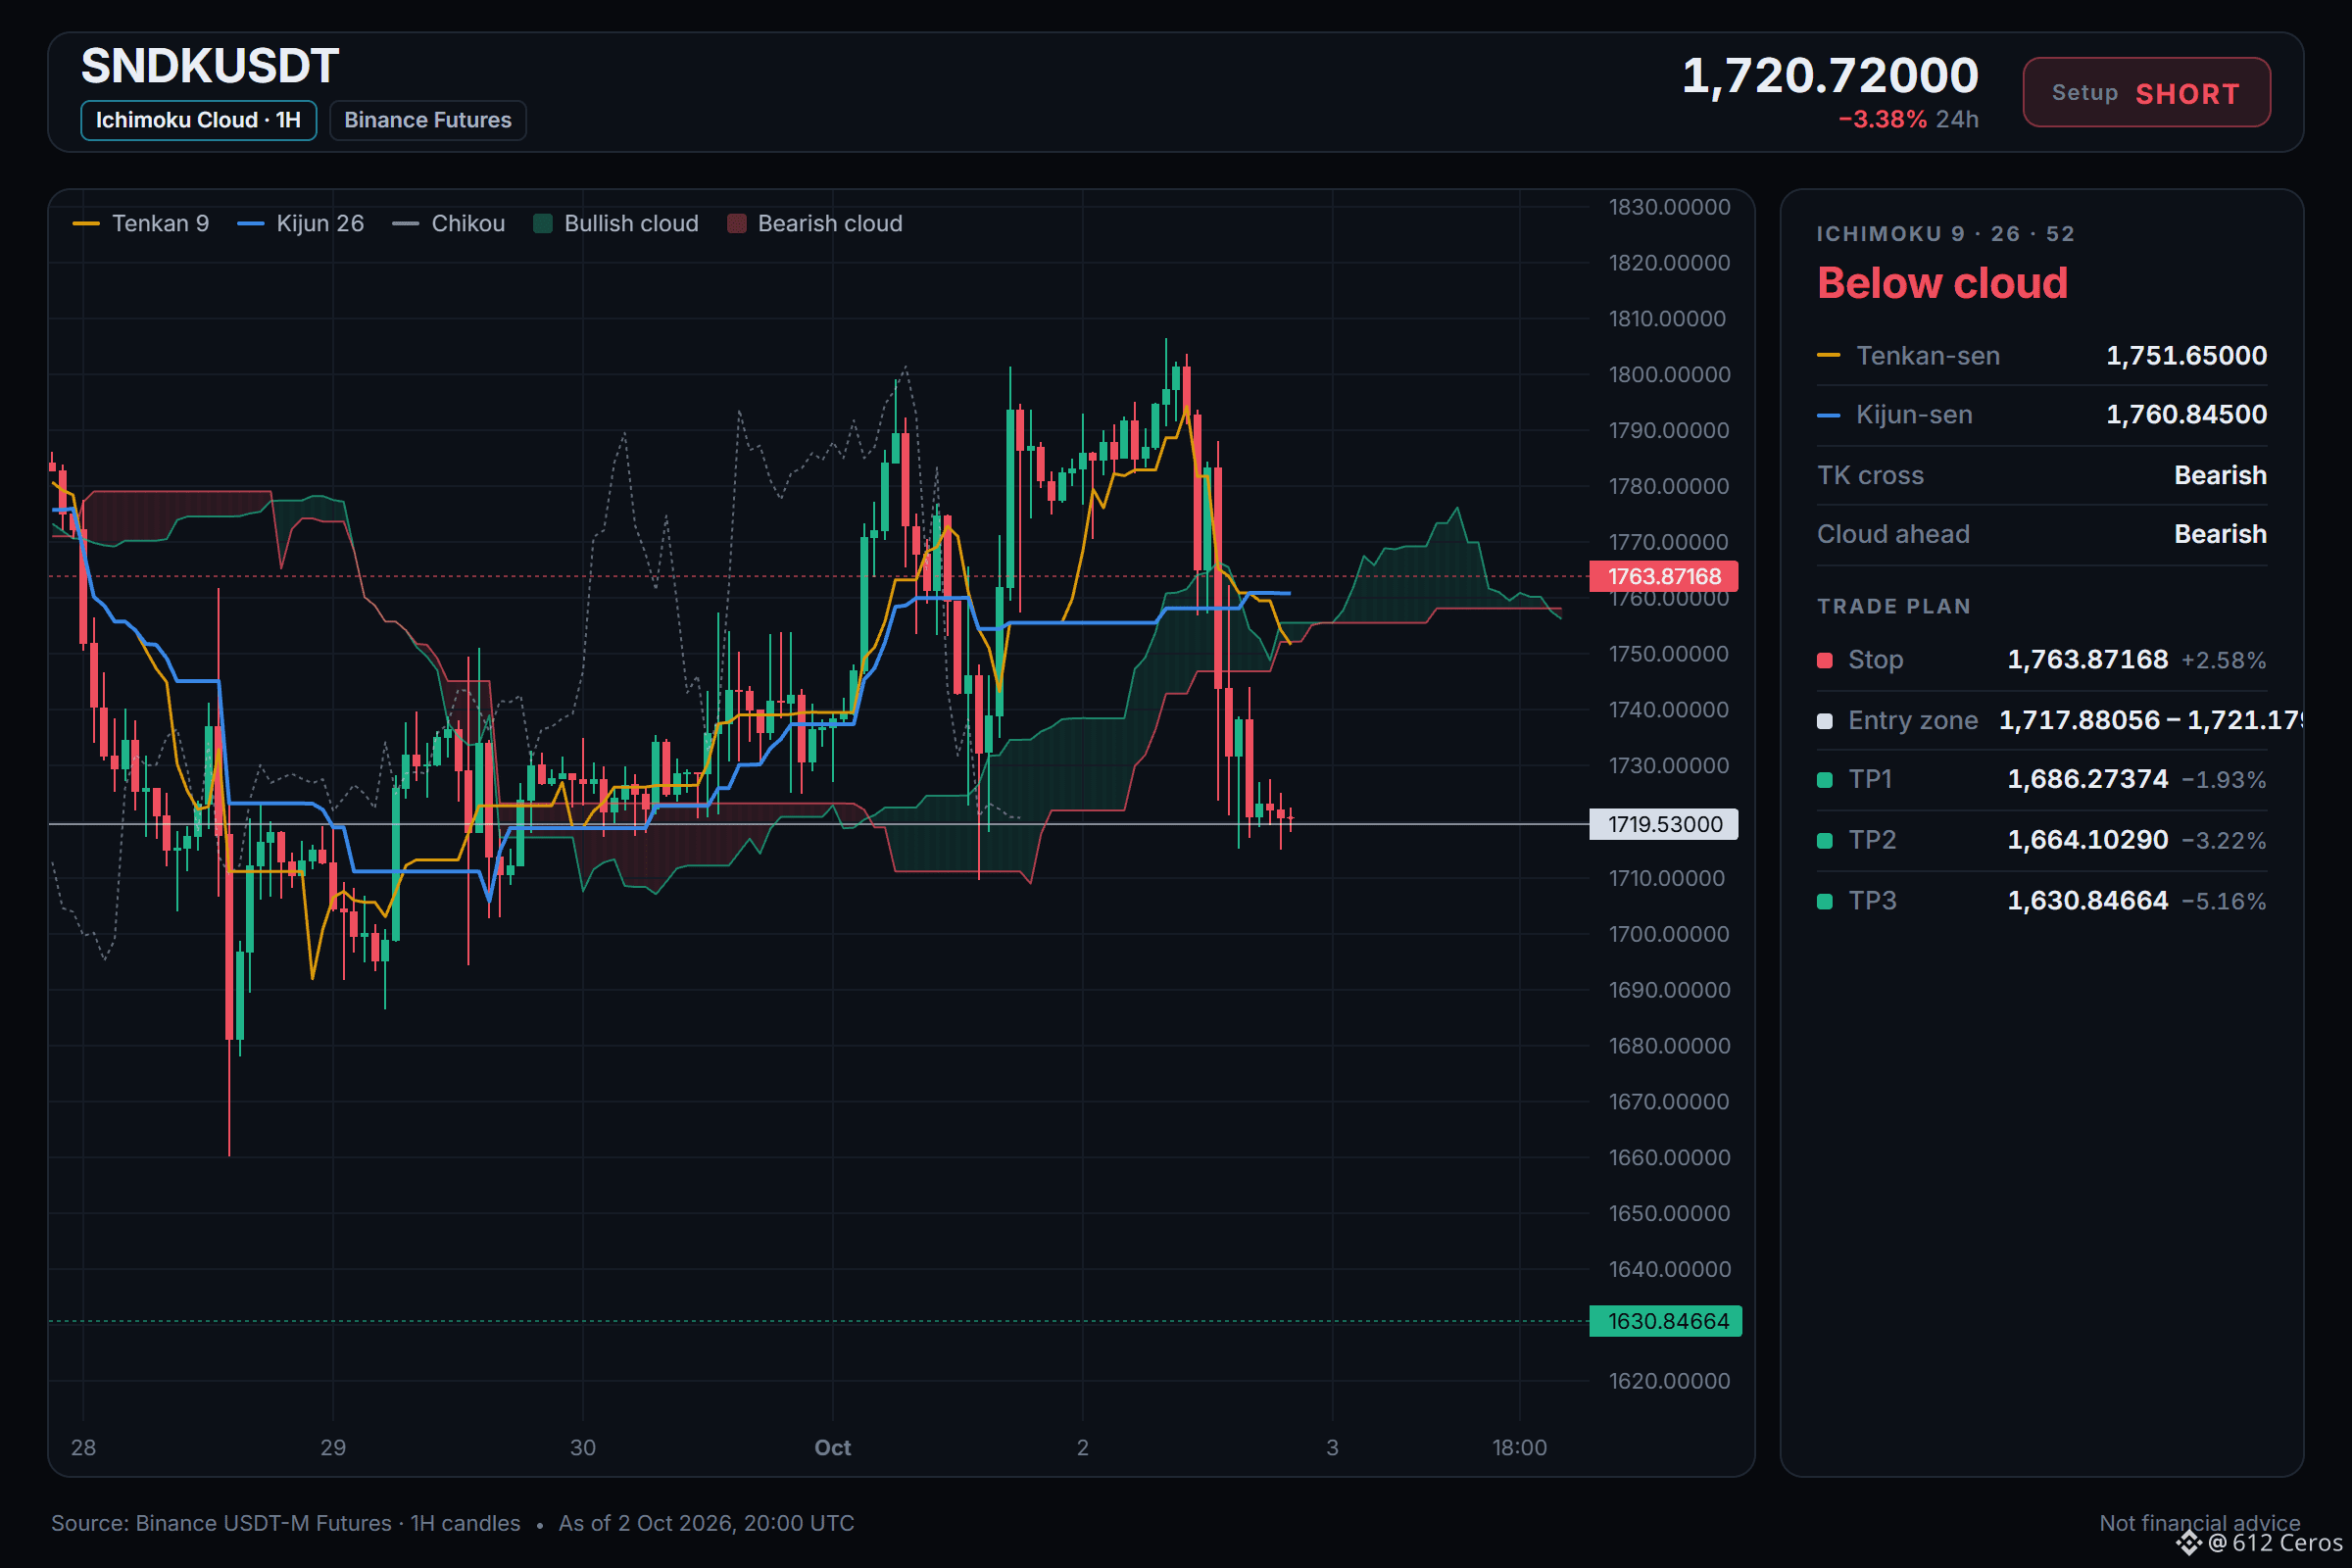
SNDK is sliding in a clear short-term downtrend.
🔴 SHORT $SNDK /USDT: expecting price to go DOWN
Bias: SHORT · Leaning
Entry: 1717.88056 – 1721.17944
TP1: 1686.27374 (-1.9%)
TP2: 1664.10290 (-3.2%)
TP3: 1630.84664 (-5.2%)
SL: 1763.87168 (+2.6%)
Plan: enter only inside the zone, take half at TP1, then move the stop to entry.
Note: moderate conviction only, keep size light.
Why SHORT? What I checked: 5/11 signals agree, 0 against, 6 undecided
• 1h trend: price < EMA50 < EMA200, bearish stack → the short-term trend is down
• Trend strength (ADX/DI, 15m): ADX 39.2 with sellers in control (DI+ 10.2 vs DI− 27.1) → sellers are driving the move
• 4h RSI: 41.6, bearish momentum (below 45) → sellers have the momentum
Watch: The idea is wrong if price reaches the stop at 1763.87168
Net read: The 1h trend is bearish with price below EMA50 and EMA200, but conviction is moderate because some factors disagree and the 4h trend is mixed.
Where would you set your level if you are not shorting at the entry range?
Chart with every level below.
{future}(SNDKUSDT)
📲 Want more of my latest signals? Join me here:
[https://app.binance.com/uni-qr/D26WbL9t](https://app.binance.com/uni-qr/D26WbL9t)
⚠️ Personal market analysis only. NFA — manage risk and DYOR.
Educational content, not investment advice or a recommendation to buy, sell, deposit, or withdraw any asset. No paid promotion or referral/affiliate links.
SNDK is sliding in a clear short-term downtrend.
🔴 SHORT $SNDK /USDT: expecting price to go DOWN
Bias: SHORT · Leaning
Entry: 1717.88056 – 1721.17944
TP1: 1686.27374 (-1.9%)
TP2: 1664.10290 (-3.2%)
TP3: 1630.84664 (-5.2%)
SL: 1763.87168 (+2.6%)
Plan: enter only inside the zone, take half at TP1, then move the stop to entry.
Note: moderate conviction only, keep size light.
Why SHORT? What I checked: 5/11 signals agree, 0 against, 6 undecided
• 1h trend: price < EMA50 < EMA200, bearish stack → the short-term trend is down
• Trend strength (ADX/DI, 15m): ADX 39.2 with sellers in control (DI+ 10.2 vs DI− 27.1) → sellers are driving the move
• 4h RSI: 41.6, bearish momentum (below 45) → sellers have the momentum
Watch: The idea is wrong if price reaches the stop at 1763.87168
Net read: The 1h trend is bearish with price below EMA50 and EMA200, but conviction is moderate because some factors disagree and the 4h trend is mixed.
Where would you set your level if you are not shorting at the entry range?
Chart with every level below.
📲 Want more of my latest signals? Join me here:
https://app.binance.com/uni-qr/D26WbL9t
⚠️ Personal market analysis only. NFA — manage risk and DYOR.
Educational content, not investment advice or a recommendation to buy, sell, deposit, or withdraw any asset. No paid promotion or referral/affiliate links.
🔴 SHORT $SNDK /USDT: expecting price to go DOWN
Bias: SHORT · Leaning
Entry: 1717.88056 – 1721.17944
TP1: 1686.27374 (-1.9%)
TP2: 1664.10290 (-3.2%)
TP3: 1630.84664 (-5.2%)
SL: 1763.87168 (+2.6%)
Plan: enter only inside the zone, take half at TP1, then move the stop to entry.
Note: moderate conviction only, keep size light.
Why SHORT? What I checked: 5/11 signals agree, 0 against, 6 undecided
• 1h trend: price < EMA50 < EMA200, bearish stack → the short-term trend is down
• Trend strength (ADX/DI, 15m): ADX 39.2 with sellers in control (DI+ 10.2 vs DI− 27.1) → sellers are driving the move
• 4h RSI: 41.6, bearish momentum (below 45) → sellers have the momentum
Watch: The idea is wrong if price reaches the stop at 1763.87168
Net read: The 1h trend is bearish with price below EMA50 and EMA200, but conviction is moderate because some factors disagree and the 4h trend is mixed.
Where would you set your level if you are not shorting at the entry range?
Chart with every level below.
📲 Want more of my latest signals? Join me here:
https://app.binance.com/uni-qr/D26WbL9t
⚠️ Personal market analysis only. NFA — manage risk and DYOR.
Educational content, not investment advice or a recommendation to buy, sell, deposit, or withdraw any asset. No paid promotion or referral/affiliate links.
680
·
--
Baissier
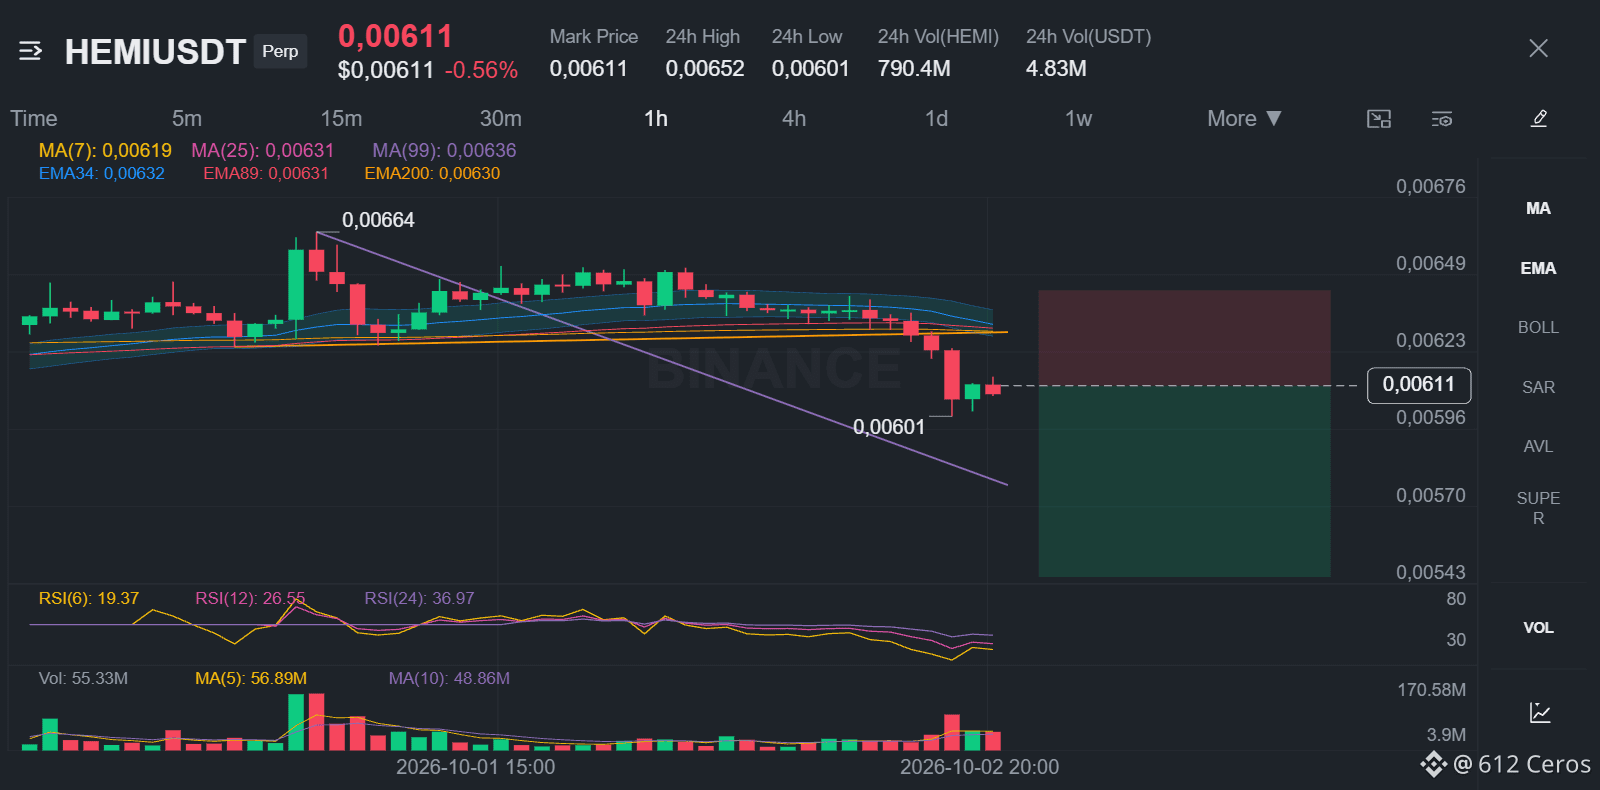
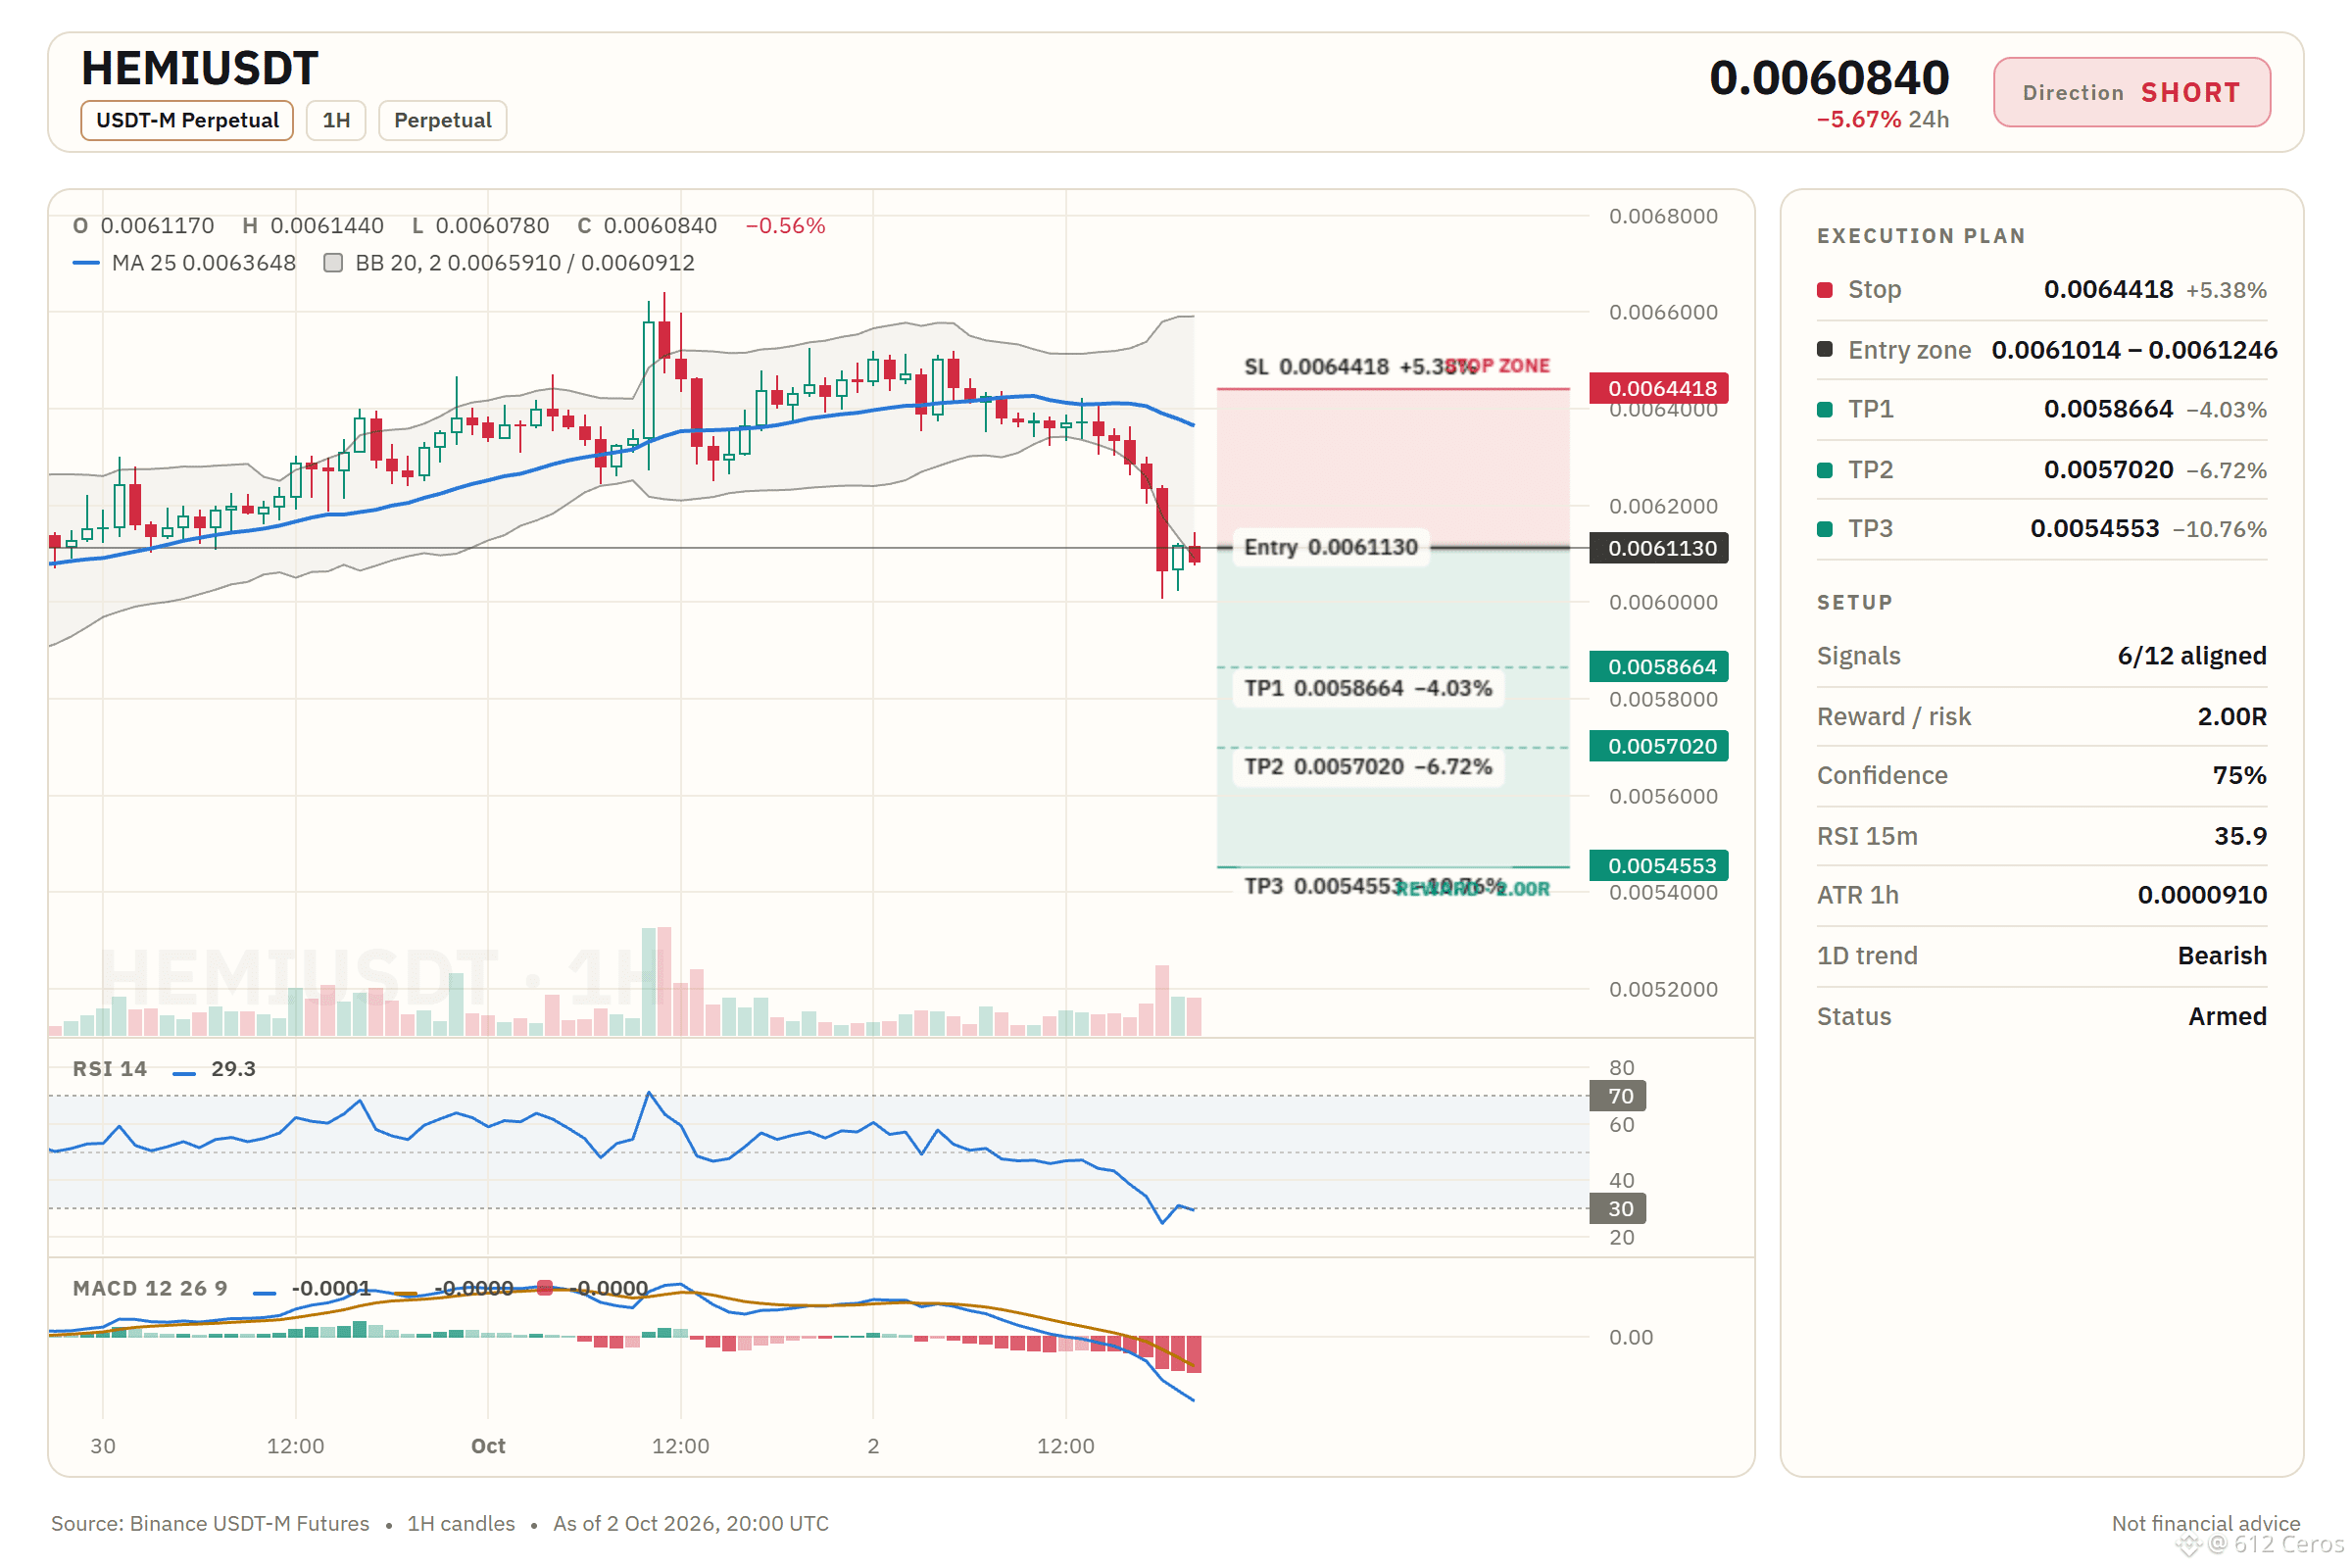
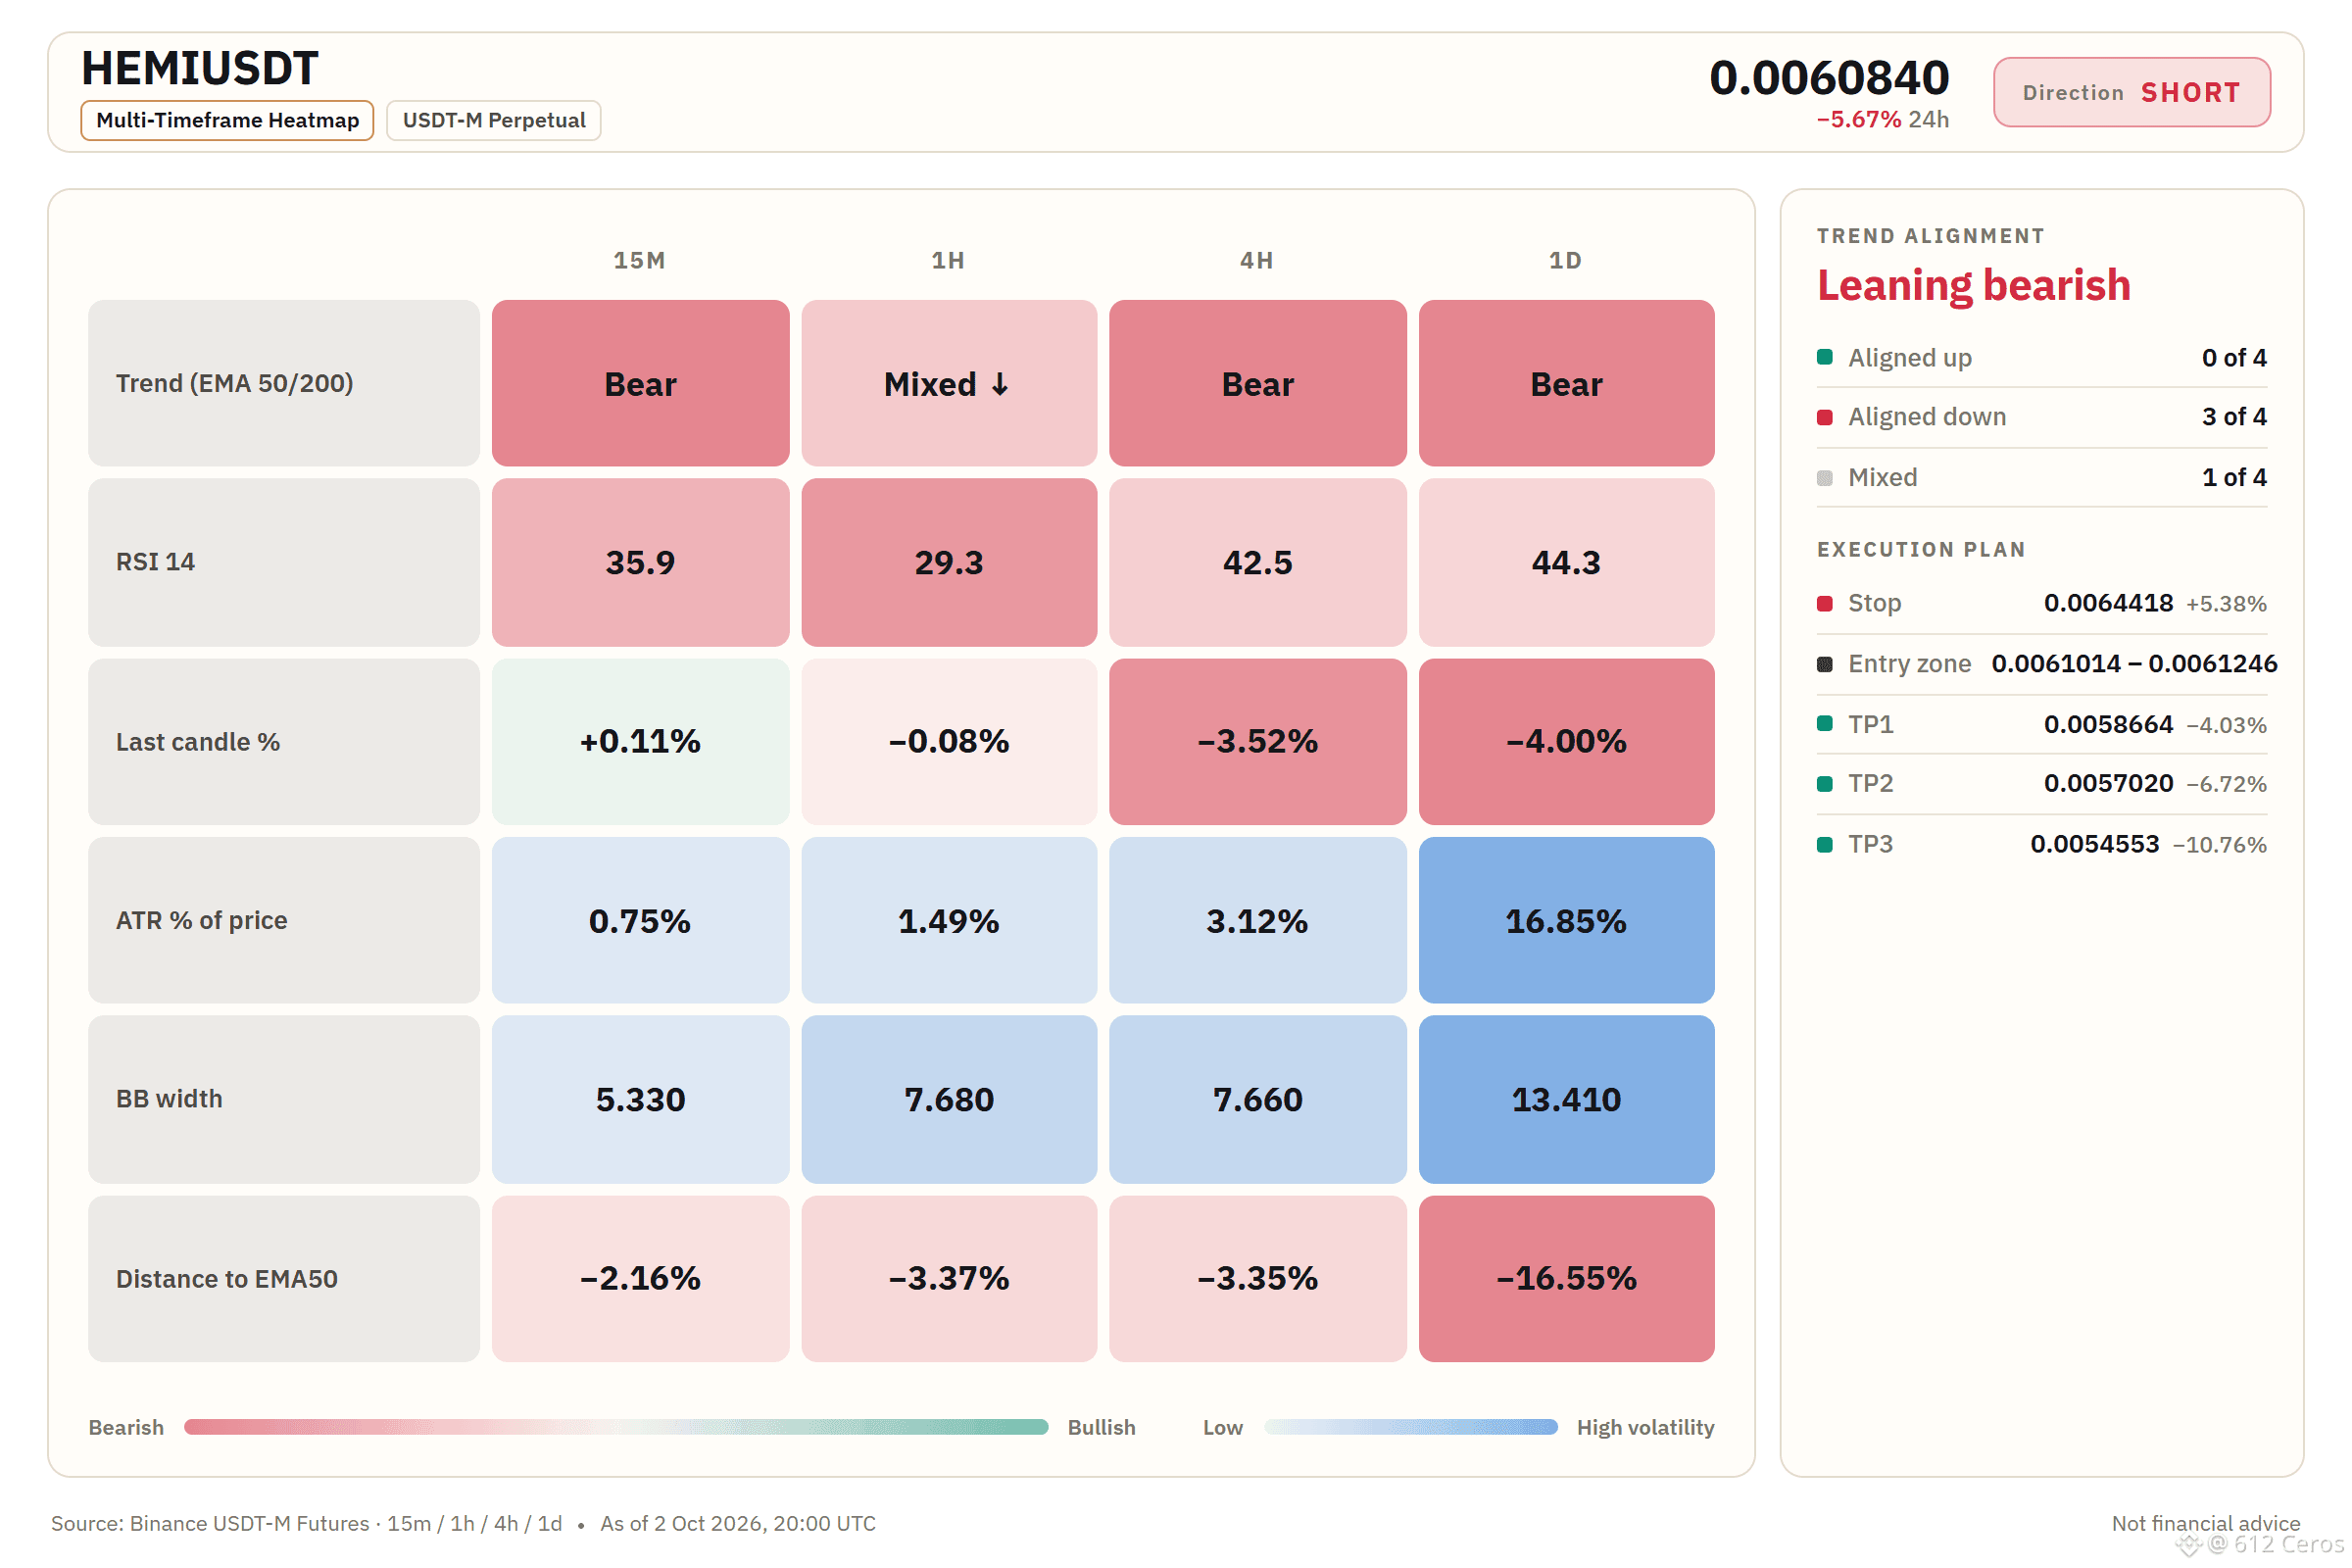
HEMI is sliding in a clear daily downtrend.
🔴 SHORT $HEMI /USDT: expecting price to go DOWN
Bias: SHORT · Strong
Entry: 0.0061014 – 0.0061246
TP1: 0.0058664 (-4.0%)
TP2: 0.0057020 (-6.7%)
TP3: 0.0054553 (-10.8%)
SL: 0.0064418 (+5.4%)
Plan: enter only inside the zone, take half at TP1, then move the stop to entry.
Why SHORT? Strong call, 6/12 signals agree, 0 against, 6 undecided.
• Daily trend: price < EMA50 < EMA200, bearish stack → the big-picture trend is down
• 4h trend: price < EMA50 < EMA200, bearish stack → the swing trend is down
• Trend strength (ADX/DI, 15m): ADX 46.9 with sellers in control (DI+ 9.5 vs DI− 26.6) → sellers are driving the move
Q: Why short when the 1h trend looks mixed?
A: The daily trend and 4h trend both show a bearish stack, so the bigger picture is down.
Q: When is this trade wrong?
A: If price breaks above 0.0064418, the invalidation level, the short thesis is broken.
What level would make you flip to long on HEMI?
Chart with every level below.
{future}(HEMIUSDT)
📲 Want more of my latest signals? Join me here:
[https://app.binance.com/uni-qr/D26WbL9t](https://app.binance.com/uni-qr/D26WbL9t)
⚠️ Personal market analysis only. NFA — manage risk and DYOR.
Educational content, not investment advice or a recommendation to buy, sell, deposit, or withdraw any asset. No paid promotion or referral/affiliate links.
HEMI is sliding in a clear daily downtrend.
🔴 SHORT $HEMI /USDT: expecting price to go DOWN
Bias: SHORT · Strong
Entry: 0.0061014 – 0.0061246
TP1: 0.0058664 (-4.0%)
TP2: 0.0057020 (-6.7%)
TP3: 0.0054553 (-10.8%)
SL: 0.0064418 (+5.4%)
Plan: enter only inside the zone, take half at TP1, then move the stop to entry.
Why SHORT? Strong call, 6/12 signals agree, 0 against, 6 undecided.
• Daily trend: price < EMA50 < EMA200, bearish stack → the big-picture trend is down
• 4h trend: price < EMA50 < EMA200, bearish stack → the swing trend is down
• Trend strength (ADX/DI, 15m): ADX 46.9 with sellers in control (DI+ 9.5 vs DI− 26.6) → sellers are driving the move
Q: Why short when the 1h trend looks mixed?
A: The daily trend and 4h trend both show a bearish stack, so the bigger picture is down.
Q: When is this trade wrong?
A: If price breaks above 0.0064418, the invalidation level, the short thesis is broken.
What level would make you flip to long on HEMI?
Chart with every level below.
📲 Want more of my latest signals? Join me here:
https://app.binance.com/uni-qr/D26WbL9t
⚠️ Personal market analysis only. NFA — manage risk and DYOR.
Educational content, not investment advice or a recommendation to buy, sell, deposit, or withdraw any asset. No paid promotion or referral/affiliate links.
🔴 SHORT $HEMI /USDT: expecting price to go DOWN
Bias: SHORT · Strong
Entry: 0.0061014 – 0.0061246
TP1: 0.0058664 (-4.0%)
TP2: 0.0057020 (-6.7%)
TP3: 0.0054553 (-10.8%)
SL: 0.0064418 (+5.4%)
Plan: enter only inside the zone, take half at TP1, then move the stop to entry.
Why SHORT? Strong call, 6/12 signals agree, 0 against, 6 undecided.
• Daily trend: price < EMA50 < EMA200, bearish stack → the big-picture trend is down
• 4h trend: price < EMA50 < EMA200, bearish stack → the swing trend is down
• Trend strength (ADX/DI, 15m): ADX 46.9 with sellers in control (DI+ 9.5 vs DI− 26.6) → sellers are driving the move
Q: Why short when the 1h trend looks mixed?
A: The daily trend and 4h trend both show a bearish stack, so the bigger picture is down.
Q: When is this trade wrong?
A: If price breaks above 0.0064418, the invalidation level, the short thesis is broken.
What level would make you flip to long on HEMI?
Chart with every level below.
📲 Want more of my latest signals? Join me here:
https://app.binance.com/uni-qr/D26WbL9t
⚠️ Personal market analysis only. NFA — manage risk and DYOR.
Educational content, not investment advice or a recommendation to buy, sell, deposit, or withdraw any asset. No paid promotion or referral/affiliate links.
471
·
--
Baissier
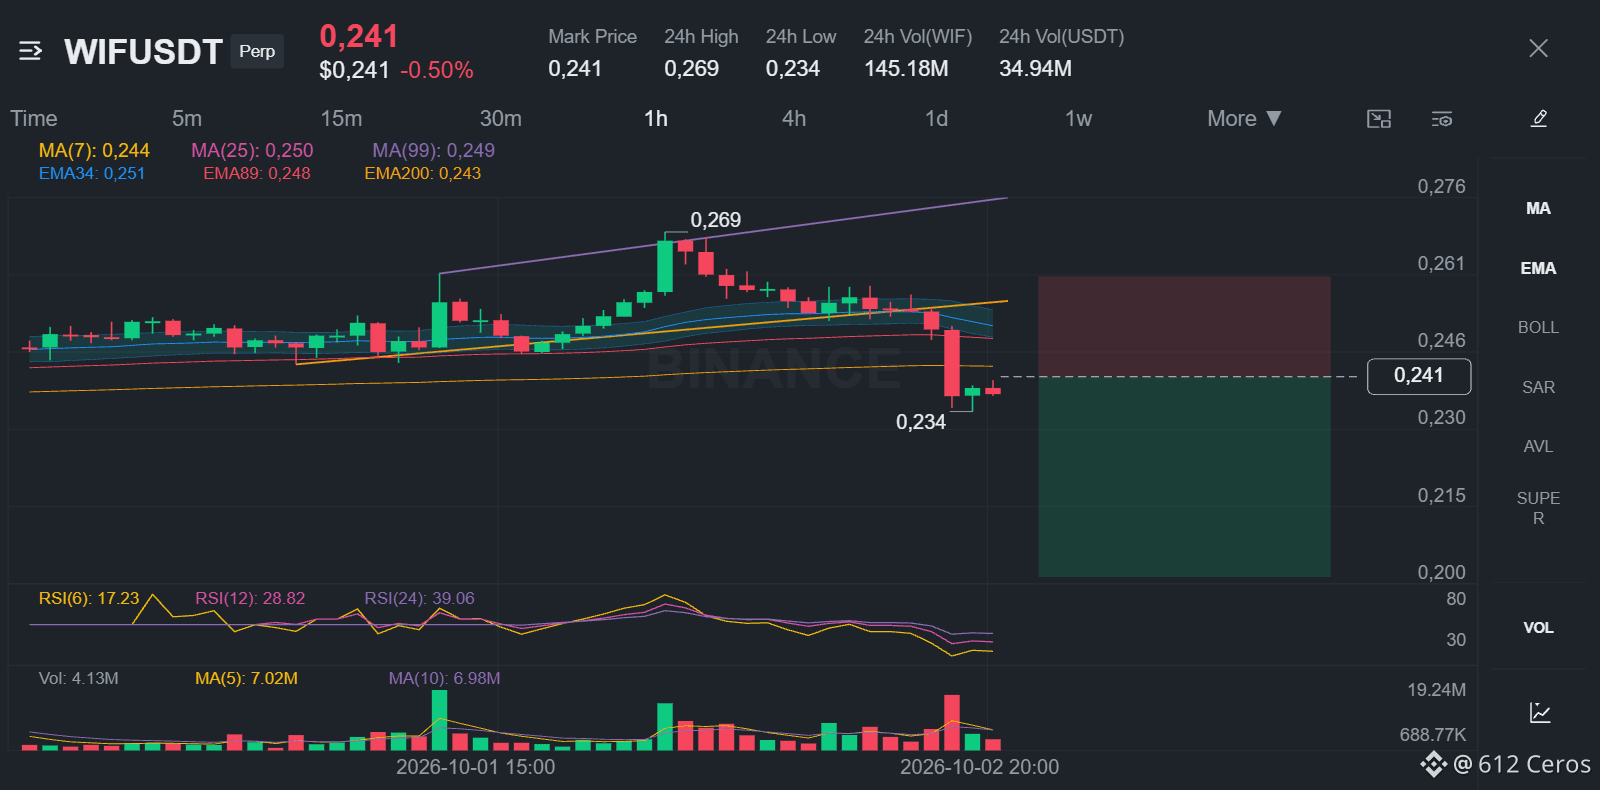
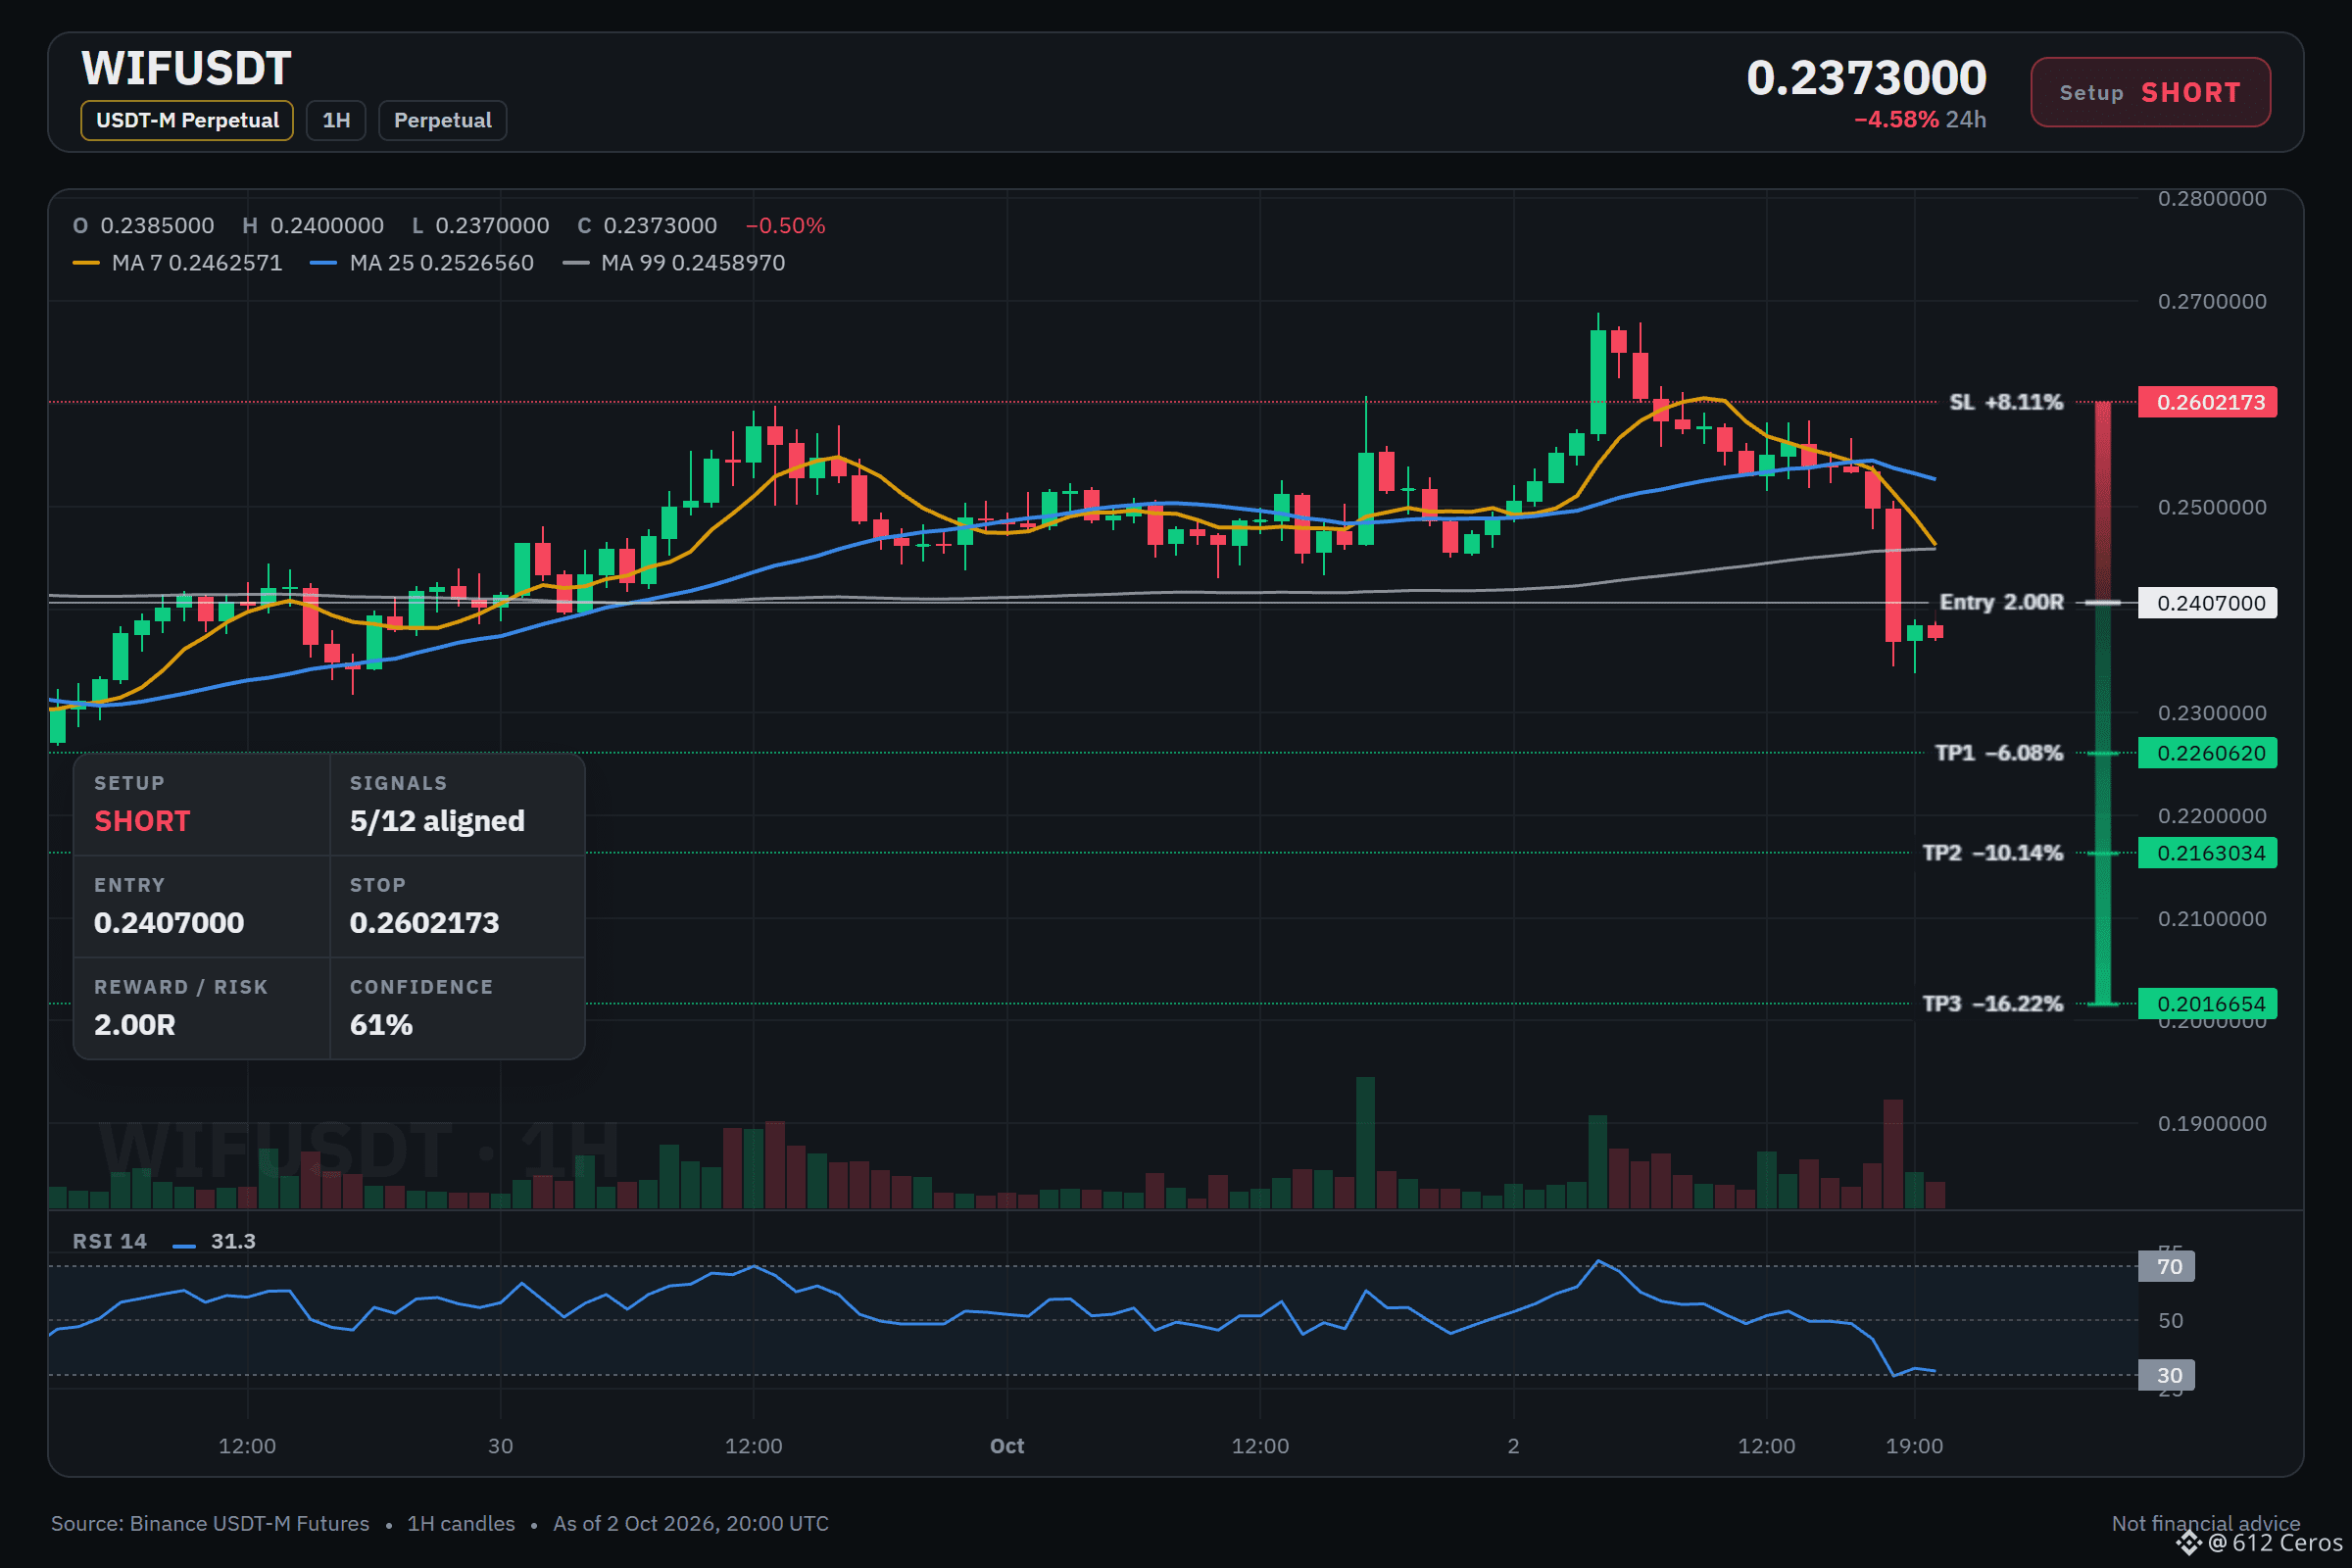
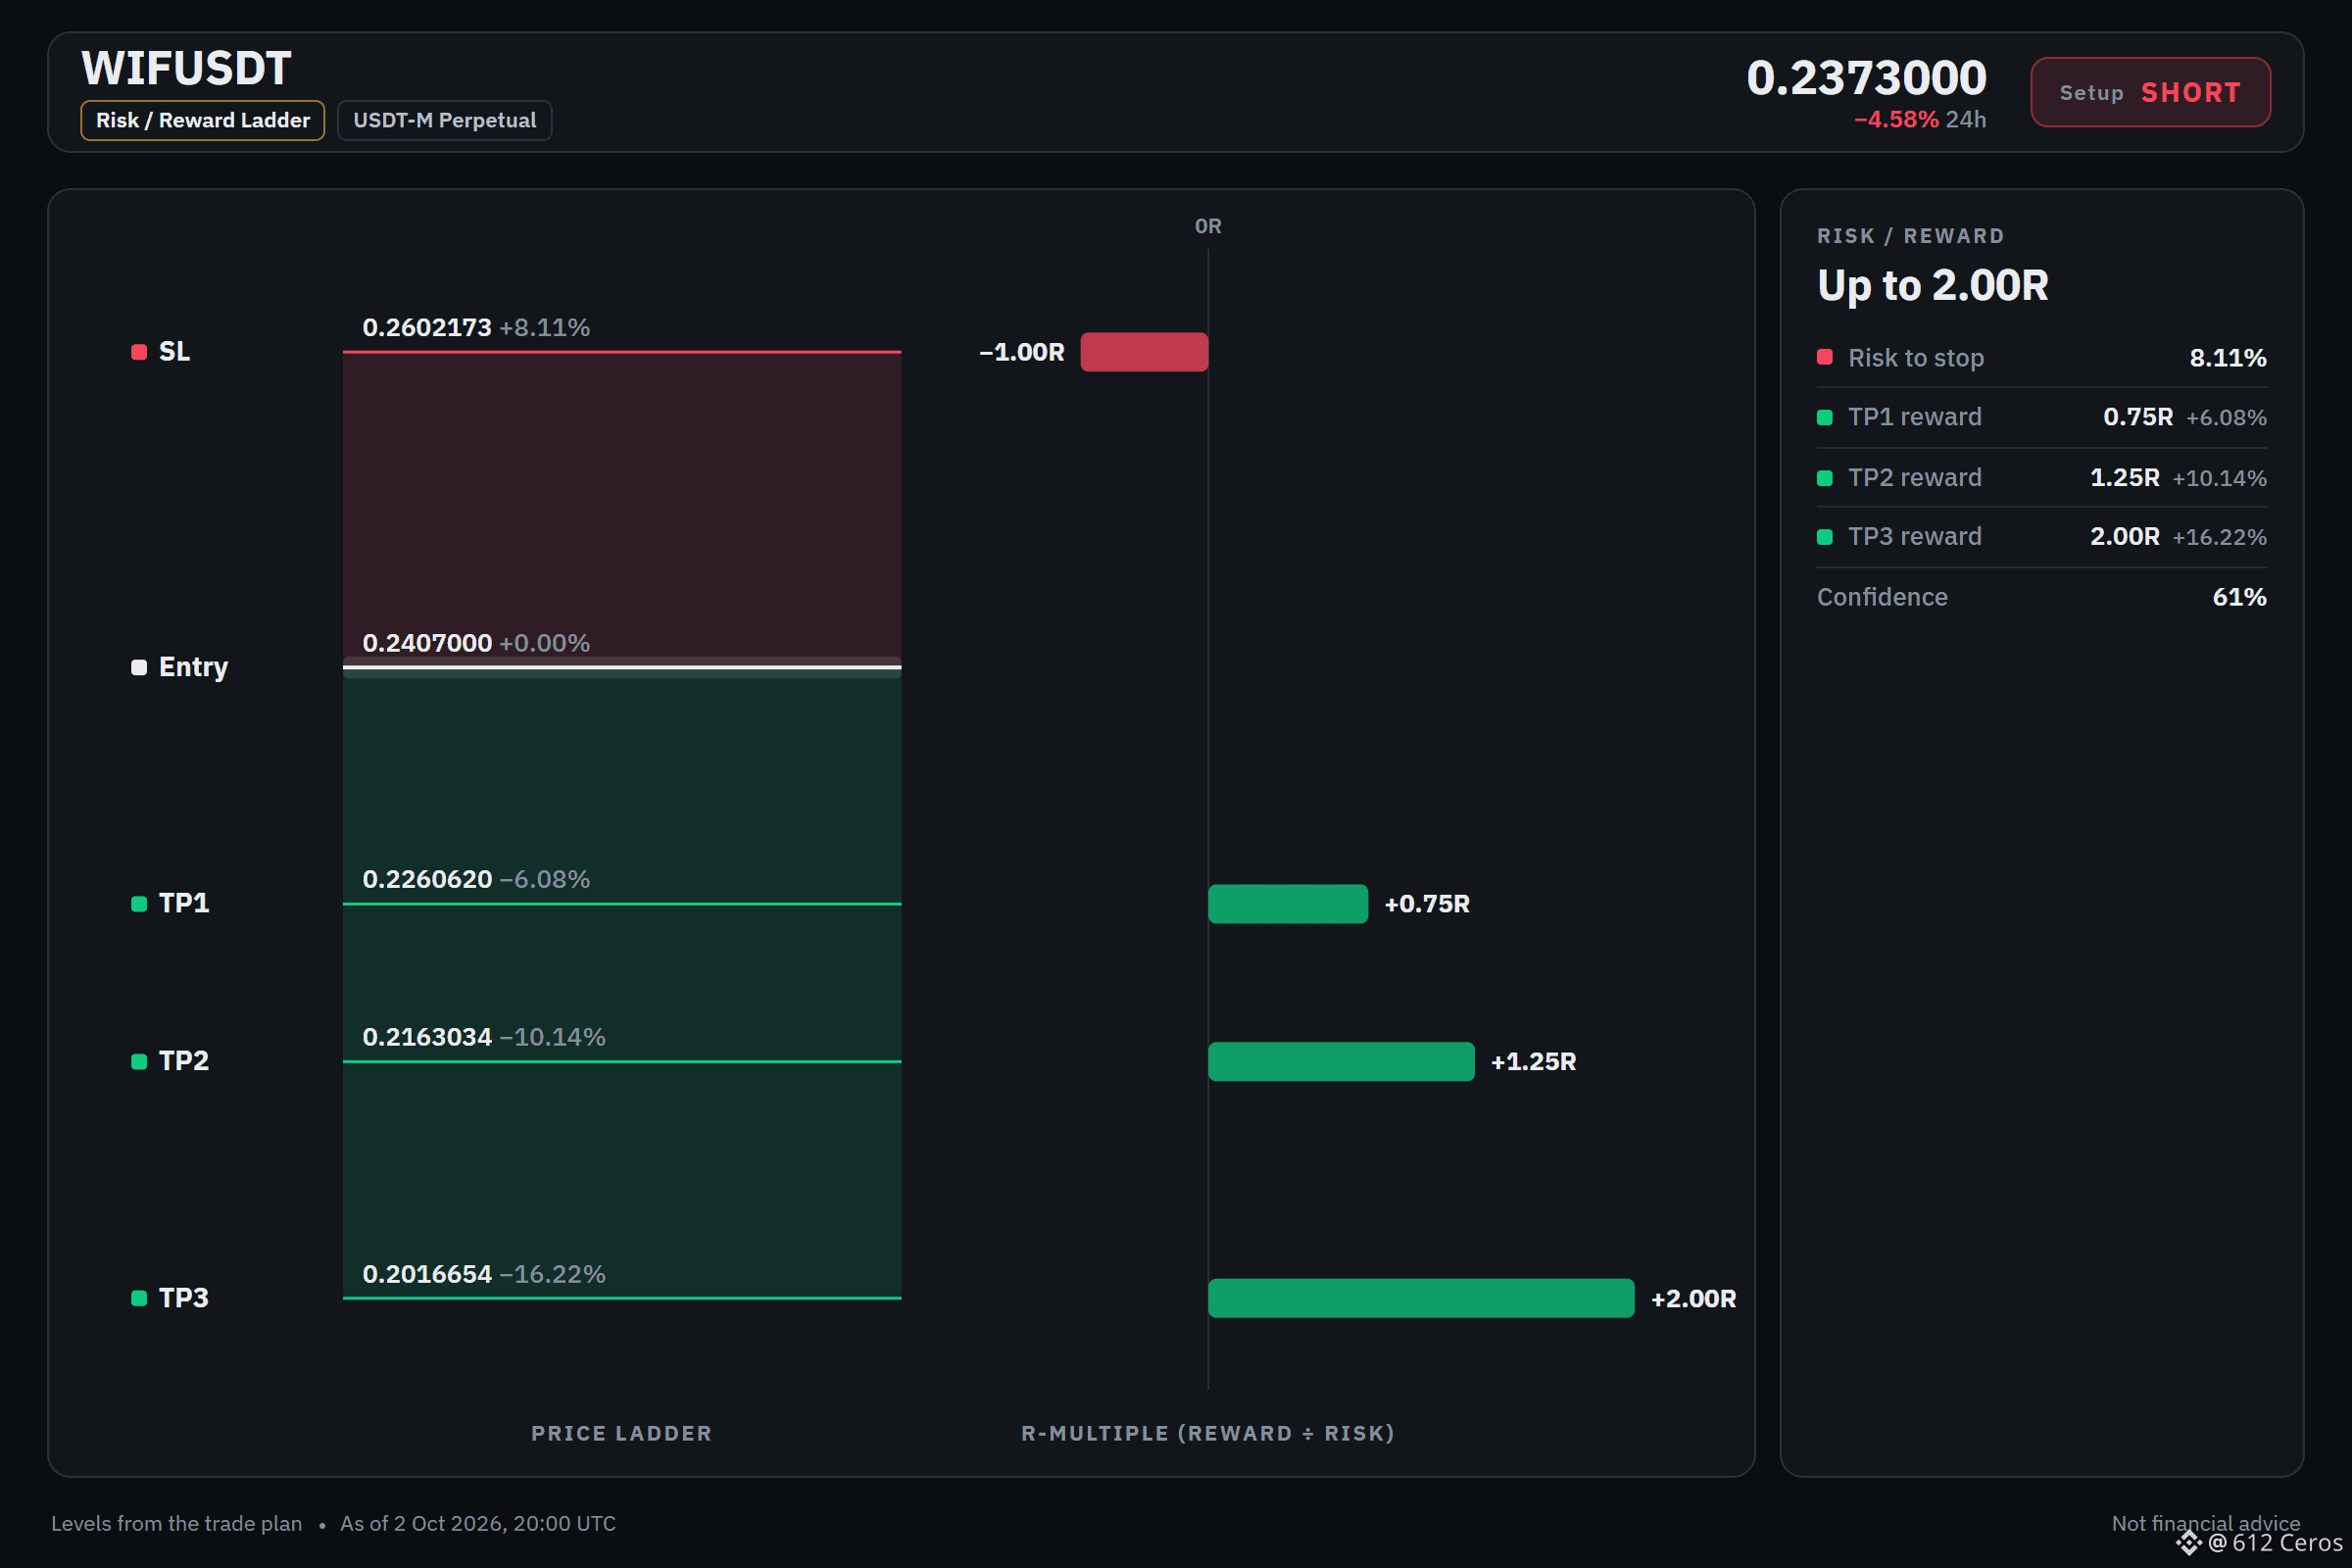
WIF is stretched against a bullish daily trend, inviting a short.
🔴 SHORT $WIF /USDT: expecting price to go DOWN
Bias: SHORT · Leaning
Entry: 0.2400158 – 0.2413842
TP1: 0.2260620 (-6.1%)
TP2: 0.2163034 (-10.1%)
TP3: 0.2016654 (-16.2%)
SL: 0.2602173 (+8.1%)
Plan: enter only inside the zone, take half at TP1, then move the stop to entry.
Caution: counter-trend idea backed by 5 signals only. Smaller size, hard stop.
Why SHORT? Leaning call, 5/12 signals agree, 1 against, 6 undecided.
• Trend strength (ADX/DI, 15m): ADX 37.5 with sellers in control (DI+ 14.9 vs DI− 28.8) → sellers are driving the move
• BTC backdrop: BTC trend is bearish and correlation is 0.65 → BTC is falling and this coin tends to follow
• 4h RSI: 42.9, bearish momentum (below 45) → sellers have the momentum
Risk: Daily trend: price > EMA50 > EMA200, bullish stack → the big-picture trend is up
Bear path:
If price pushes below the 1h price, sellers may extend the move toward the first target, as the 1h RSI shows sellers are in control.
What kills it:
A break above the entry level invalidates the short and proves the daily bullish trend is intact.
What level are you using to defend this short if the daily trend reasserts?
Full setup on the chart below.
{future}(WIFUSDT)
📲 Want more of my latest signals? Join me here:
[https://app.binance.com/uni-qr/D26WbL9t](https://app.binance.com/uni-qr/D26WbL9t)
⚠️ Personal market analysis only. NFA — manage risk and DYOR.
Educational content, not investment advice or a recommendation to buy, sell, deposit, or withdraw any asset. No paid promotion or referral/affiliate links.
WIF is stretched against a bullish daily trend, inviting a short.
🔴 SHORT $WIF /USDT: expecting price to go DOWN
Bias: SHORT · Leaning
Entry: 0.2400158 – 0.2413842
TP1: 0.2260620 (-6.1%)
TP2: 0.2163034 (-10.1%)
TP3: 0.2016654 (-16.2%)
SL: 0.2602173 (+8.1%)
Plan: enter only inside the zone, take half at TP1, then move the stop to entry.
Caution: counter-trend idea backed by 5 signals only. Smaller size, hard stop.
Why SHORT? Leaning call, 5/12 signals agree, 1 against, 6 undecided.
• Trend strength (ADX/DI, 15m): ADX 37.5 with sellers in control (DI+ 14.9 vs DI− 28.8) → sellers are driving the move
• BTC backdrop: BTC trend is bearish and correlation is 0.65 → BTC is falling and this coin tends to follow
• 4h RSI: 42.9, bearish momentum (below 45) → sellers have the momentum
Risk: Daily trend: price > EMA50 > EMA200, bullish stack → the big-picture trend is up
Bear path:
If price pushes below the 1h price, sellers may extend the move toward the first target, as the 1h RSI shows sellers are in control.
What kills it:
A break above the entry level invalidates the short and proves the daily bullish trend is intact.
What level are you using to defend this short if the daily trend reasserts?
Full setup on the chart below.
📲 Want more of my latest signals? Join me here:
https://app.binance.com/uni-qr/D26WbL9t
⚠️ Personal market analysis only. NFA — manage risk and DYOR.
Educational content, not investment advice or a recommendation to buy, sell, deposit, or withdraw any asset. No paid promotion or referral/affiliate links.
🔴 SHORT $WIF /USDT: expecting price to go DOWN
Bias: SHORT · Leaning
Entry: 0.2400158 – 0.2413842
TP1: 0.2260620 (-6.1%)
TP2: 0.2163034 (-10.1%)
TP3: 0.2016654 (-16.2%)
SL: 0.2602173 (+8.1%)
Plan: enter only inside the zone, take half at TP1, then move the stop to entry.
Caution: counter-trend idea backed by 5 signals only. Smaller size, hard stop.
Why SHORT? Leaning call, 5/12 signals agree, 1 against, 6 undecided.
• Trend strength (ADX/DI, 15m): ADX 37.5 with sellers in control (DI+ 14.9 vs DI− 28.8) → sellers are driving the move
• BTC backdrop: BTC trend is bearish and correlation is 0.65 → BTC is falling and this coin tends to follow
• 4h RSI: 42.9, bearish momentum (below 45) → sellers have the momentum
Risk: Daily trend: price > EMA50 > EMA200, bullish stack → the big-picture trend is up
Bear path:
If price pushes below the 1h price, sellers may extend the move toward the first target, as the 1h RSI shows sellers are in control.
What kills it:
A break above the entry level invalidates the short and proves the daily bullish trend is intact.
What level are you using to defend this short if the daily trend reasserts?
Full setup on the chart below.
📲 Want more of my latest signals? Join me here:
https://app.binance.com/uni-qr/D26WbL9t
⚠️ Personal market analysis only. NFA — manage risk and DYOR.
Educational content, not investment advice or a recommendation to buy, sell, deposit, or withdraw any asset. No paid promotion or referral/affiliate links.
399
·
--
Baissier
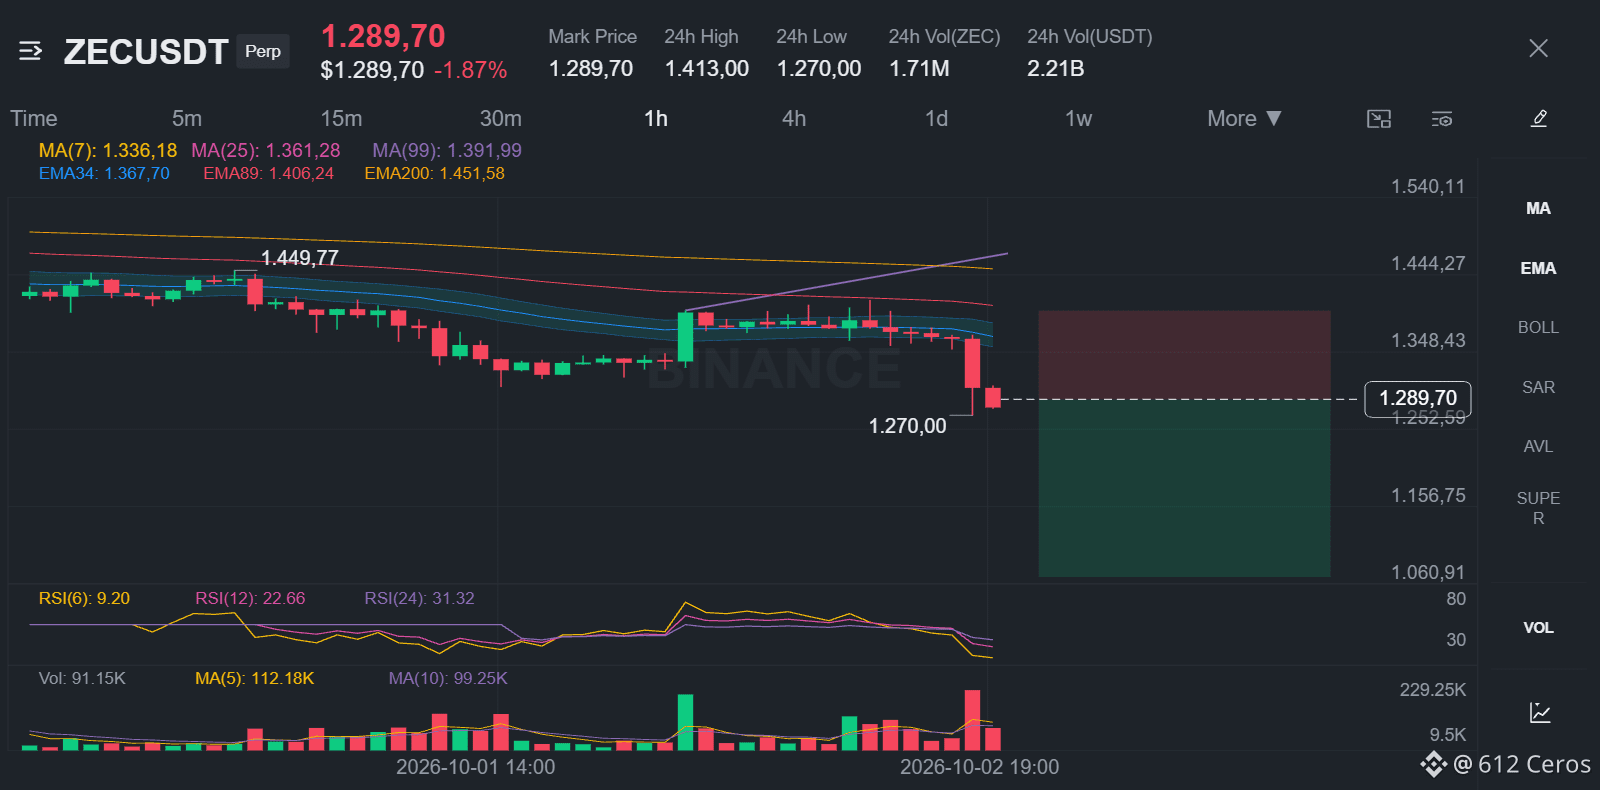
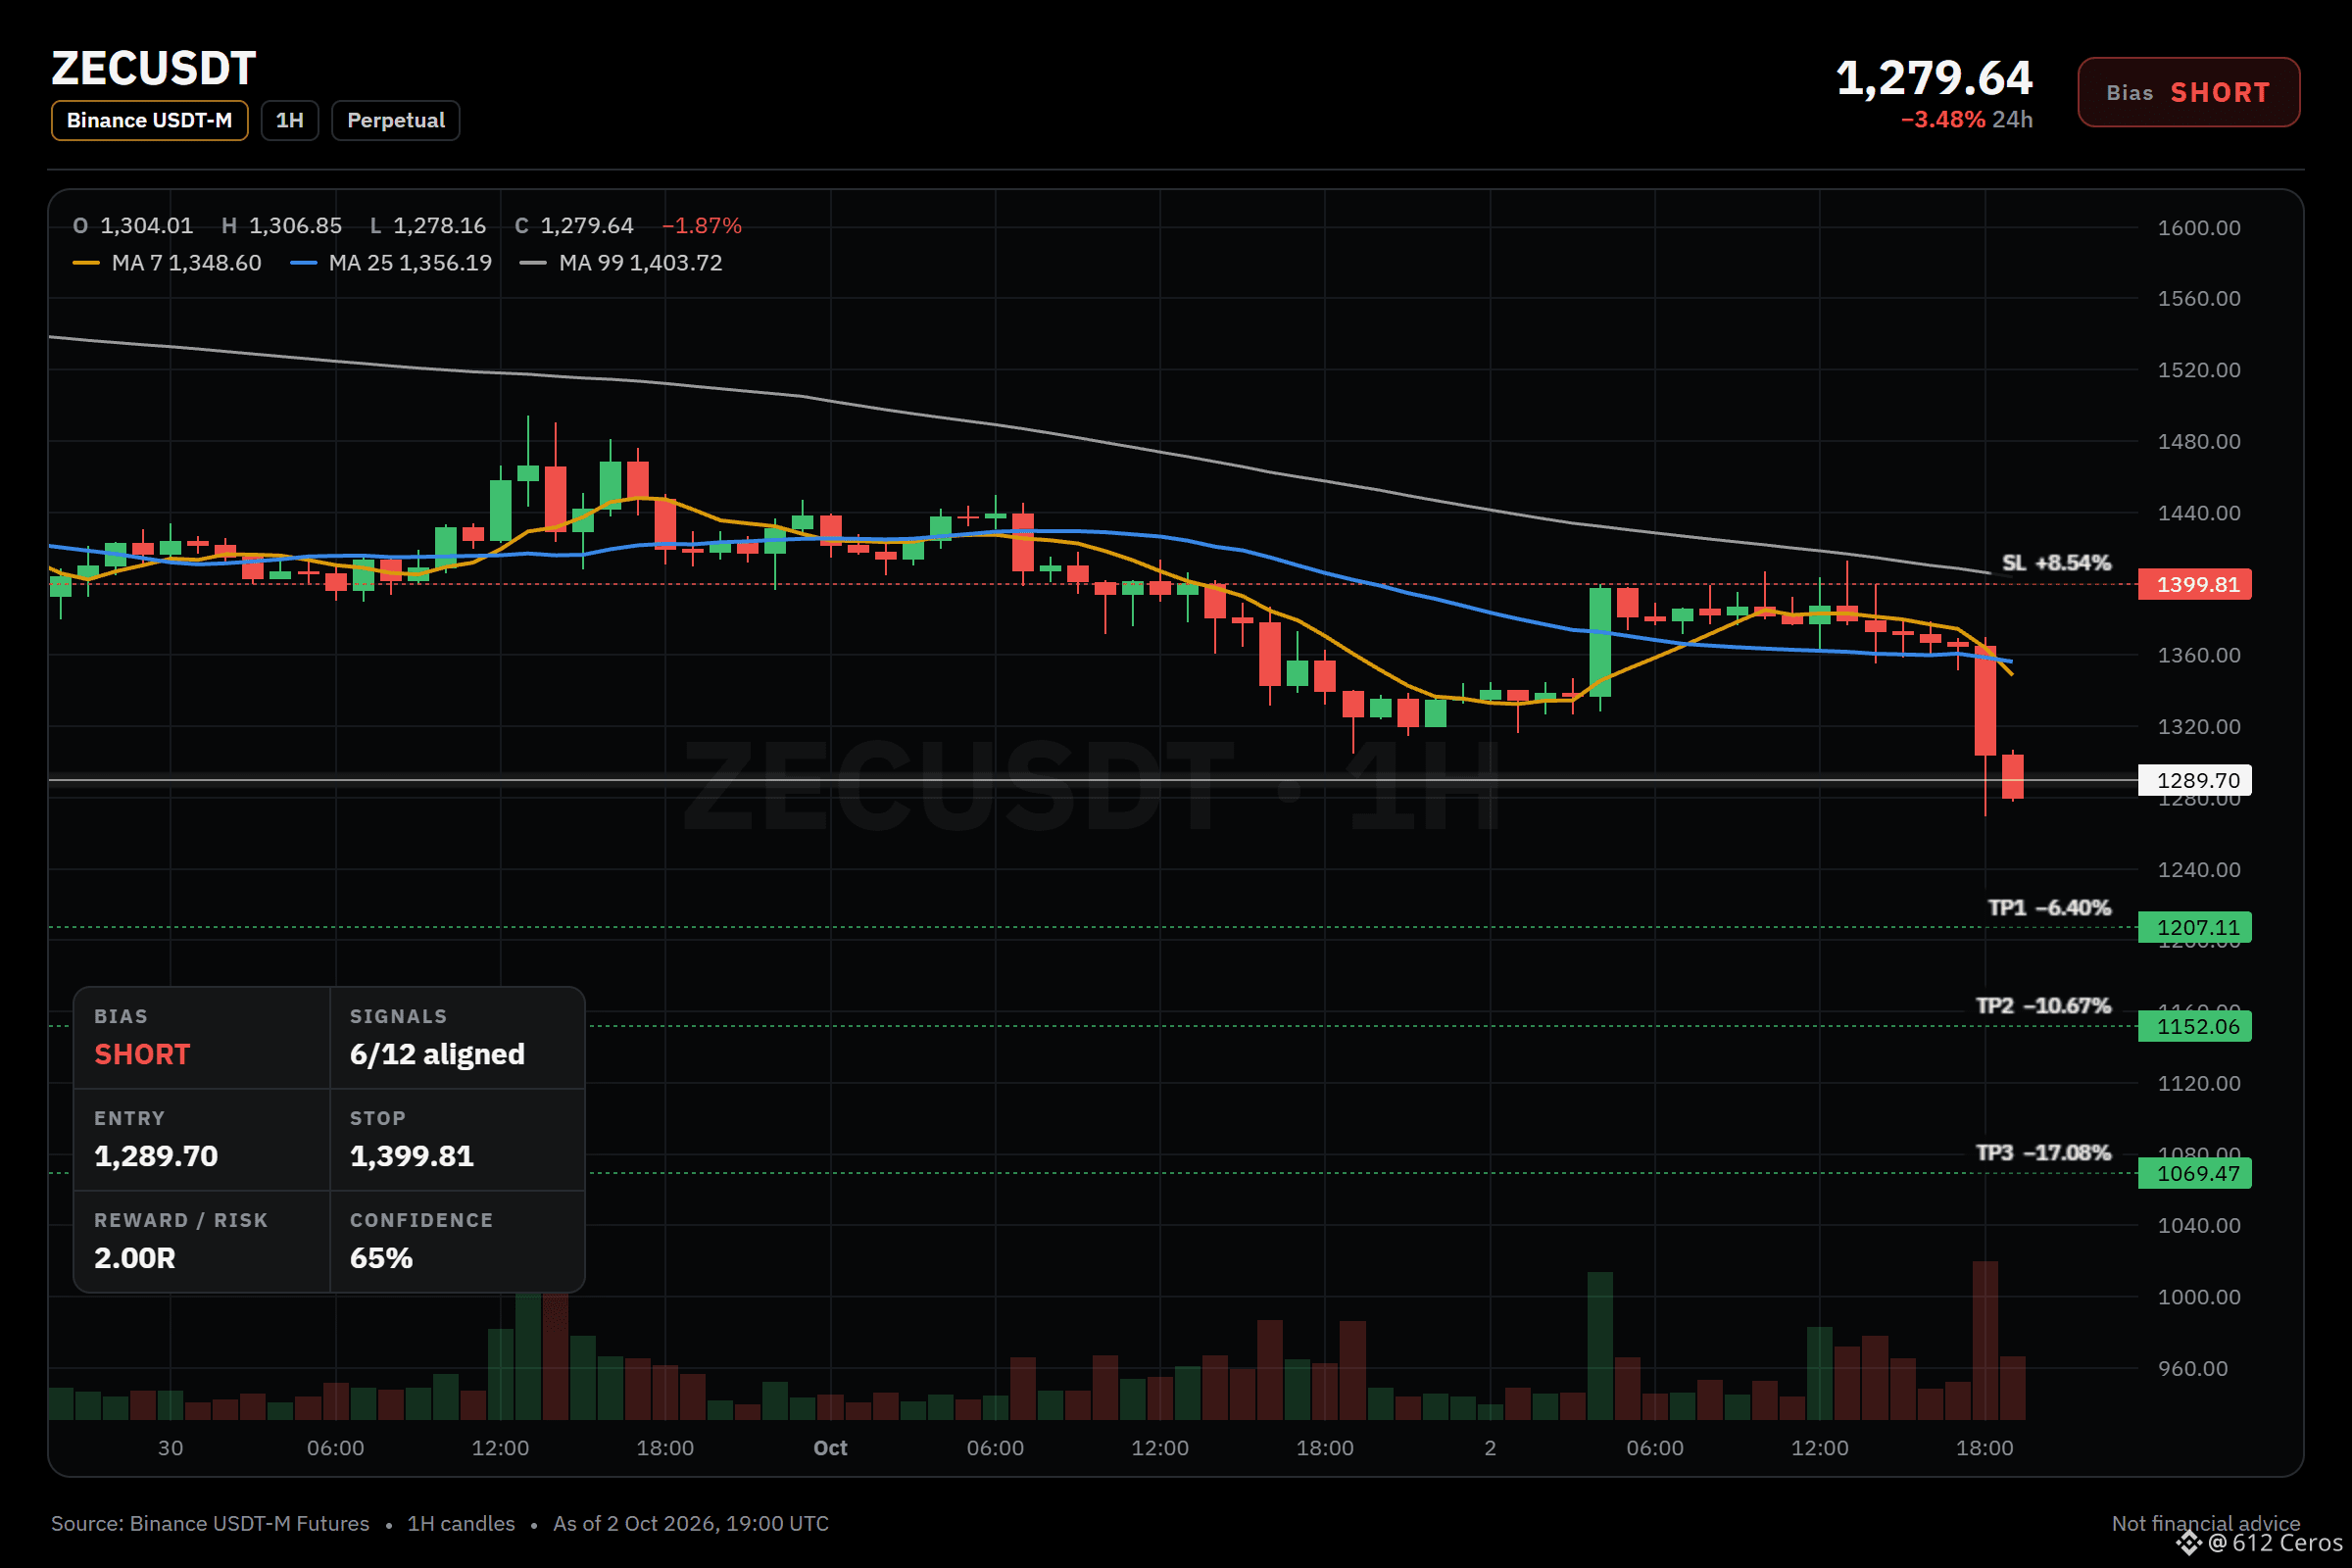
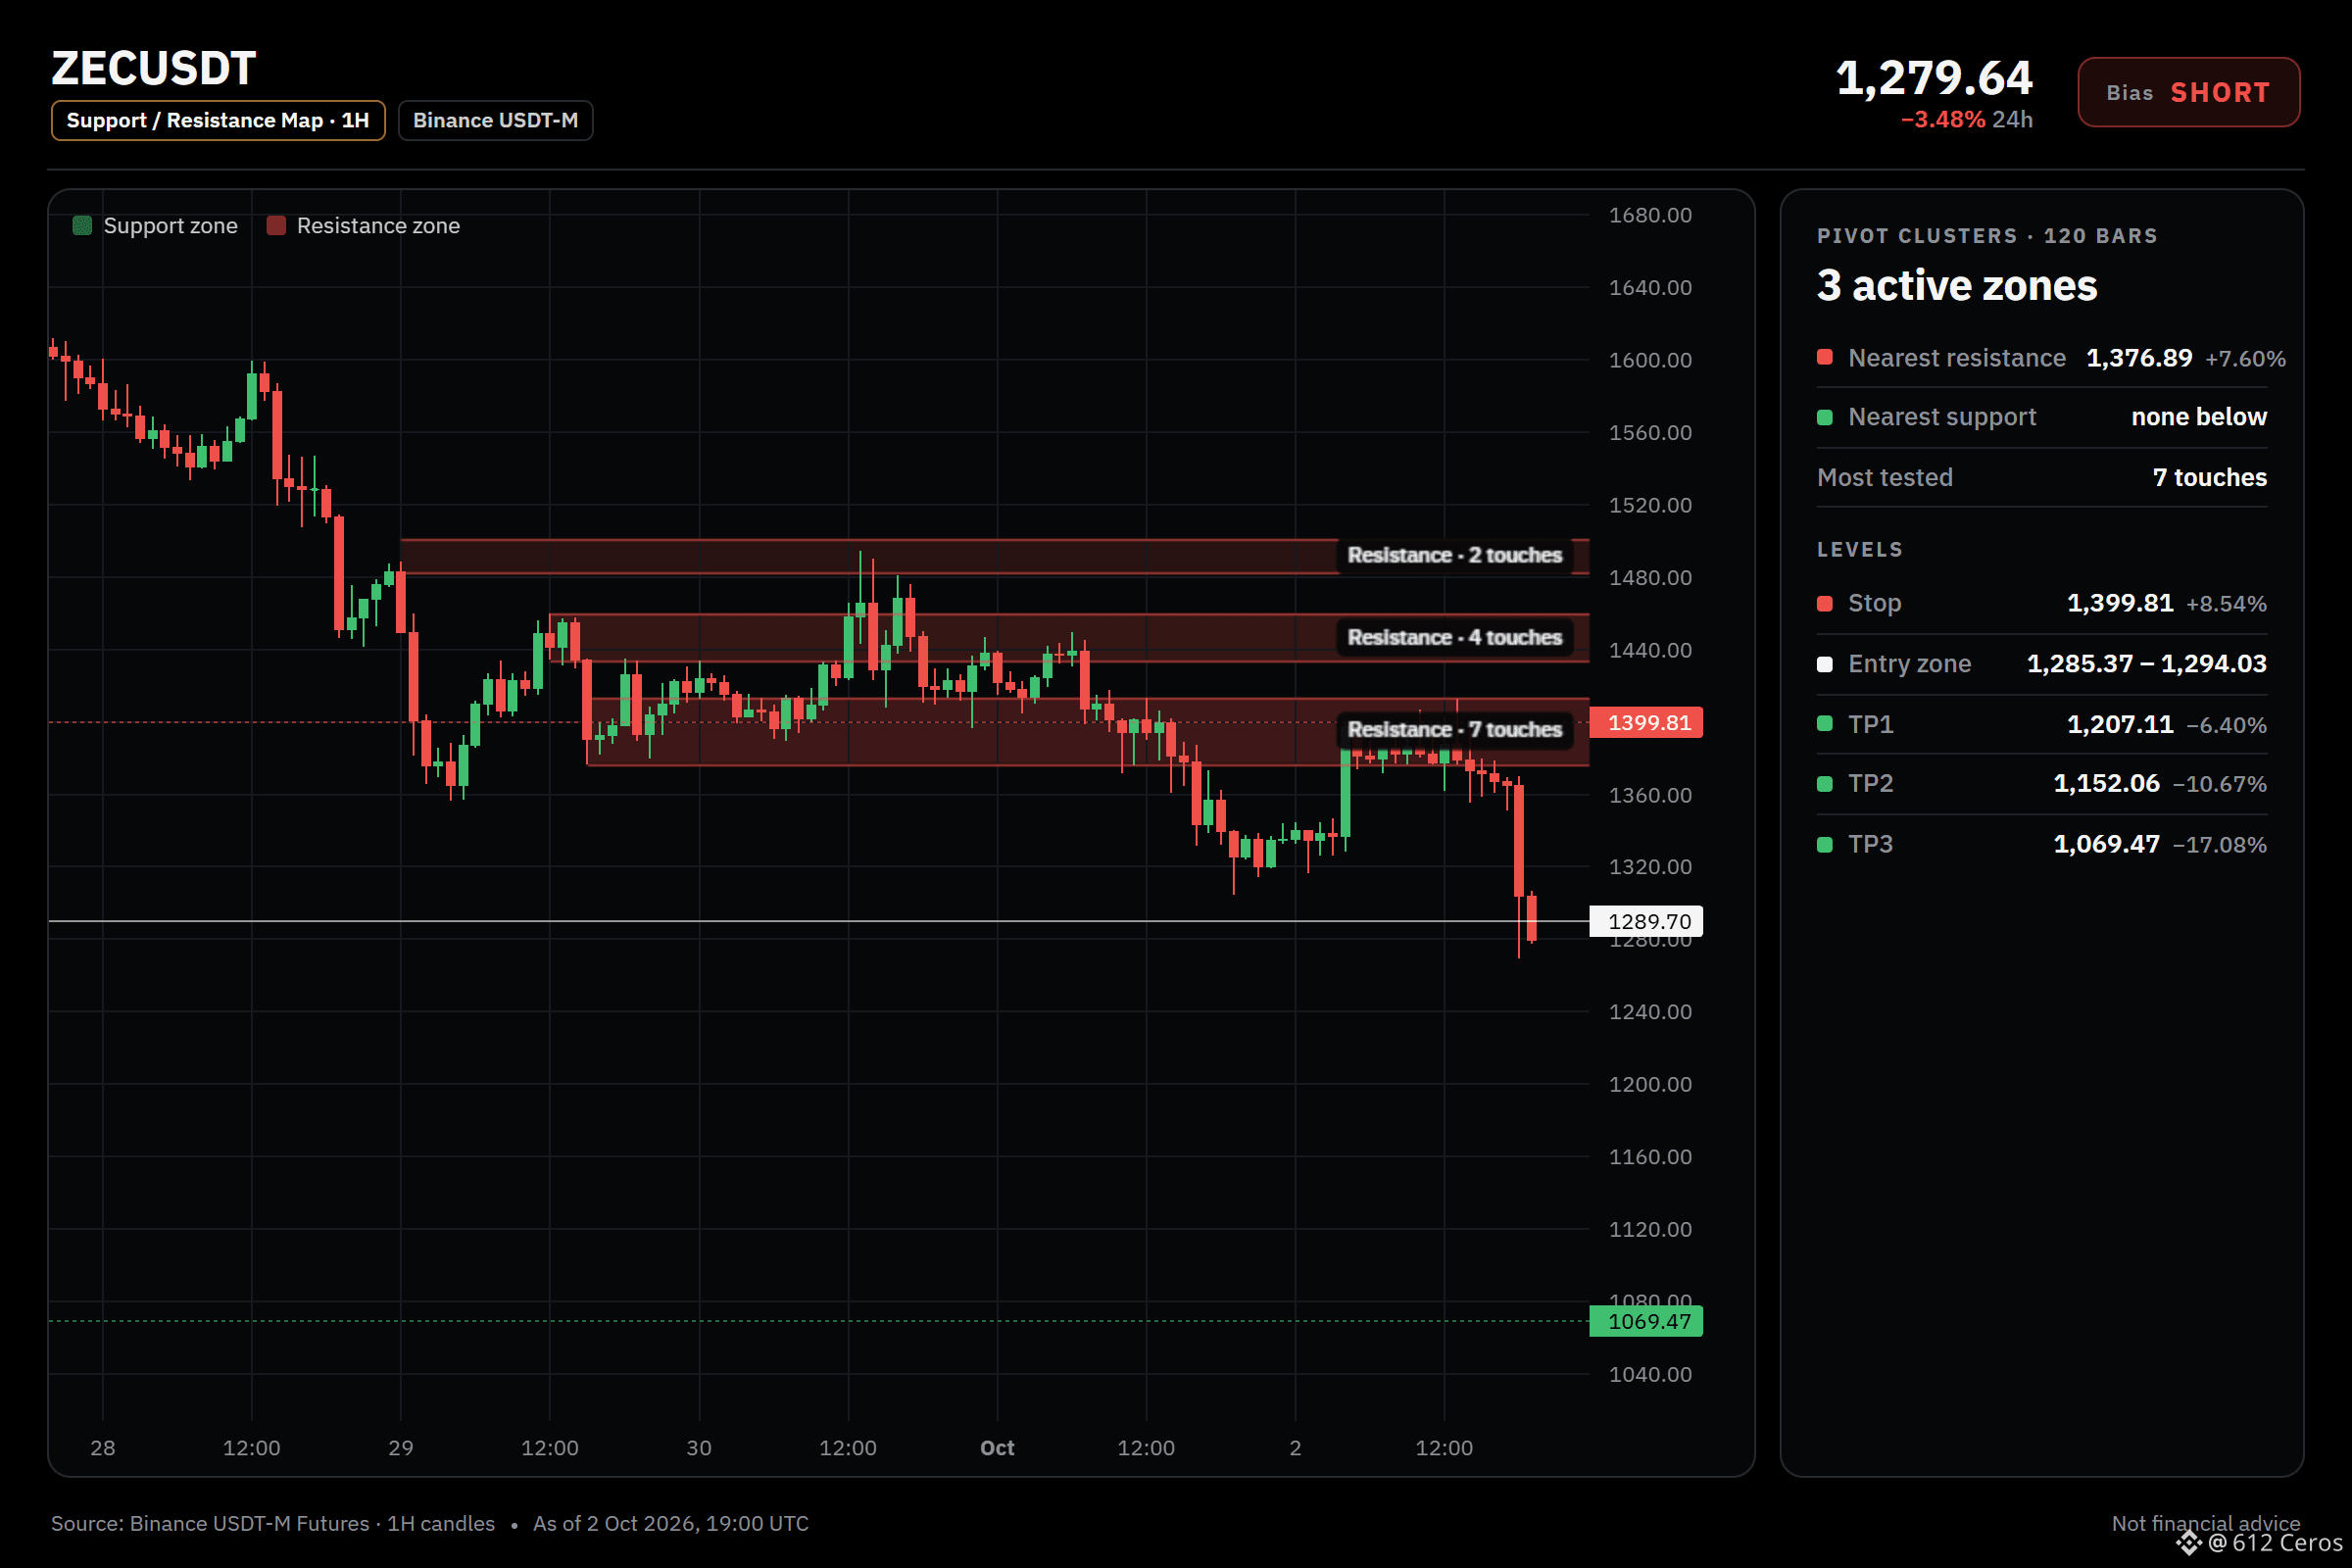
🔴 SHORT $ZEC /USDT: expecting price to go DOWN
Bias: SHORT · Leaning
Entry: 1285.37 – 1294.03
TP1: 1207.11 (-6.4%)
TP2: 1152.06 (-10.7%)
TP3: 1069.47 (-17.1%)
SL: 1399.81 (+8.5%)
Plan: enter only inside the zone, take half at TP1, then move the stop to entry.
Caution: counter-trend setup against the bigger trend, only 6 signals confirm it. Size down, respect the stop.
ZEC leans short, but the daily trend says otherwise.
Why SHORT? Leaning call, 6/12 signals agree, 1 against, 5 undecided.
• 1h trend: price < EMA50 < EMA200, bearish stack → the short-term trend is down
• Trend strength (ADX/DI, 15m): ADX 38.6 with sellers in control (DI+ 6.1 vs DI− 35.3) → sellers are driving the move
• BTC backdrop: BTC trend is bearish and correlation is 0.60 → BTC is falling and this coin tends to follow
Risk: Daily trend: price > EMA50 > EMA200, bullish stack → the big-picture trend is up
The 1h price is below the 1h EMA50 and EMA200, and the 1h RSI sits at 25.5, showing sellers have momentum. This is a counter-trend bet against the daily bullish trend, so size down and respect the stop.
What is your stop level on ZEC if you were to take this short?
Chart with every level below.
{future}(ZECUSDT)
📲 Want more of my latest signals? Join me here:
[https://app.binance.com/uni-qr/D26WbL9t](https://app.binance.com/uni-qr/D26WbL9t)
⚠️ Personal market analysis only. NFA — manage risk and DYOR.
Educational content, not investment advice or a recommendation to buy, sell, deposit, or withdraw any asset. No paid promotion or referral/affiliate links.
🔴 SHORT $ZEC /USDT: expecting price to go DOWN
Bias: SHORT · Leaning
Entry: 1285.37 – 1294.03
TP1: 1207.11 (-6.4%)
TP2: 1152.06 (-10.7%)
TP3: 1069.47 (-17.1%)
SL: 1399.81 (+8.5%)
Plan: enter only inside the zone, take half at TP1, then move the stop to entry.
Caution: counter-trend setup against the bigger trend, only 6 signals confirm it. Size down, respect the stop.
ZEC leans short, but the daily trend says otherwise.
Why SHORT? Leaning call, 6/12 signals agree, 1 against, 5 undecided.
• 1h trend: price < EMA50 < EMA200, bearish stack → the short-term trend is down
• Trend strength (ADX/DI, 15m): ADX 38.6 with sellers in control (DI+ 6.1 vs DI− 35.3) → sellers are driving the move
• BTC backdrop: BTC trend is bearish and correlation is 0.60 → BTC is falling and this coin tends to follow
Risk: Daily trend: price > EMA50 > EMA200, bullish stack → the big-picture trend is up
The 1h price is below the 1h EMA50 and EMA200, and the 1h RSI sits at 25.5, showing sellers have momentum. This is a counter-trend bet against the daily bullish trend, so size down and respect the stop.
What is your stop level on ZEC if you were to take this short?
Chart with every level below.
📲 Want more of my latest signals? Join me here:
https://app.binance.com/uni-qr/D26WbL9t
⚠️ Personal market analysis only. NFA — manage risk and DYOR.
Educational content, not investment advice or a recommendation to buy, sell, deposit, or withdraw any asset. No paid promotion or referral/affiliate links.
Bias: SHORT · Leaning
Entry: 1285.37 – 1294.03
TP1: 1207.11 (-6.4%)
TP2: 1152.06 (-10.7%)
TP3: 1069.47 (-17.1%)
SL: 1399.81 (+8.5%)
Plan: enter only inside the zone, take half at TP1, then move the stop to entry.
Caution: counter-trend setup against the bigger trend, only 6 signals confirm it. Size down, respect the stop.
ZEC leans short, but the daily trend says otherwise.
Why SHORT? Leaning call, 6/12 signals agree, 1 against, 5 undecided.
• 1h trend: price < EMA50 < EMA200, bearish stack → the short-term trend is down
• Trend strength (ADX/DI, 15m): ADX 38.6 with sellers in control (DI+ 6.1 vs DI− 35.3) → sellers are driving the move
• BTC backdrop: BTC trend is bearish and correlation is 0.60 → BTC is falling and this coin tends to follow
Risk: Daily trend: price > EMA50 > EMA200, bullish stack → the big-picture trend is up
The 1h price is below the 1h EMA50 and EMA200, and the 1h RSI sits at 25.5, showing sellers have momentum. This is a counter-trend bet against the daily bullish trend, so size down and respect the stop.
What is your stop level on ZEC if you were to take this short?
Chart with every level below.
📲 Want more of my latest signals? Join me here:
https://app.binance.com/uni-qr/D26WbL9t
⚠️ Personal market analysis only. NFA — manage risk and DYOR.
Educational content, not investment advice or a recommendation to buy, sell, deposit, or withdraw any asset. No paid promotion or referral/affiliate links.
2
1k
·
--
Baissier
USELESS stalls under a bullish daily trend.
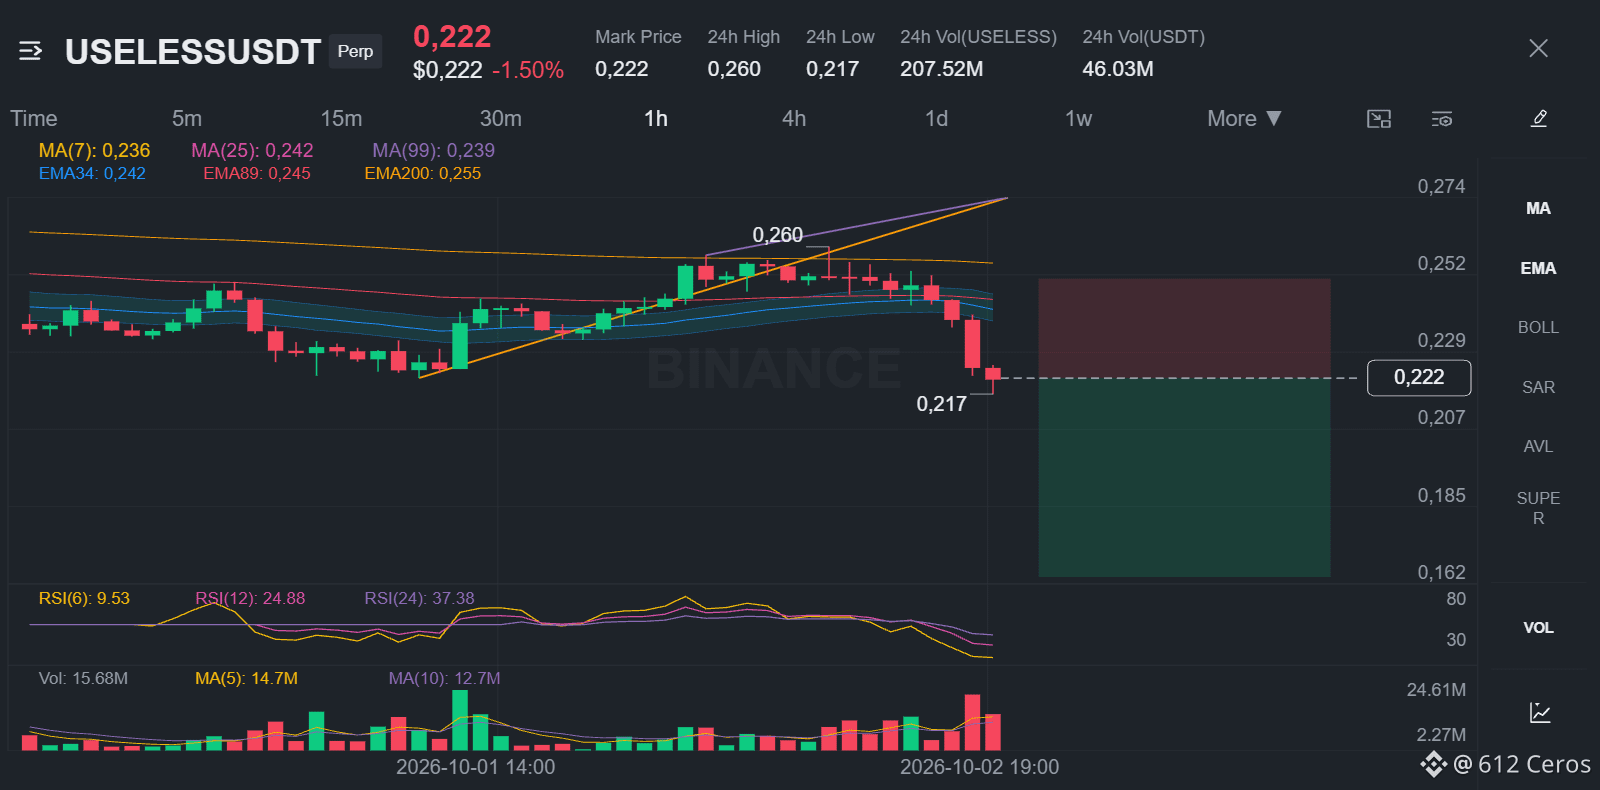
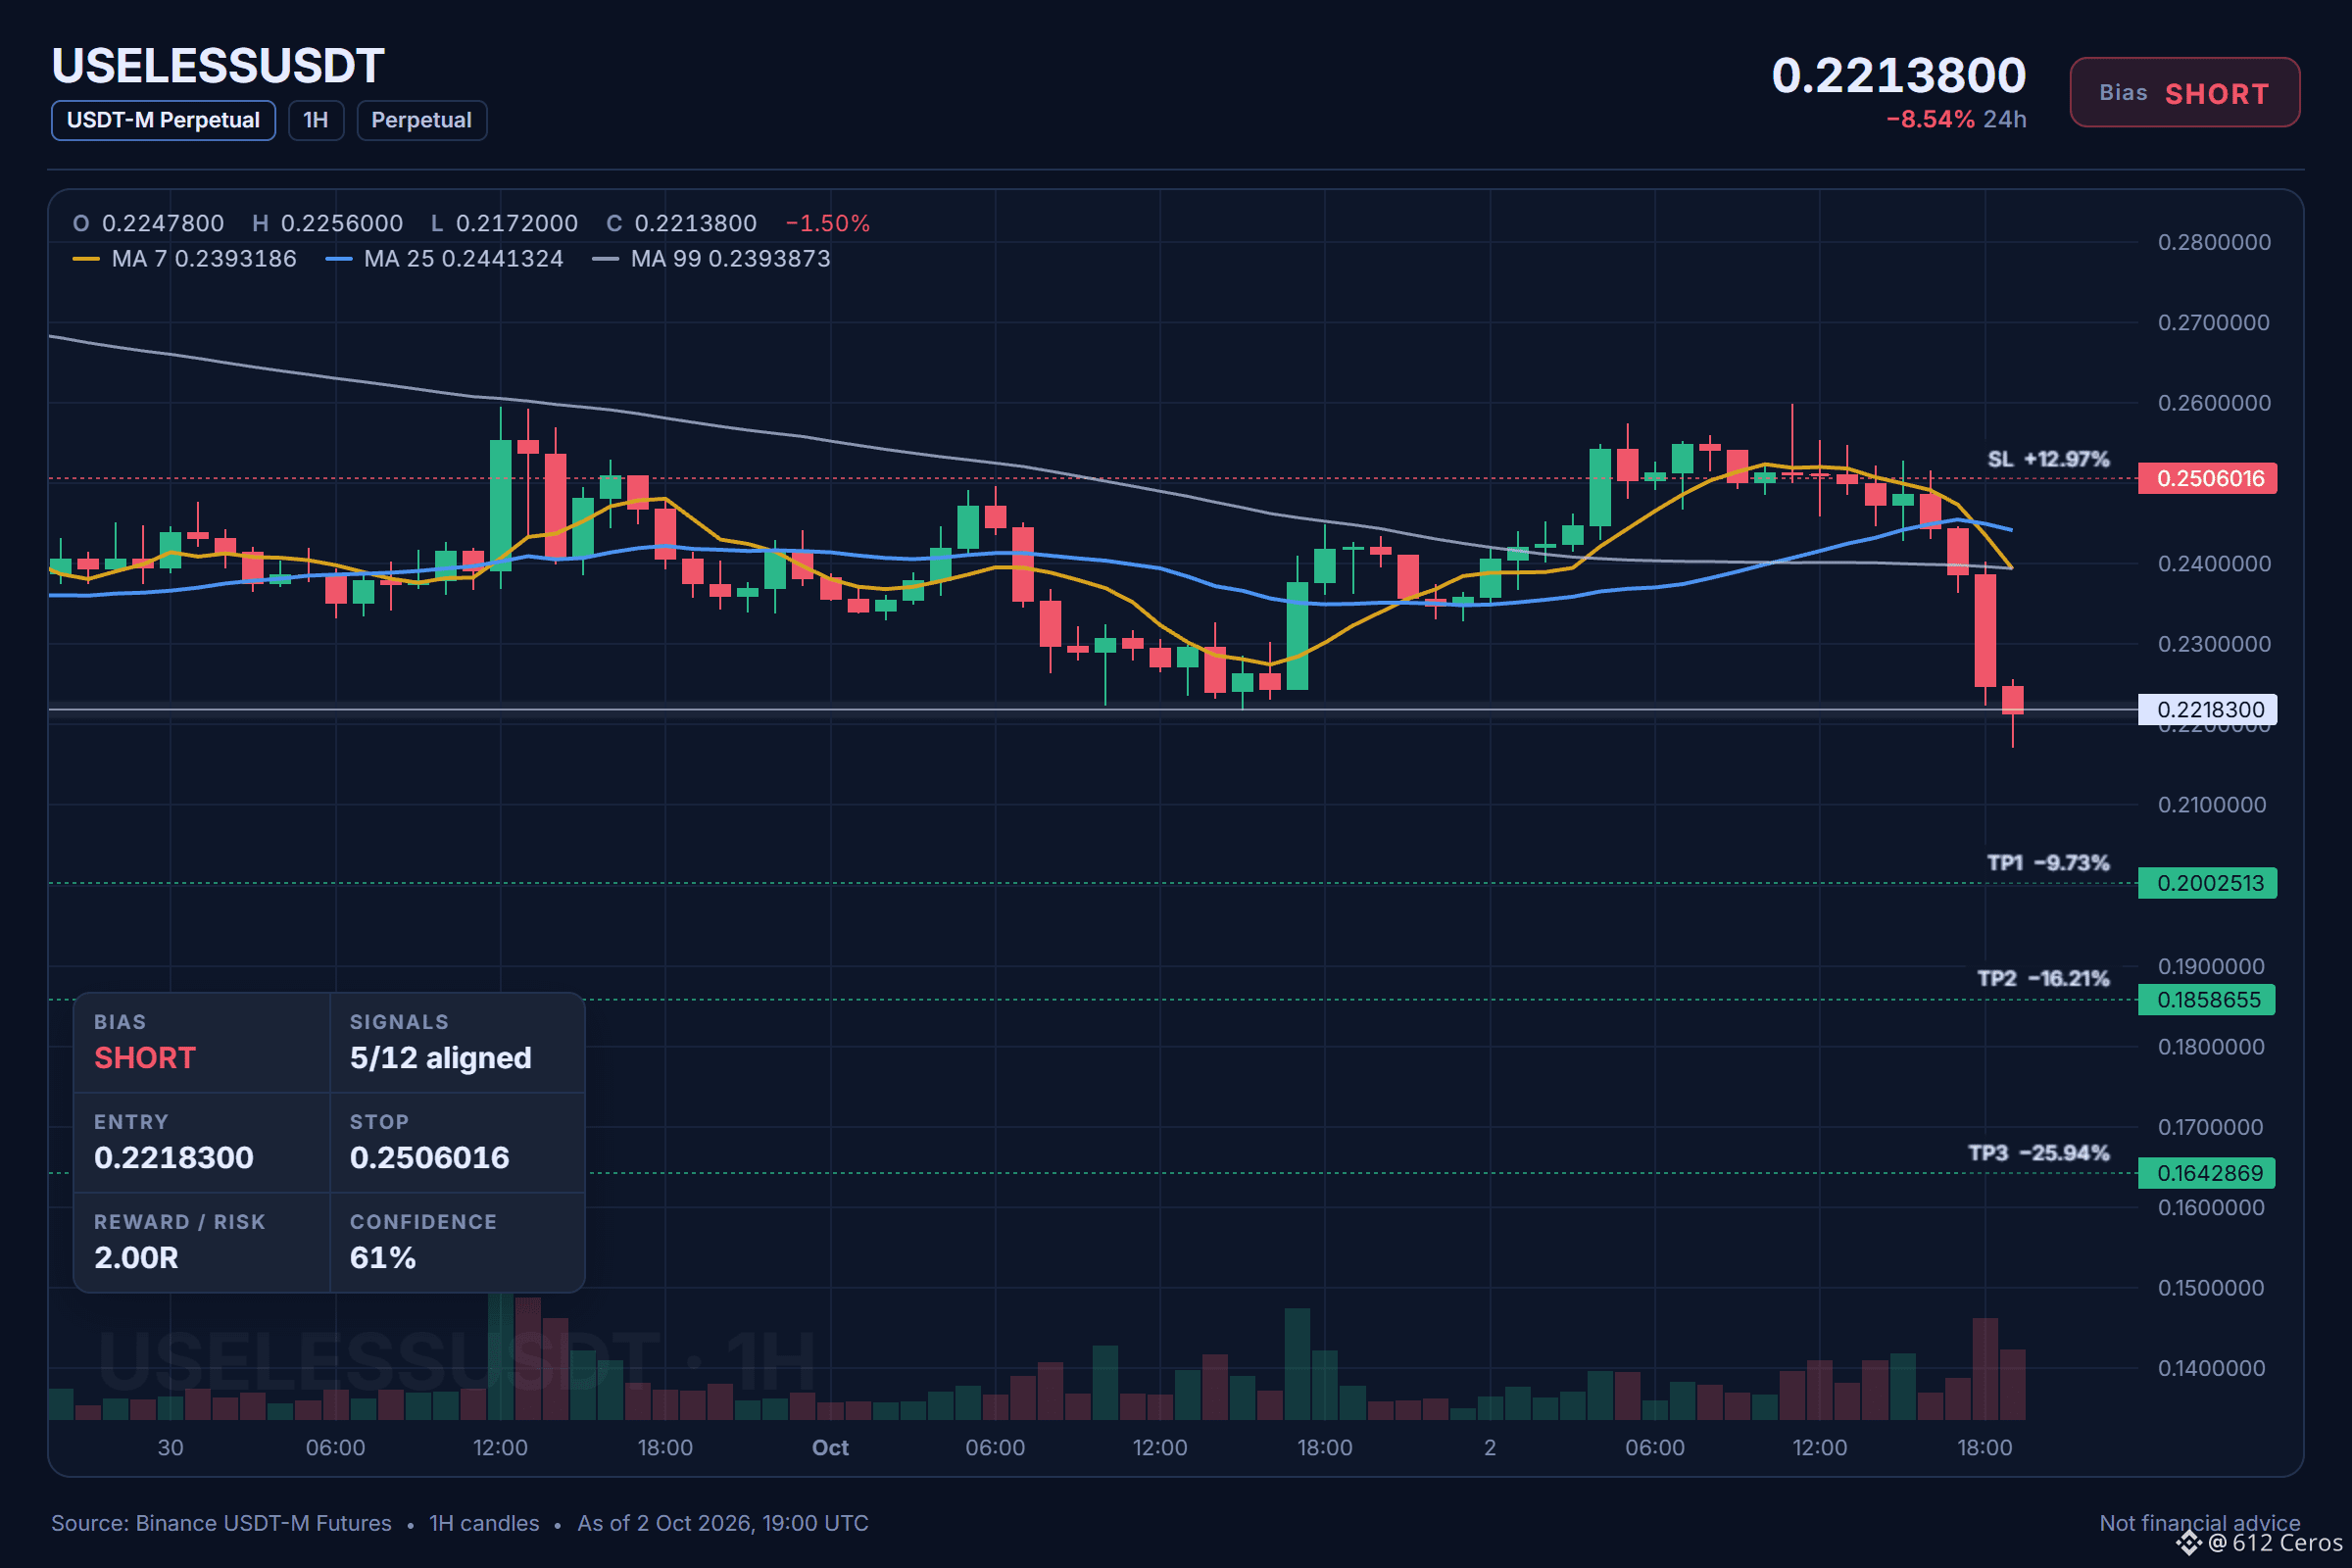
🔴 SHORT $USELESS /USDT: expecting price to go DOWN
Bias: SHORT · Leaning
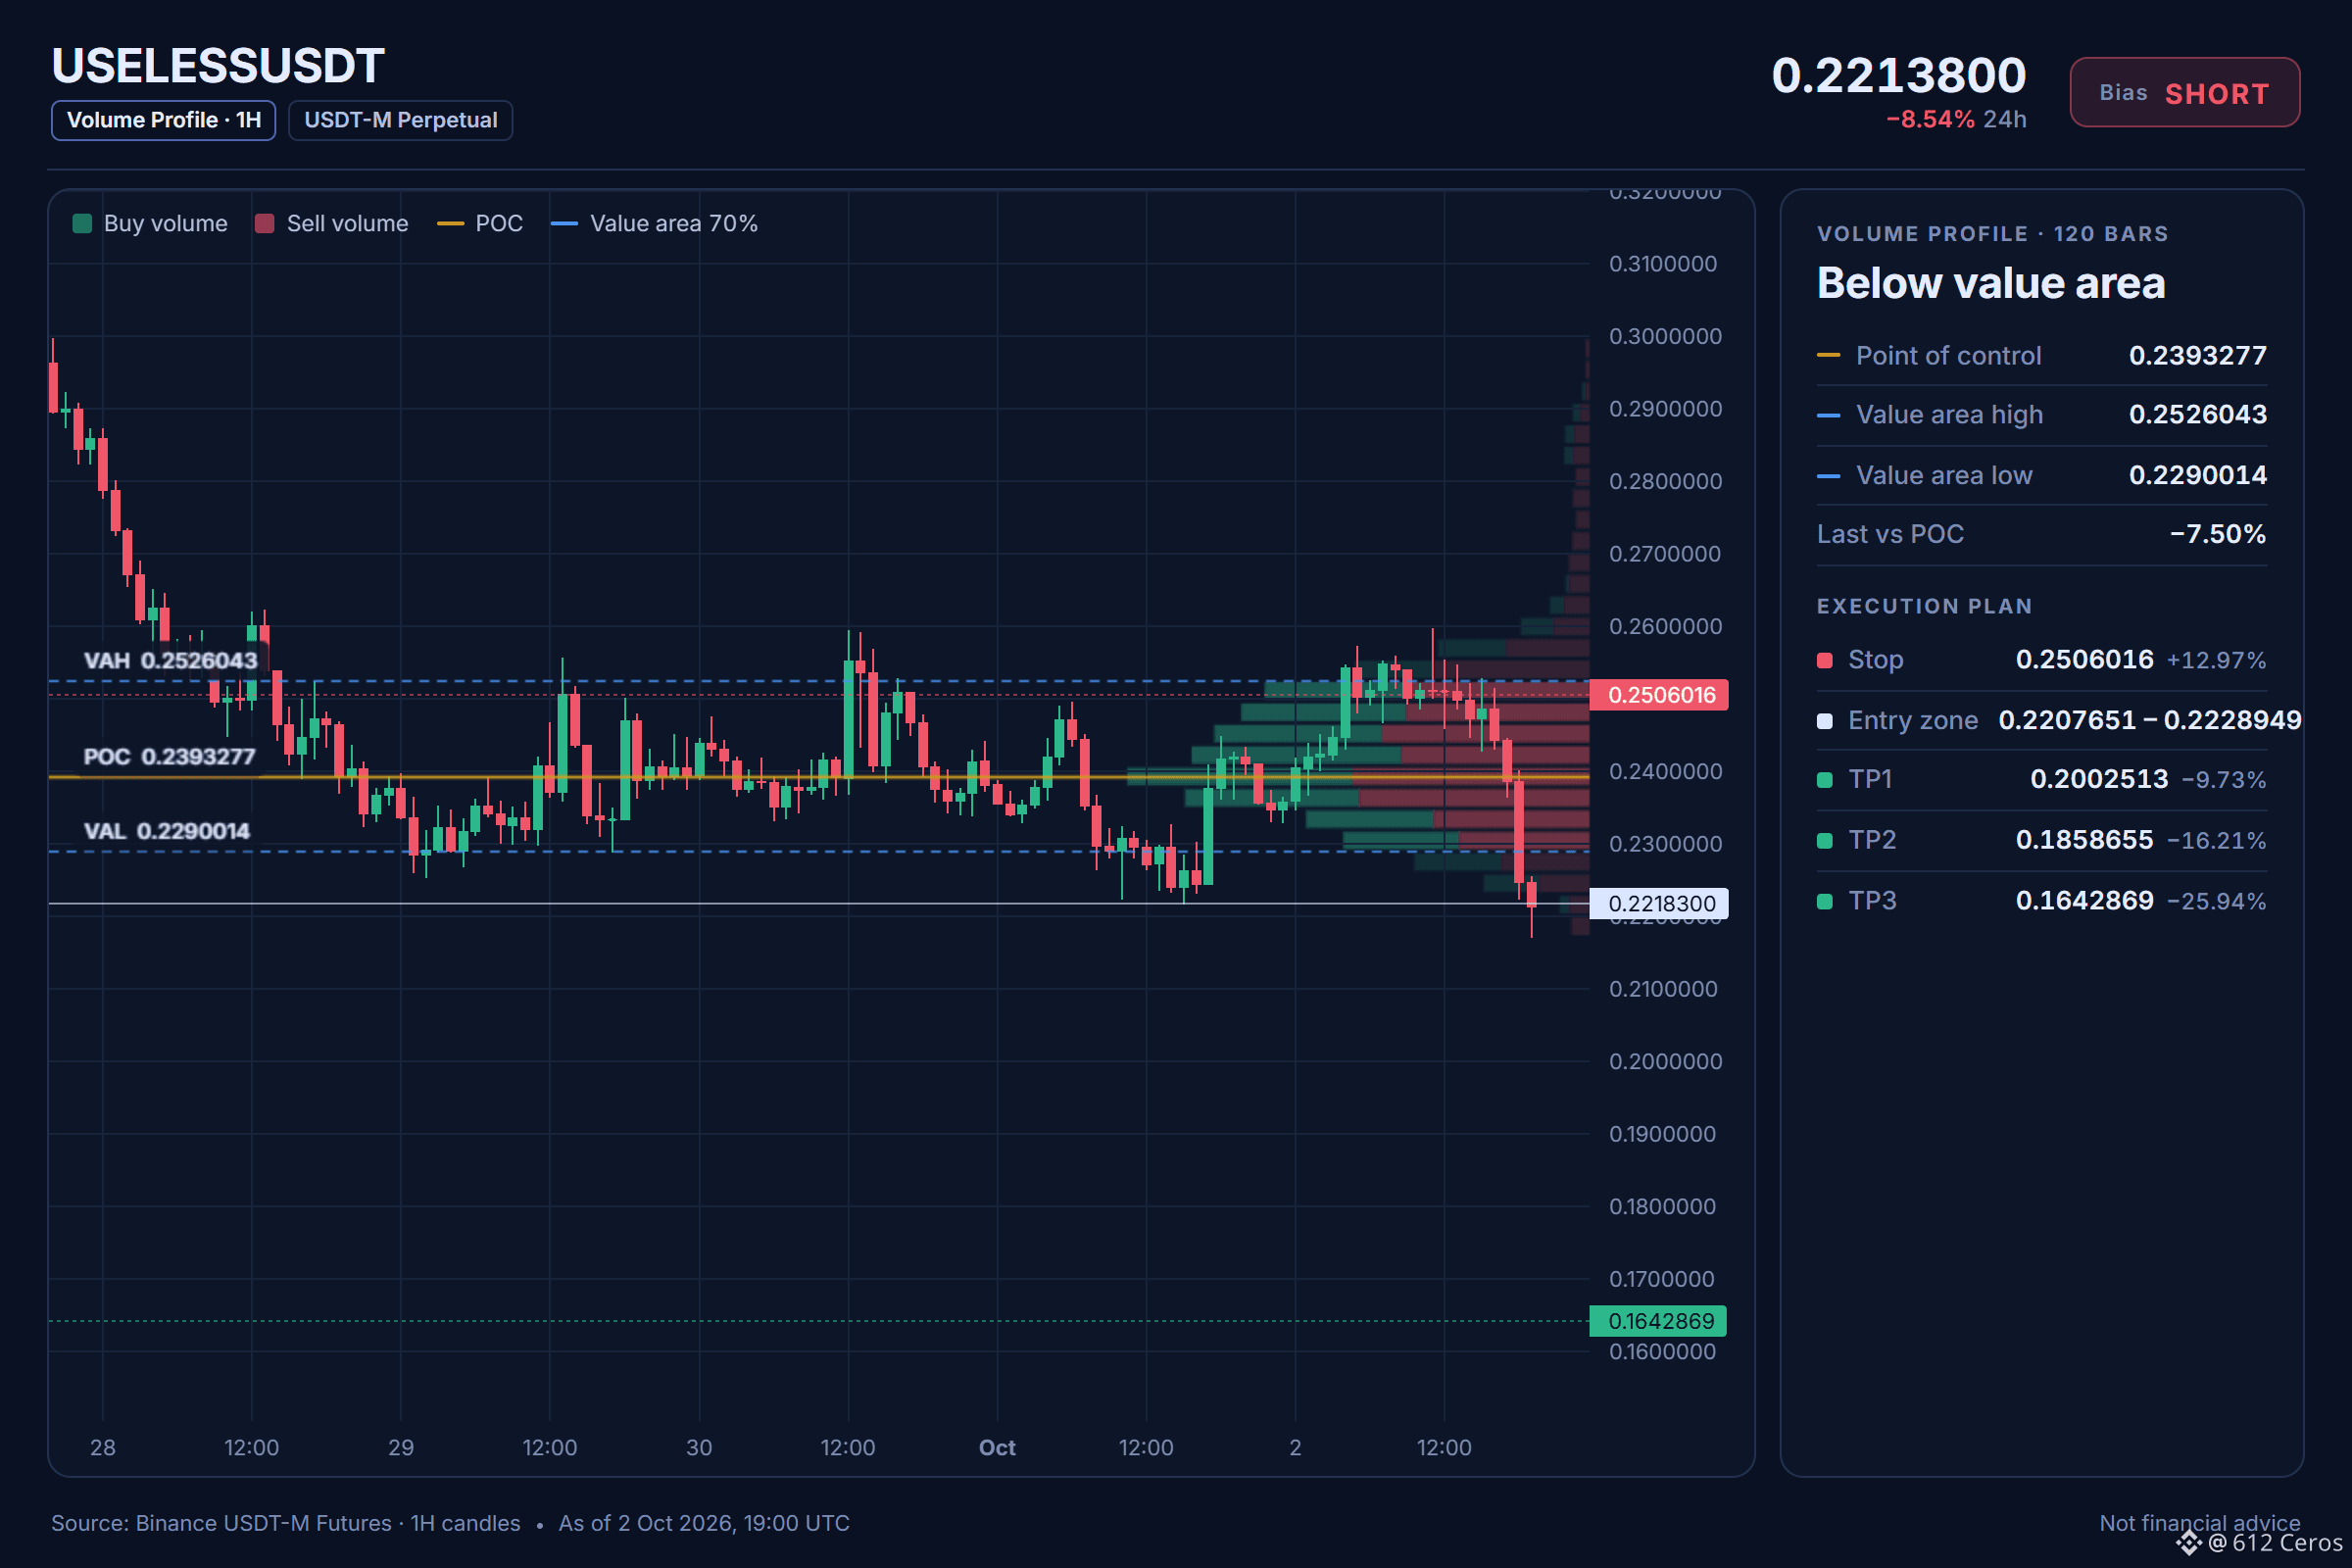
Entry: 0.2207651 – 0.2228949
TP1: 0.2002513 (-9.7%)
TP2: 0.1858655 (-16.2%)
TP3: 0.1642869 (-25.9%)
SL: 0.2506016 (+13.0%)
Plan: enter only inside the zone, take half at TP1, then move the stop to entry.
Caution: counter-trend idea backed by 5 signals only. Smaller size, hard stop.
Why SHORT? Leaning call, 5/12 signals agree, 1 against, 6 undecided.
• 1h trend: price < EMA50 < EMA200, bearish stack → the short-term trend is down
• Trend strength (ADX/DI, 15m): ADX 41.7 with sellers in control (DI+ 8.9 vs DI− 36.2) → sellers are driving the move
• 4h RSI: 37.6, bearish momentum (below 45) → sellers have the momentum
Risk: Daily trend: price > EMA50 > EMA200, bullish stack → the big-picture trend is up
Quick USELESS read:
1/3 The daily trend is bullish, so this is a counter-trend reversal bet and riskier than a trend-following setup.
2/3 The 1h trend shows a bearish stack with price below EMA50 and EMA200, meaning the short-term trend is down.
3/3 A daily bullish stack and rising EMA50 would make the short thesis wrong, so respect the stop at the entry level.
What is your stop or invalidation level for this short, and do you agree with the setup?
Full setup on the chart below.
{future}(USELESSUSDT)
📲 Want more of my latest signals? Join me here:
[https://app.binance.com/uni-qr/D26WbL9t](https://app.binance.com/uni-qr/D26WbL9t)
⚠️ Personal market analysis only. NFA — manage risk and DYOR.
Educational content, not investment advice or a recommendation to buy, sell, deposit, or withdraw any asset. No paid promotion or referral/affiliate links.
USELESS stalls under a bullish daily trend.
🔴 SHORT $USELESS /USDT: expecting price to go DOWN
Bias: SHORT · Leaning
Entry: 0.2207651 – 0.2228949
TP1: 0.2002513 (-9.7%)
TP2: 0.1858655 (-16.2%)
TP3: 0.1642869 (-25.9%)
SL: 0.2506016 (+13.0%)
Plan: enter only inside the zone, take half at TP1, then move the stop to entry.
Caution: counter-trend idea backed by 5 signals only. Smaller size, hard stop.
Why SHORT? Leaning call, 5/12 signals agree, 1 against, 6 undecided.
• 1h trend: price < EMA50 < EMA200, bearish stack → the short-term trend is down
• Trend strength (ADX/DI, 15m): ADX 41.7 with sellers in control (DI+ 8.9 vs DI− 36.2) → sellers are driving the move
• 4h RSI: 37.6, bearish momentum (below 45) → sellers have the momentum
Risk: Daily trend: price > EMA50 > EMA200, bullish stack → the big-picture trend is up
Quick USELESS read:
1/3 The daily trend is bullish, so this is a counter-trend reversal bet and riskier than a trend-following setup.
2/3 The 1h trend shows a bearish stack with price below EMA50 and EMA200, meaning the short-term trend is down.
3/3 A daily bullish stack and rising EMA50 would make the short thesis wrong, so respect the stop at the entry level.
What is your stop or invalidation level for this short, and do you agree with the setup?
Full setup on the chart below.
📲 Want more of my latest signals? Join me here:
https://app.binance.com/uni-qr/D26WbL9t
⚠️ Personal market analysis only. NFA — manage risk and DYOR.
Educational content, not investment advice or a recommendation to buy, sell, deposit, or withdraw any asset. No paid promotion or referral/affiliate links.
🔴 SHORT $USELESS /USDT: expecting price to go DOWN
Bias: SHORT · Leaning
Entry: 0.2207651 – 0.2228949
TP1: 0.2002513 (-9.7%)
TP2: 0.1858655 (-16.2%)
TP3: 0.1642869 (-25.9%)
SL: 0.2506016 (+13.0%)
Plan: enter only inside the zone, take half at TP1, then move the stop to entry.
Caution: counter-trend idea backed by 5 signals only. Smaller size, hard stop.
Why SHORT? Leaning call, 5/12 signals agree, 1 against, 6 undecided.
• 1h trend: price < EMA50 < EMA200, bearish stack → the short-term trend is down
• Trend strength (ADX/DI, 15m): ADX 41.7 with sellers in control (DI+ 8.9 vs DI− 36.2) → sellers are driving the move
• 4h RSI: 37.6, bearish momentum (below 45) → sellers have the momentum
Risk: Daily trend: price > EMA50 > EMA200, bullish stack → the big-picture trend is up
Quick USELESS read:
1/3 The daily trend is bullish, so this is a counter-trend reversal bet and riskier than a trend-following setup.
2/3 The 1h trend shows a bearish stack with price below EMA50 and EMA200, meaning the short-term trend is down.
3/3 A daily bullish stack and rising EMA50 would make the short thesis wrong, so respect the stop at the entry level.
What is your stop or invalidation level for this short, and do you agree with the setup?
Full setup on the chart below.
📲 Want more of my latest signals? Join me here:
https://app.binance.com/uni-qr/D26WbL9t
⚠️ Personal market analysis only. NFA — manage risk and DYOR.
Educational content, not investment advice or a recommendation to buy, sell, deposit, or withdraw any asset. No paid promotion or referral/affiliate links.
593
·
--
Haussier
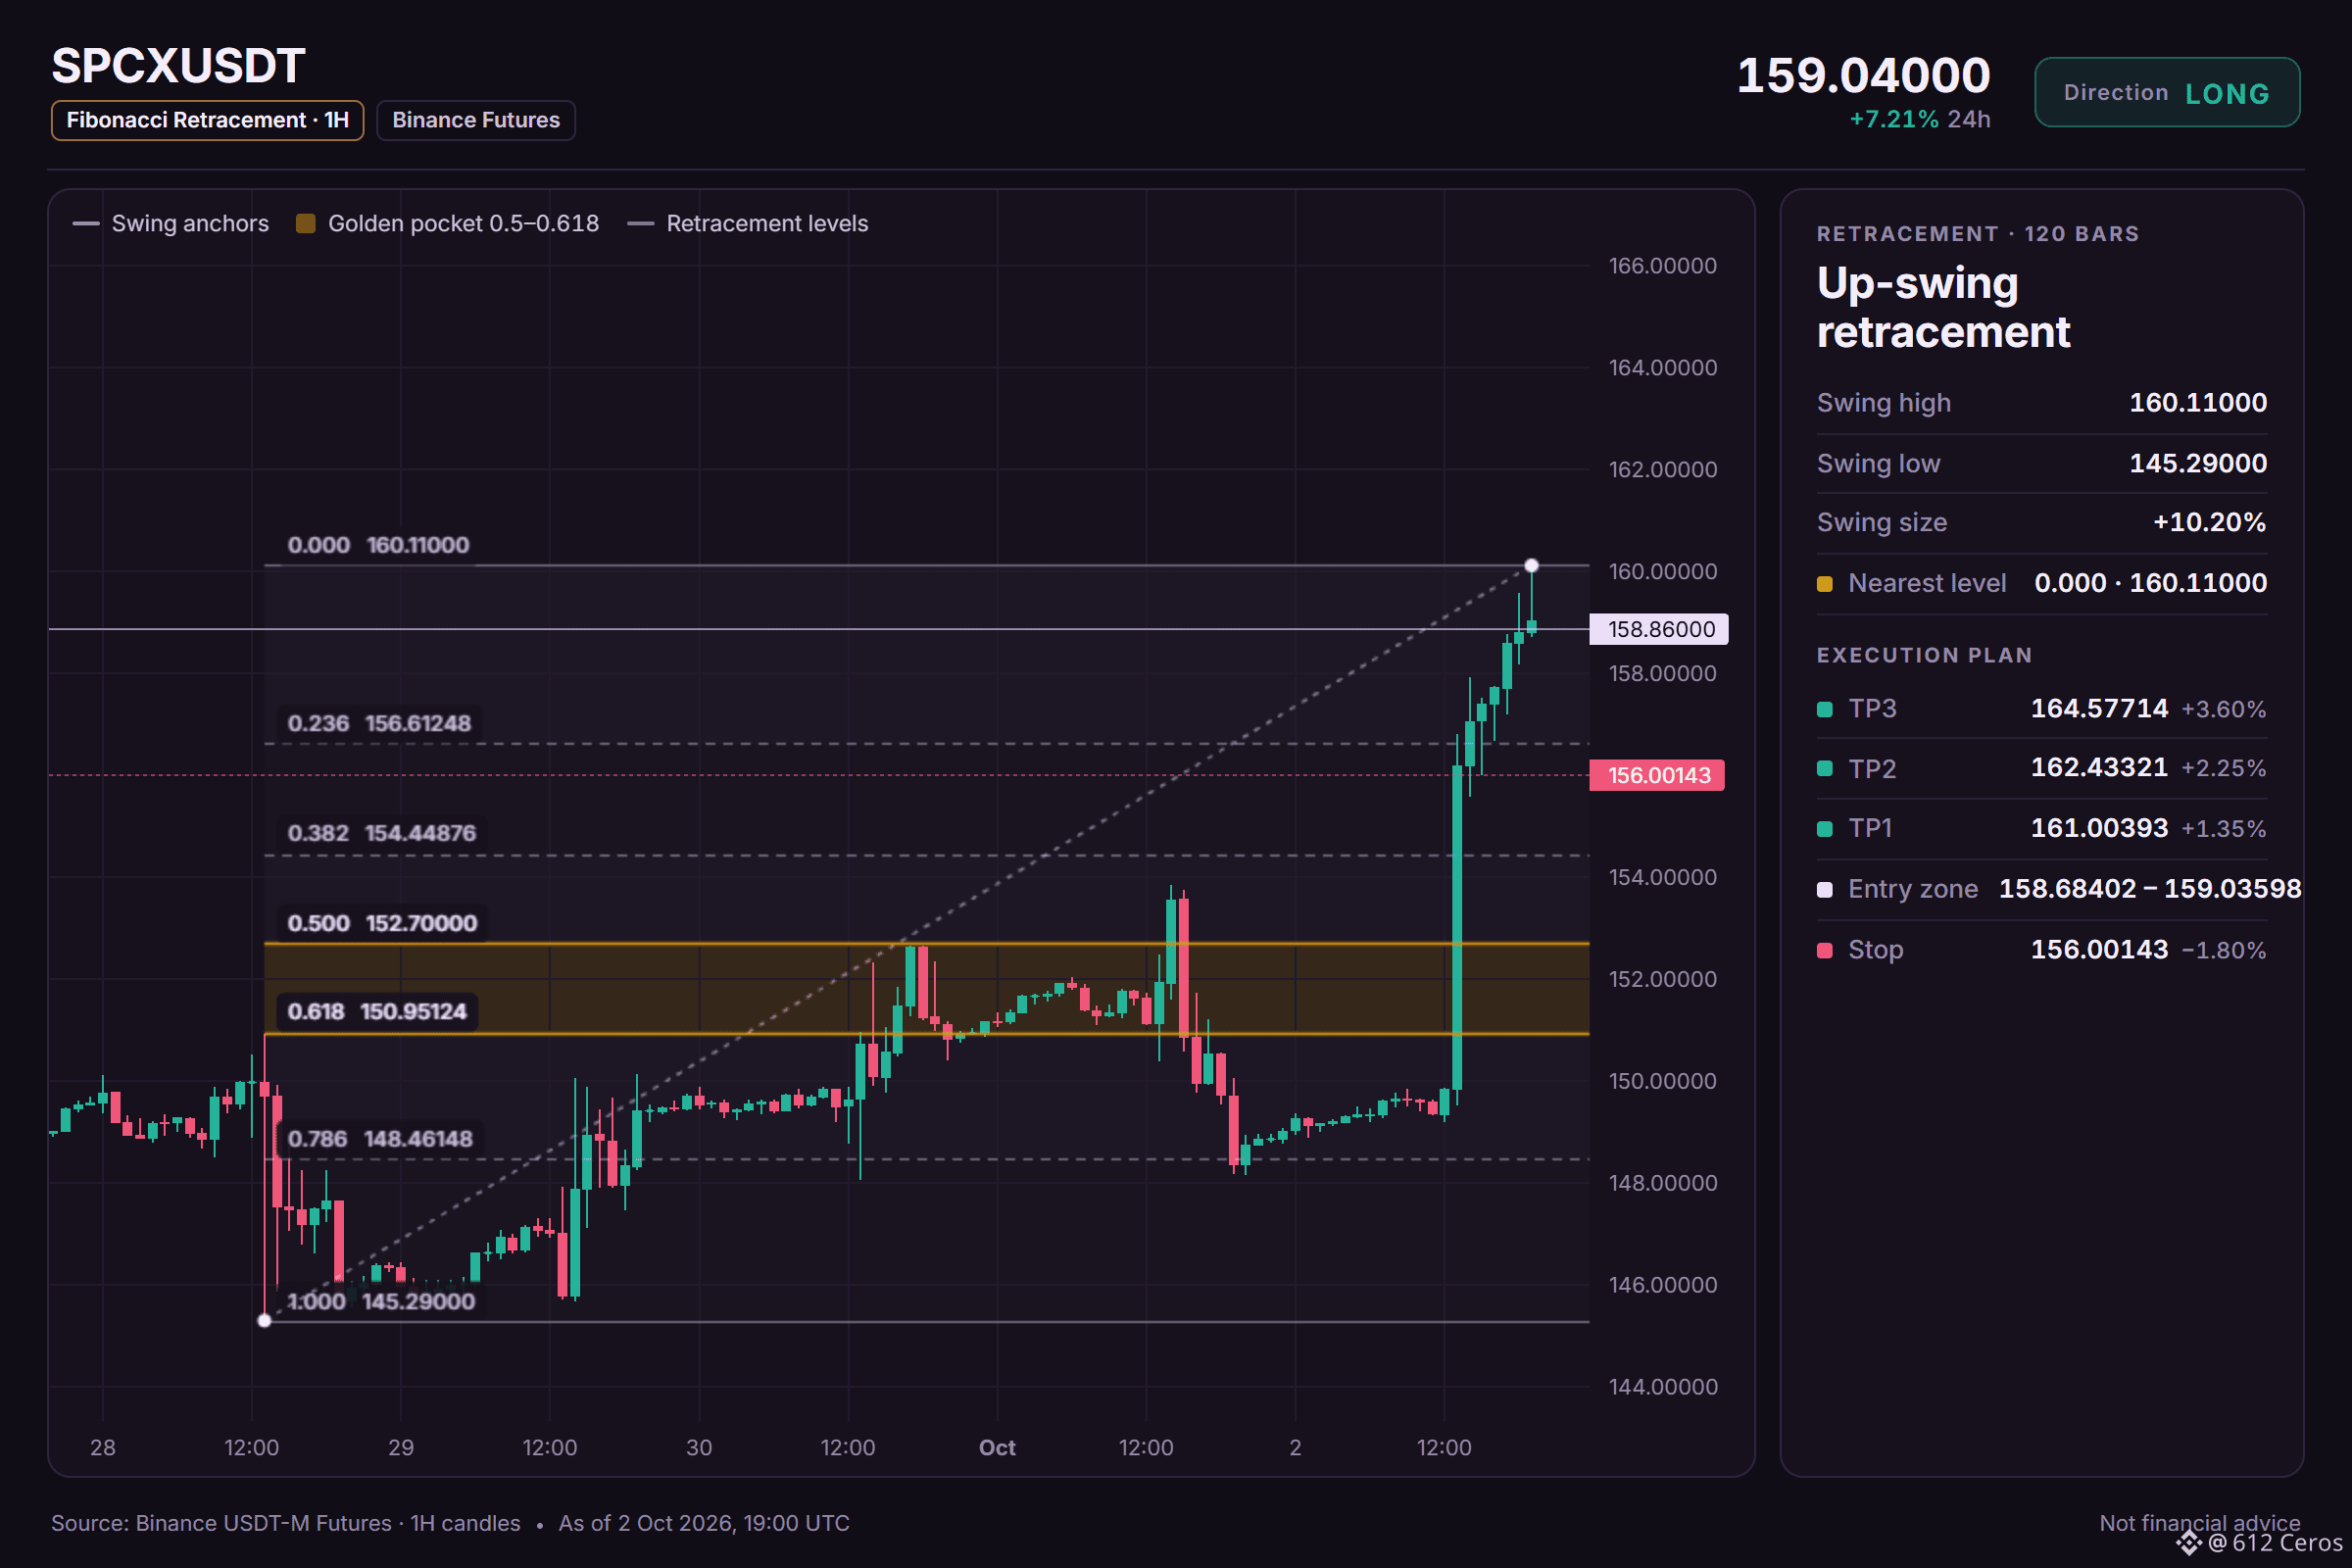
SPCX has momentum, but it is stretched
🟢 LONG $SPCX /USDT: expecting price to go UP
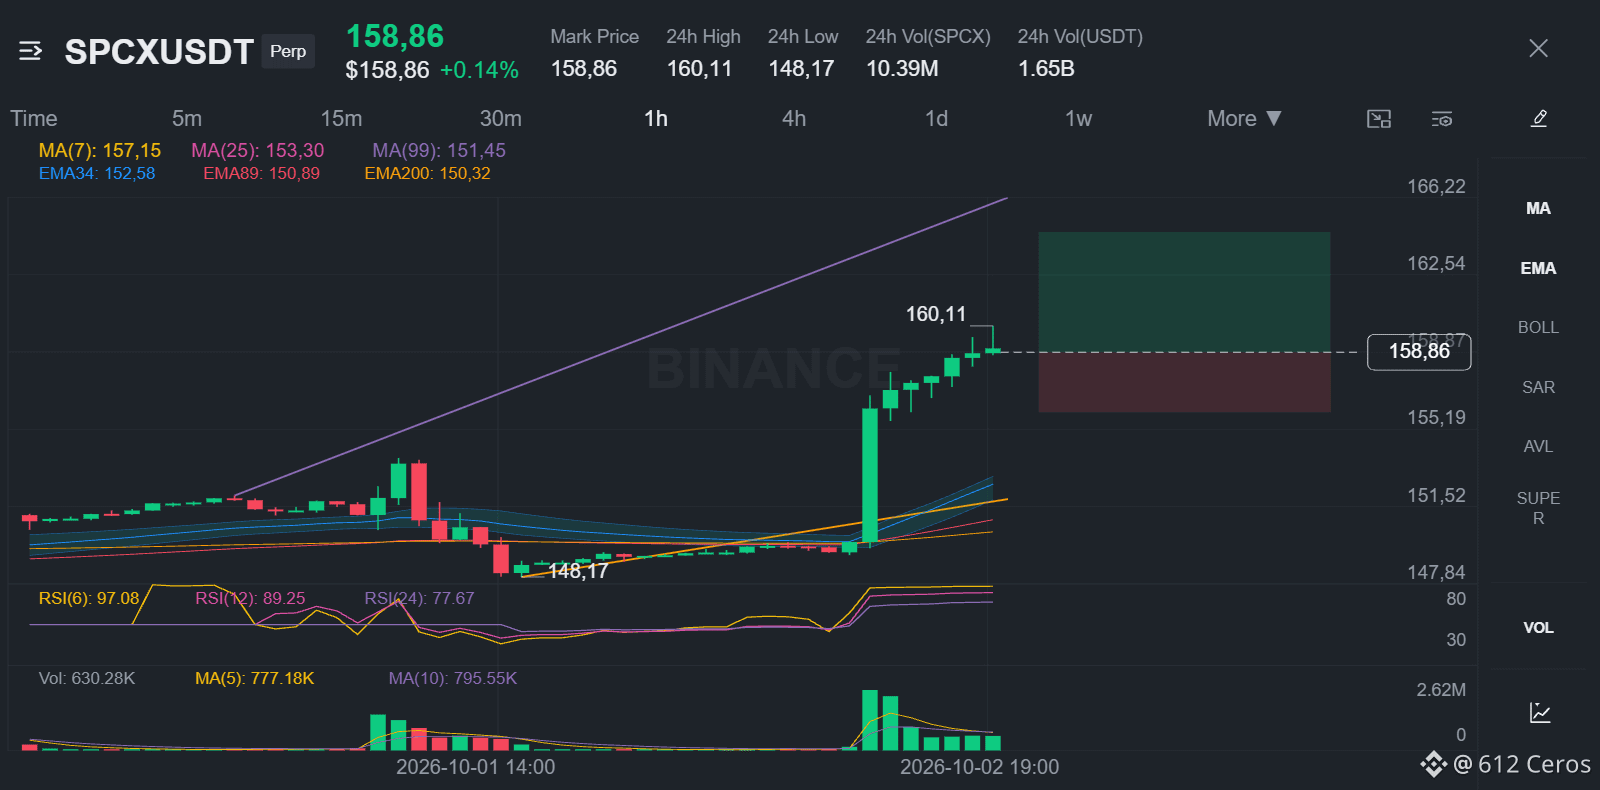
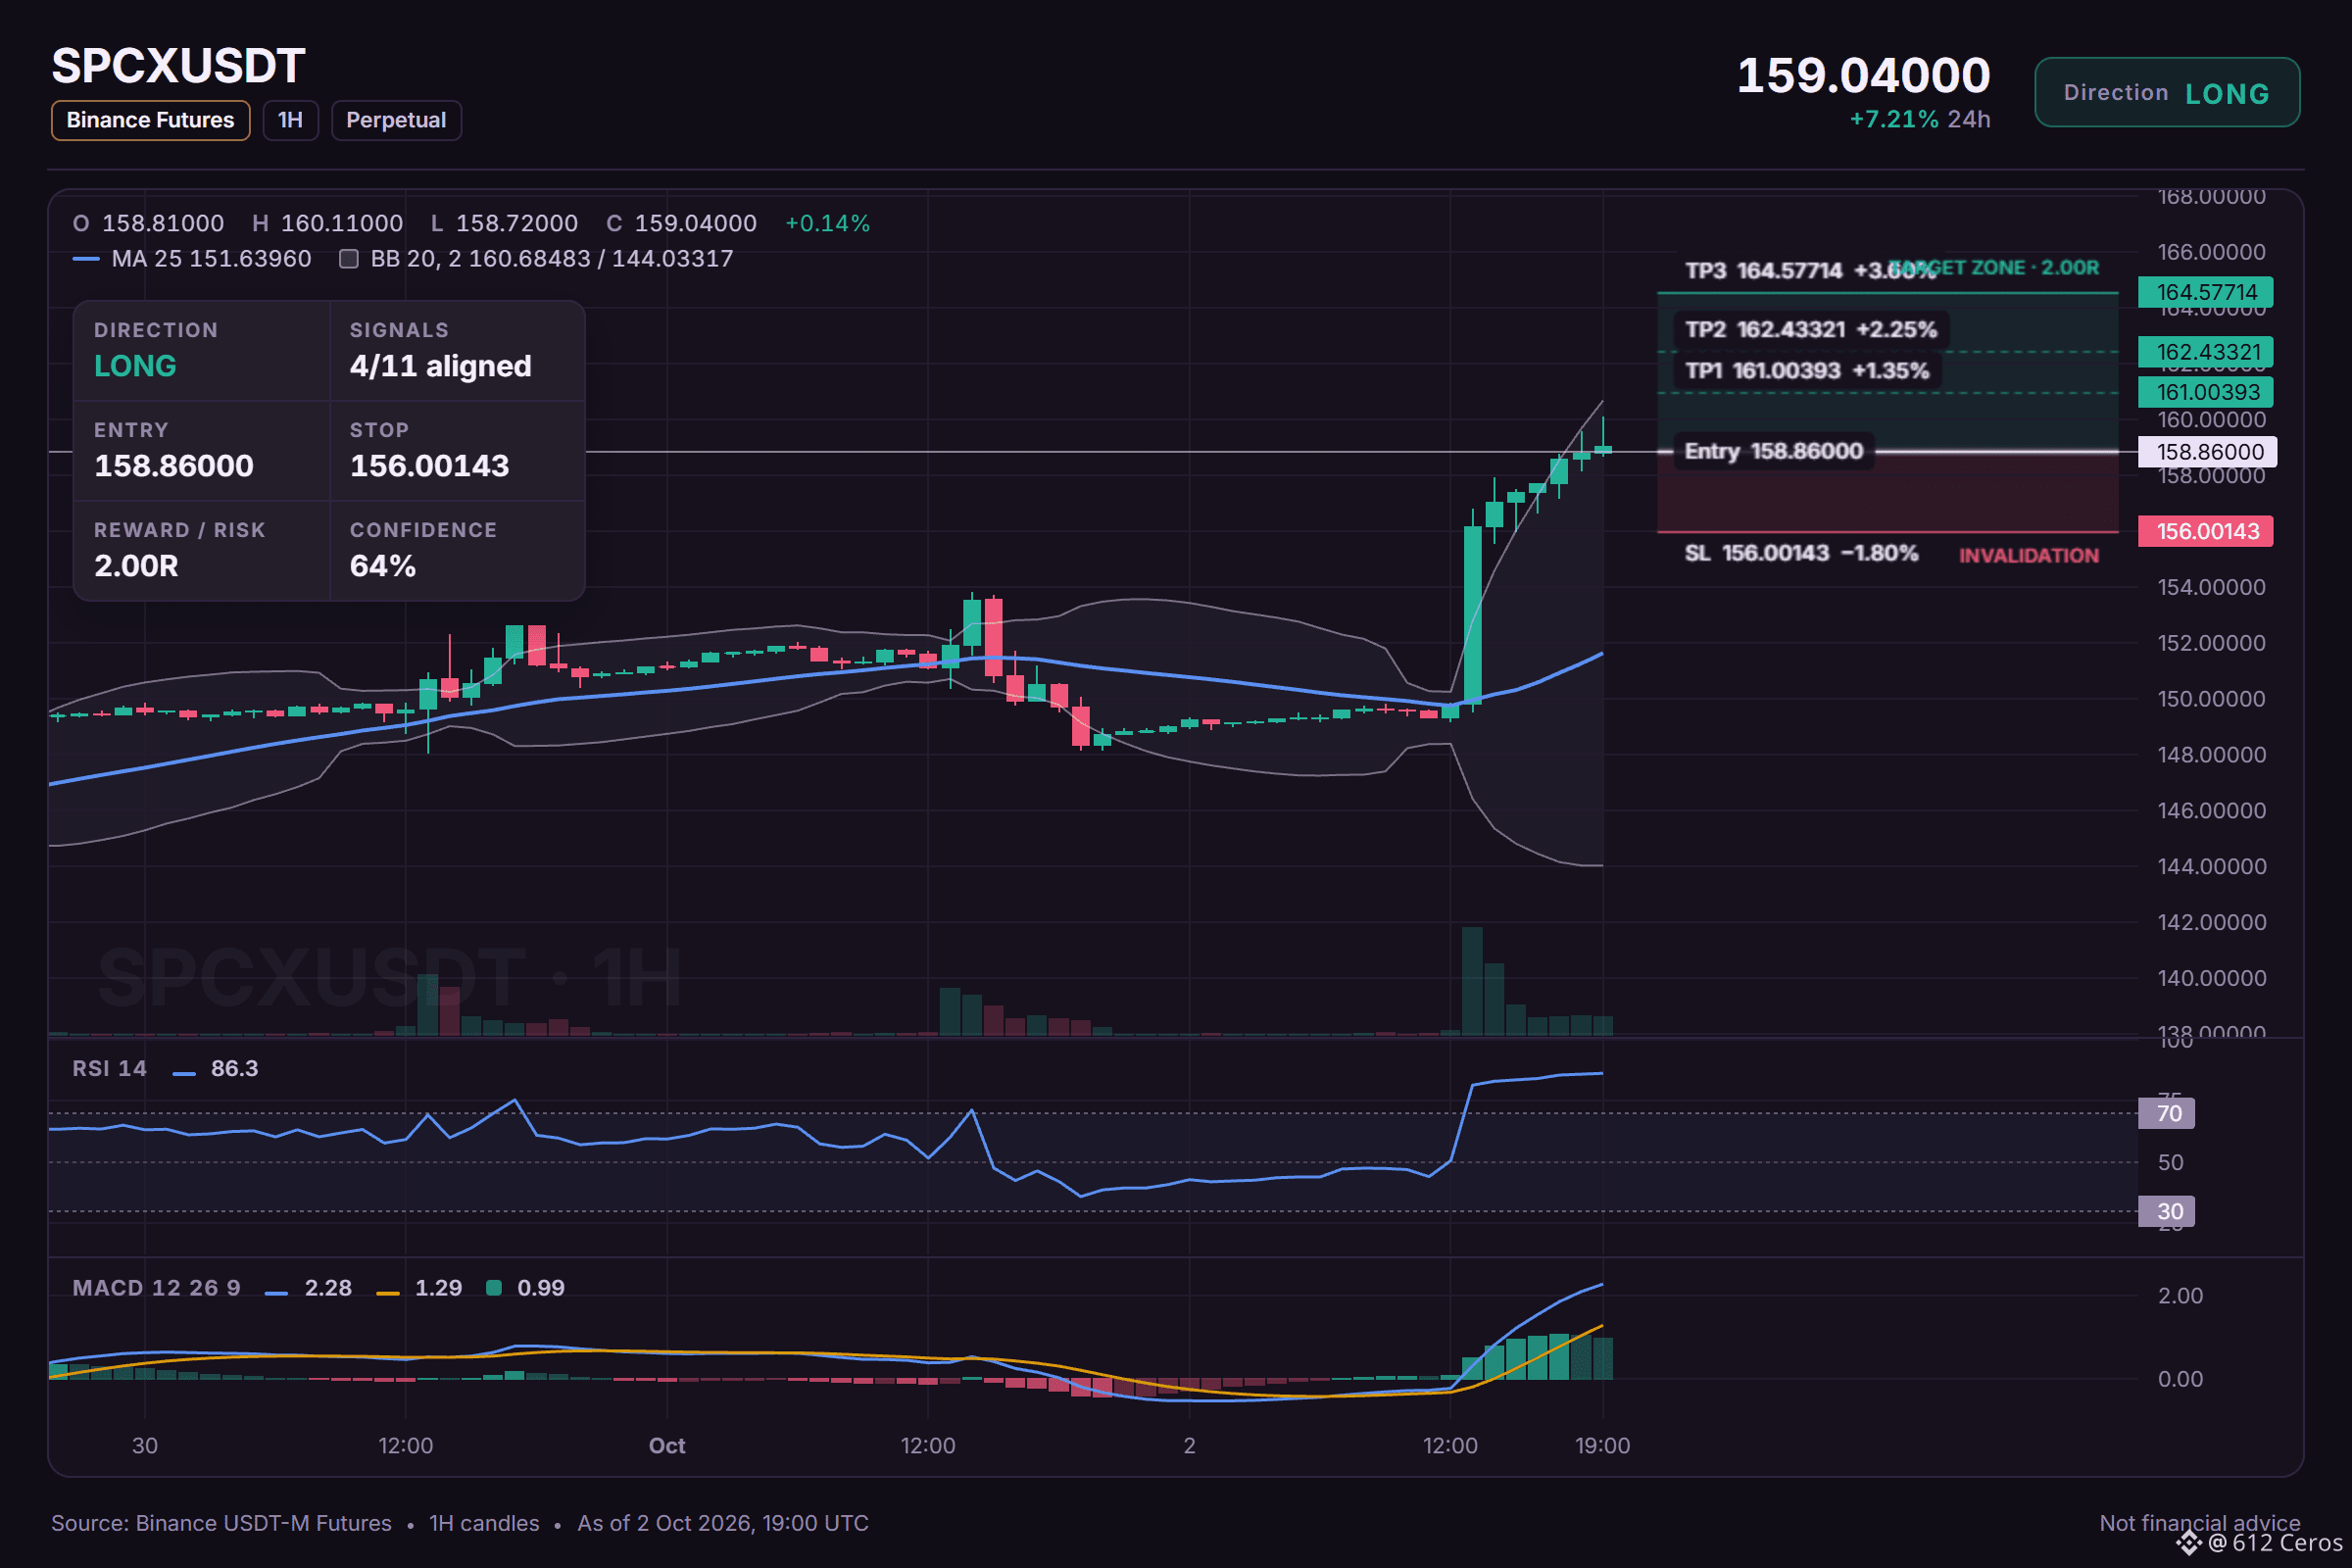
Bias: LONG · Leaning
Entry: 158.68402 – 159.03598
TP1: 161.00393 (+1.3%)
TP2: 162.43321 (+2.2%)
TP3: 164.57714 (+3.6%)
SL: 156.00143 (-1.8%)
Plan: enter only inside the zone, take half at TP1, then move the stop to entry.
Note: moderate conviction only, keep size light.
Why LONG? Leaning call, 4/11 signals agree, 1 against, 6 undecided.
• 4h trend: price > EMA50 > EMA200, bullish stack → the swing trend is up
• 1h trend: price > EMA50 > EMA200, bullish stack → the short-term trend is up
• Trend strength (ADX/DI, 15m): ADX 56.7 with buyers in control (DI+ 35.4 vs DI− 8.4) → buyers are driving the move
Risk: 4h RSI: 77.2, overbought: strong but stretched → price ran hot, pullbacks are common from here
Why I like it:
The 4h and 1h trends are both bullish stacks, and SPCX is outperforming BTC by 7.24%. Yet both RSI readings are overbought and price sits 5.9 ATR above the 1h EMA50, so a pullback is likely. Conviction is moderate.
Where would you place your stop below the entry range?
Full setup on the chart below.
{future}(SPCXUSDT)
📲 Want more of my latest signals? Join me here:
[https://app.binance.com/uni-qr/D26WbL9t](https://app.binance.com/uni-qr/D26WbL9t)
⚠️ Personal market analysis only. NFA — manage risk and DYOR.
Educational content, not investment advice or a recommendation to buy, sell, deposit, or withdraw any asset. No paid promotion or referral/affiliate links.
SPCX has momentum, but it is stretched
🟢 LONG $SPCX /USDT: expecting price to go UP
Bias: LONG · Leaning
Entry: 158.68402 – 159.03598
TP1: 161.00393 (+1.3%)
TP2: 162.43321 (+2.2%)
TP3: 164.57714 (+3.6%)
SL: 156.00143 (-1.8%)
Plan: enter only inside the zone, take half at TP1, then move the stop to entry.
Note: moderate conviction only, keep size light.
Why LONG? Leaning call, 4/11 signals agree, 1 against, 6 undecided.
• 4h trend: price > EMA50 > EMA200, bullish stack → the swing trend is up
• 1h trend: price > EMA50 > EMA200, bullish stack → the short-term trend is up
• Trend strength (ADX/DI, 15m): ADX 56.7 with buyers in control (DI+ 35.4 vs DI− 8.4) → buyers are driving the move
Risk: 4h RSI: 77.2, overbought: strong but stretched → price ran hot, pullbacks are common from here
Why I like it:
The 4h and 1h trends are both bullish stacks, and SPCX is outperforming BTC by 7.24%. Yet both RSI readings are overbought and price sits 5.9 ATR above the 1h EMA50, so a pullback is likely. Conviction is moderate.
Where would you place your stop below the entry range?
Full setup on the chart below.
📲 Want more of my latest signals? Join me here:
https://app.binance.com/uni-qr/D26WbL9t
⚠️ Personal market analysis only. NFA — manage risk and DYOR.
Educational content, not investment advice or a recommendation to buy, sell, deposit, or withdraw any asset. No paid promotion or referral/affiliate links.
🟢 LONG $SPCX /USDT: expecting price to go UP
Bias: LONG · Leaning
Entry: 158.68402 – 159.03598
TP1: 161.00393 (+1.3%)
TP2: 162.43321 (+2.2%)
TP3: 164.57714 (+3.6%)
SL: 156.00143 (-1.8%)
Plan: enter only inside the zone, take half at TP1, then move the stop to entry.
Note: moderate conviction only, keep size light.
Why LONG? Leaning call, 4/11 signals agree, 1 against, 6 undecided.
• 4h trend: price > EMA50 > EMA200, bullish stack → the swing trend is up
• 1h trend: price > EMA50 > EMA200, bullish stack → the short-term trend is up
• Trend strength (ADX/DI, 15m): ADX 56.7 with buyers in control (DI+ 35.4 vs DI− 8.4) → buyers are driving the move
Risk: 4h RSI: 77.2, overbought: strong but stretched → price ran hot, pullbacks are common from here
Why I like it:
The 4h and 1h trends are both bullish stacks, and SPCX is outperforming BTC by 7.24%. Yet both RSI readings are overbought and price sits 5.9 ATR above the 1h EMA50, so a pullback is likely. Conviction is moderate.
Where would you place your stop below the entry range?
Full setup on the chart below.
📲 Want more of my latest signals? Join me here:
https://app.binance.com/uni-qr/D26WbL9t
⚠️ Personal market analysis only. NFA — manage risk and DYOR.
Educational content, not investment advice or a recommendation to buy, sell, deposit, or withdraw any asset. No paid promotion or referral/affiliate links.
782
·
--
Baissier
XRP is not stuck in a myth of easy direction
🔴 SHORT $XRP /USDT: expecting price to go DOWN
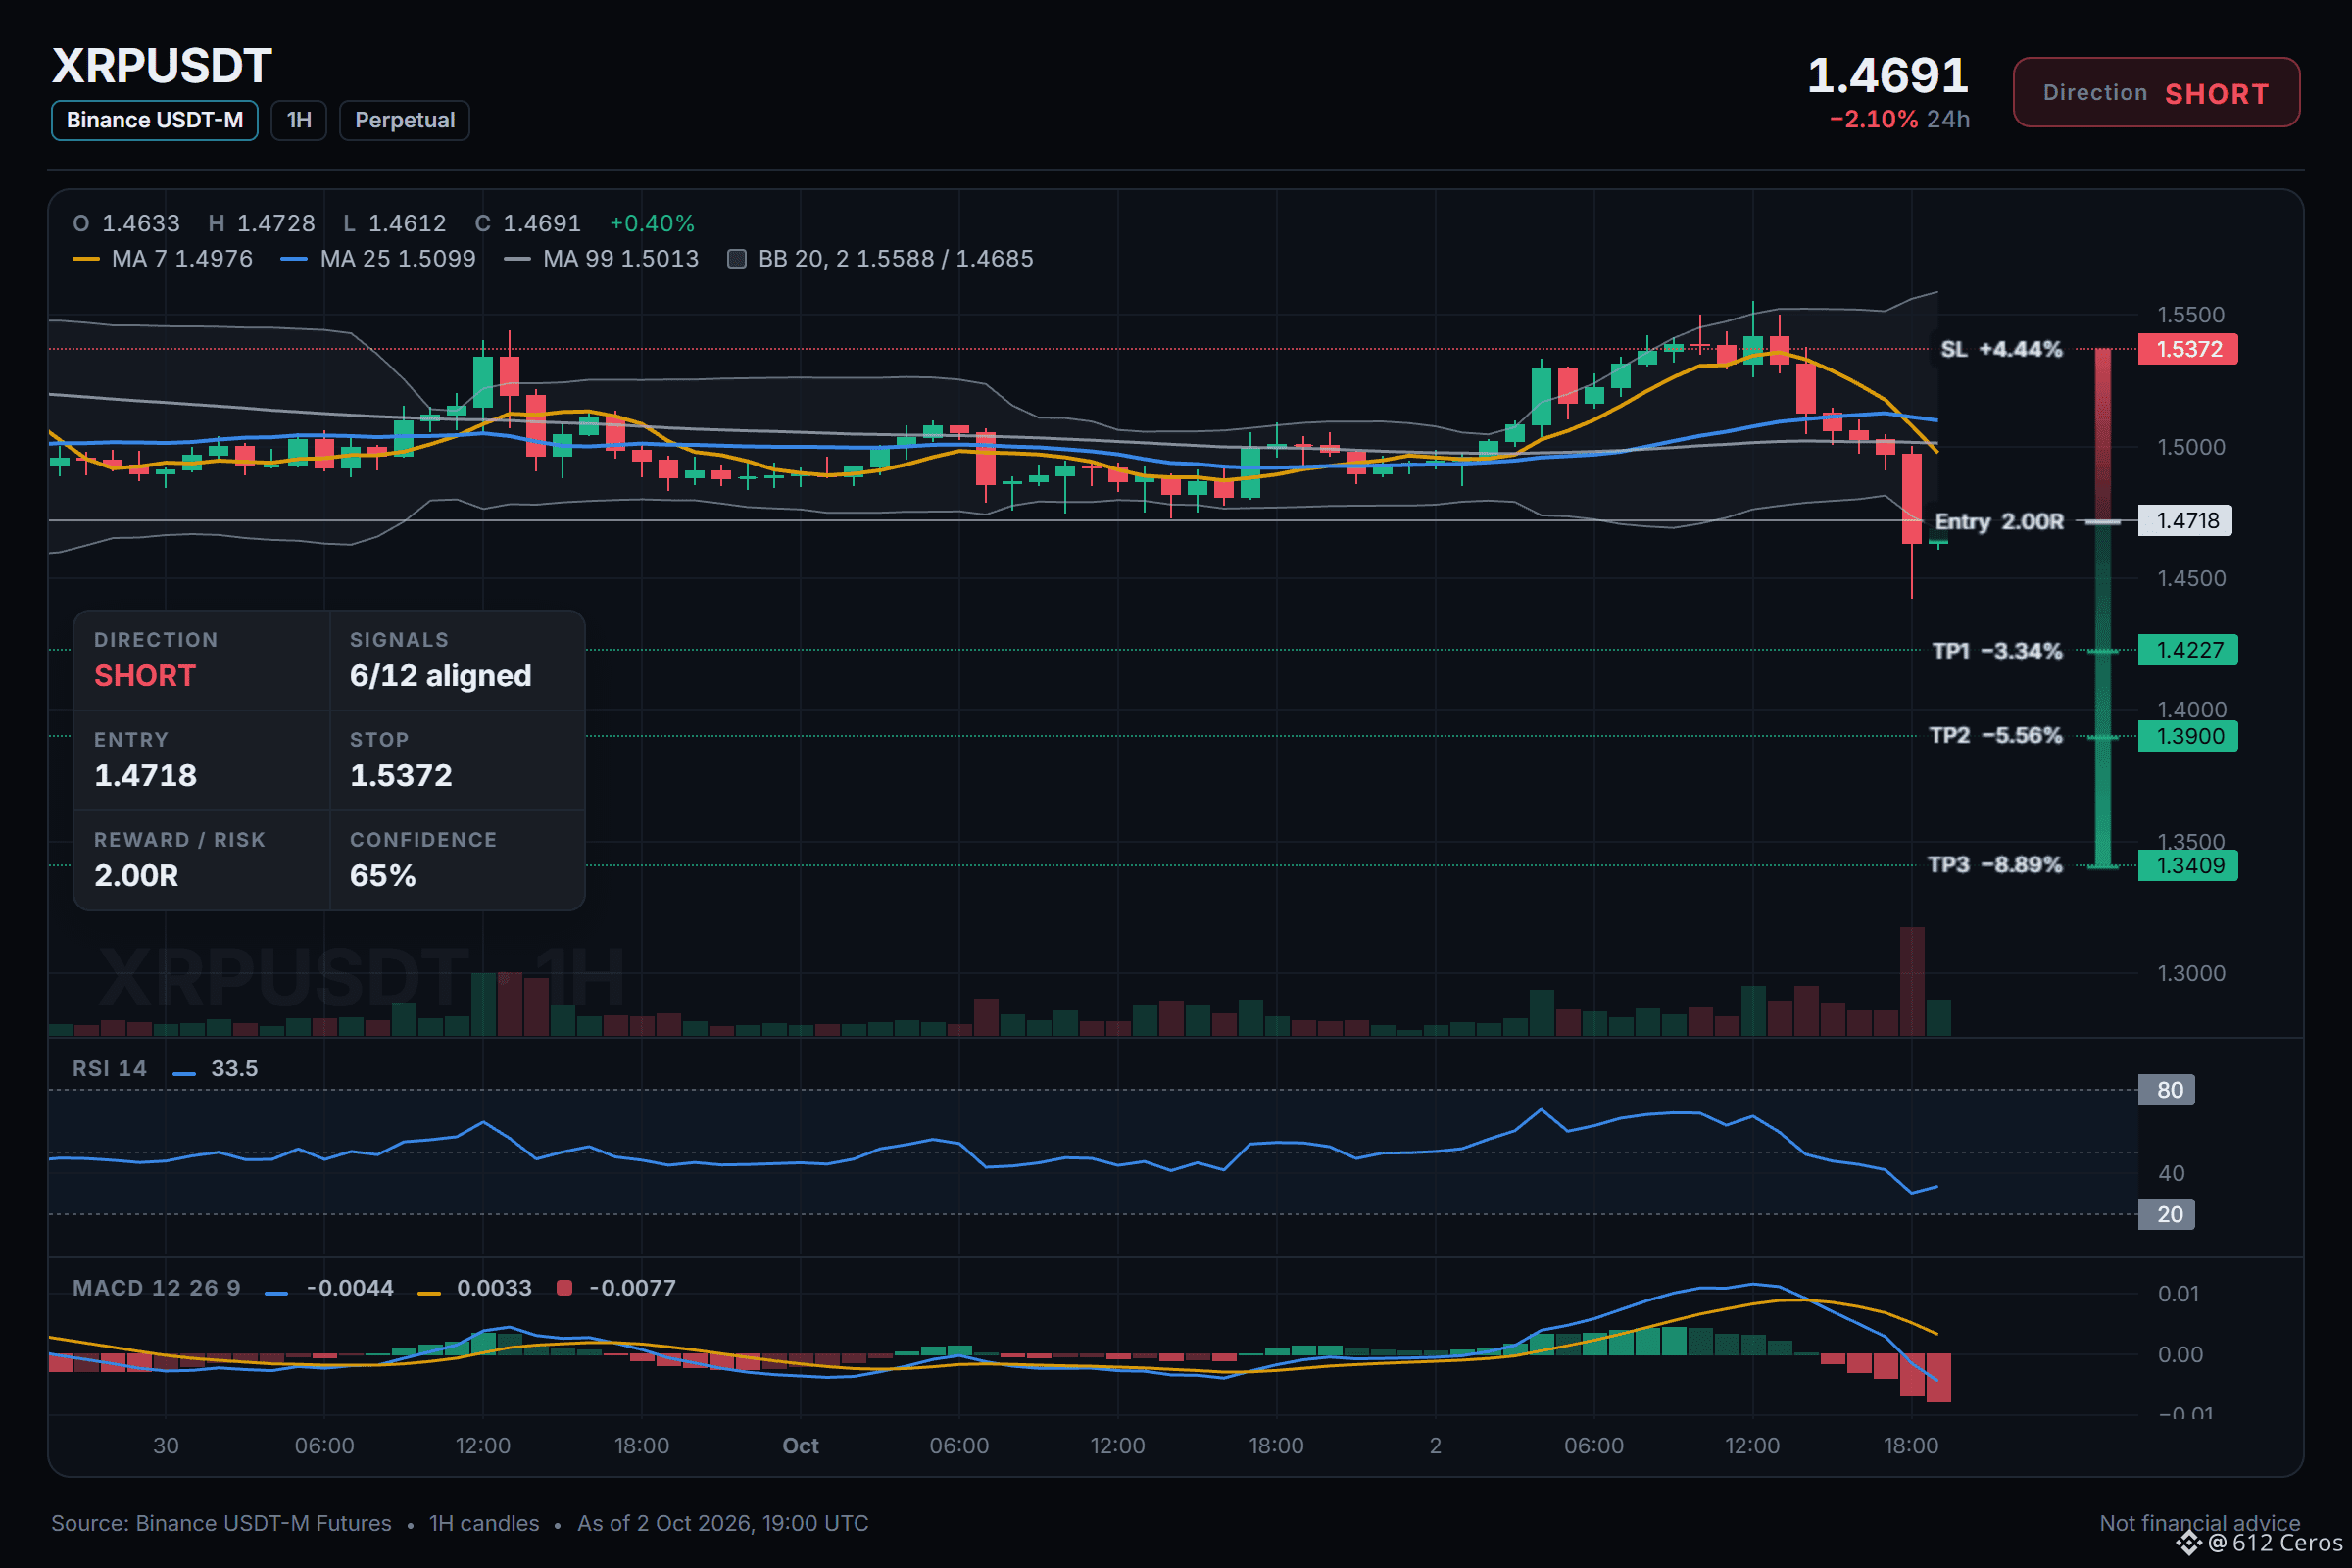
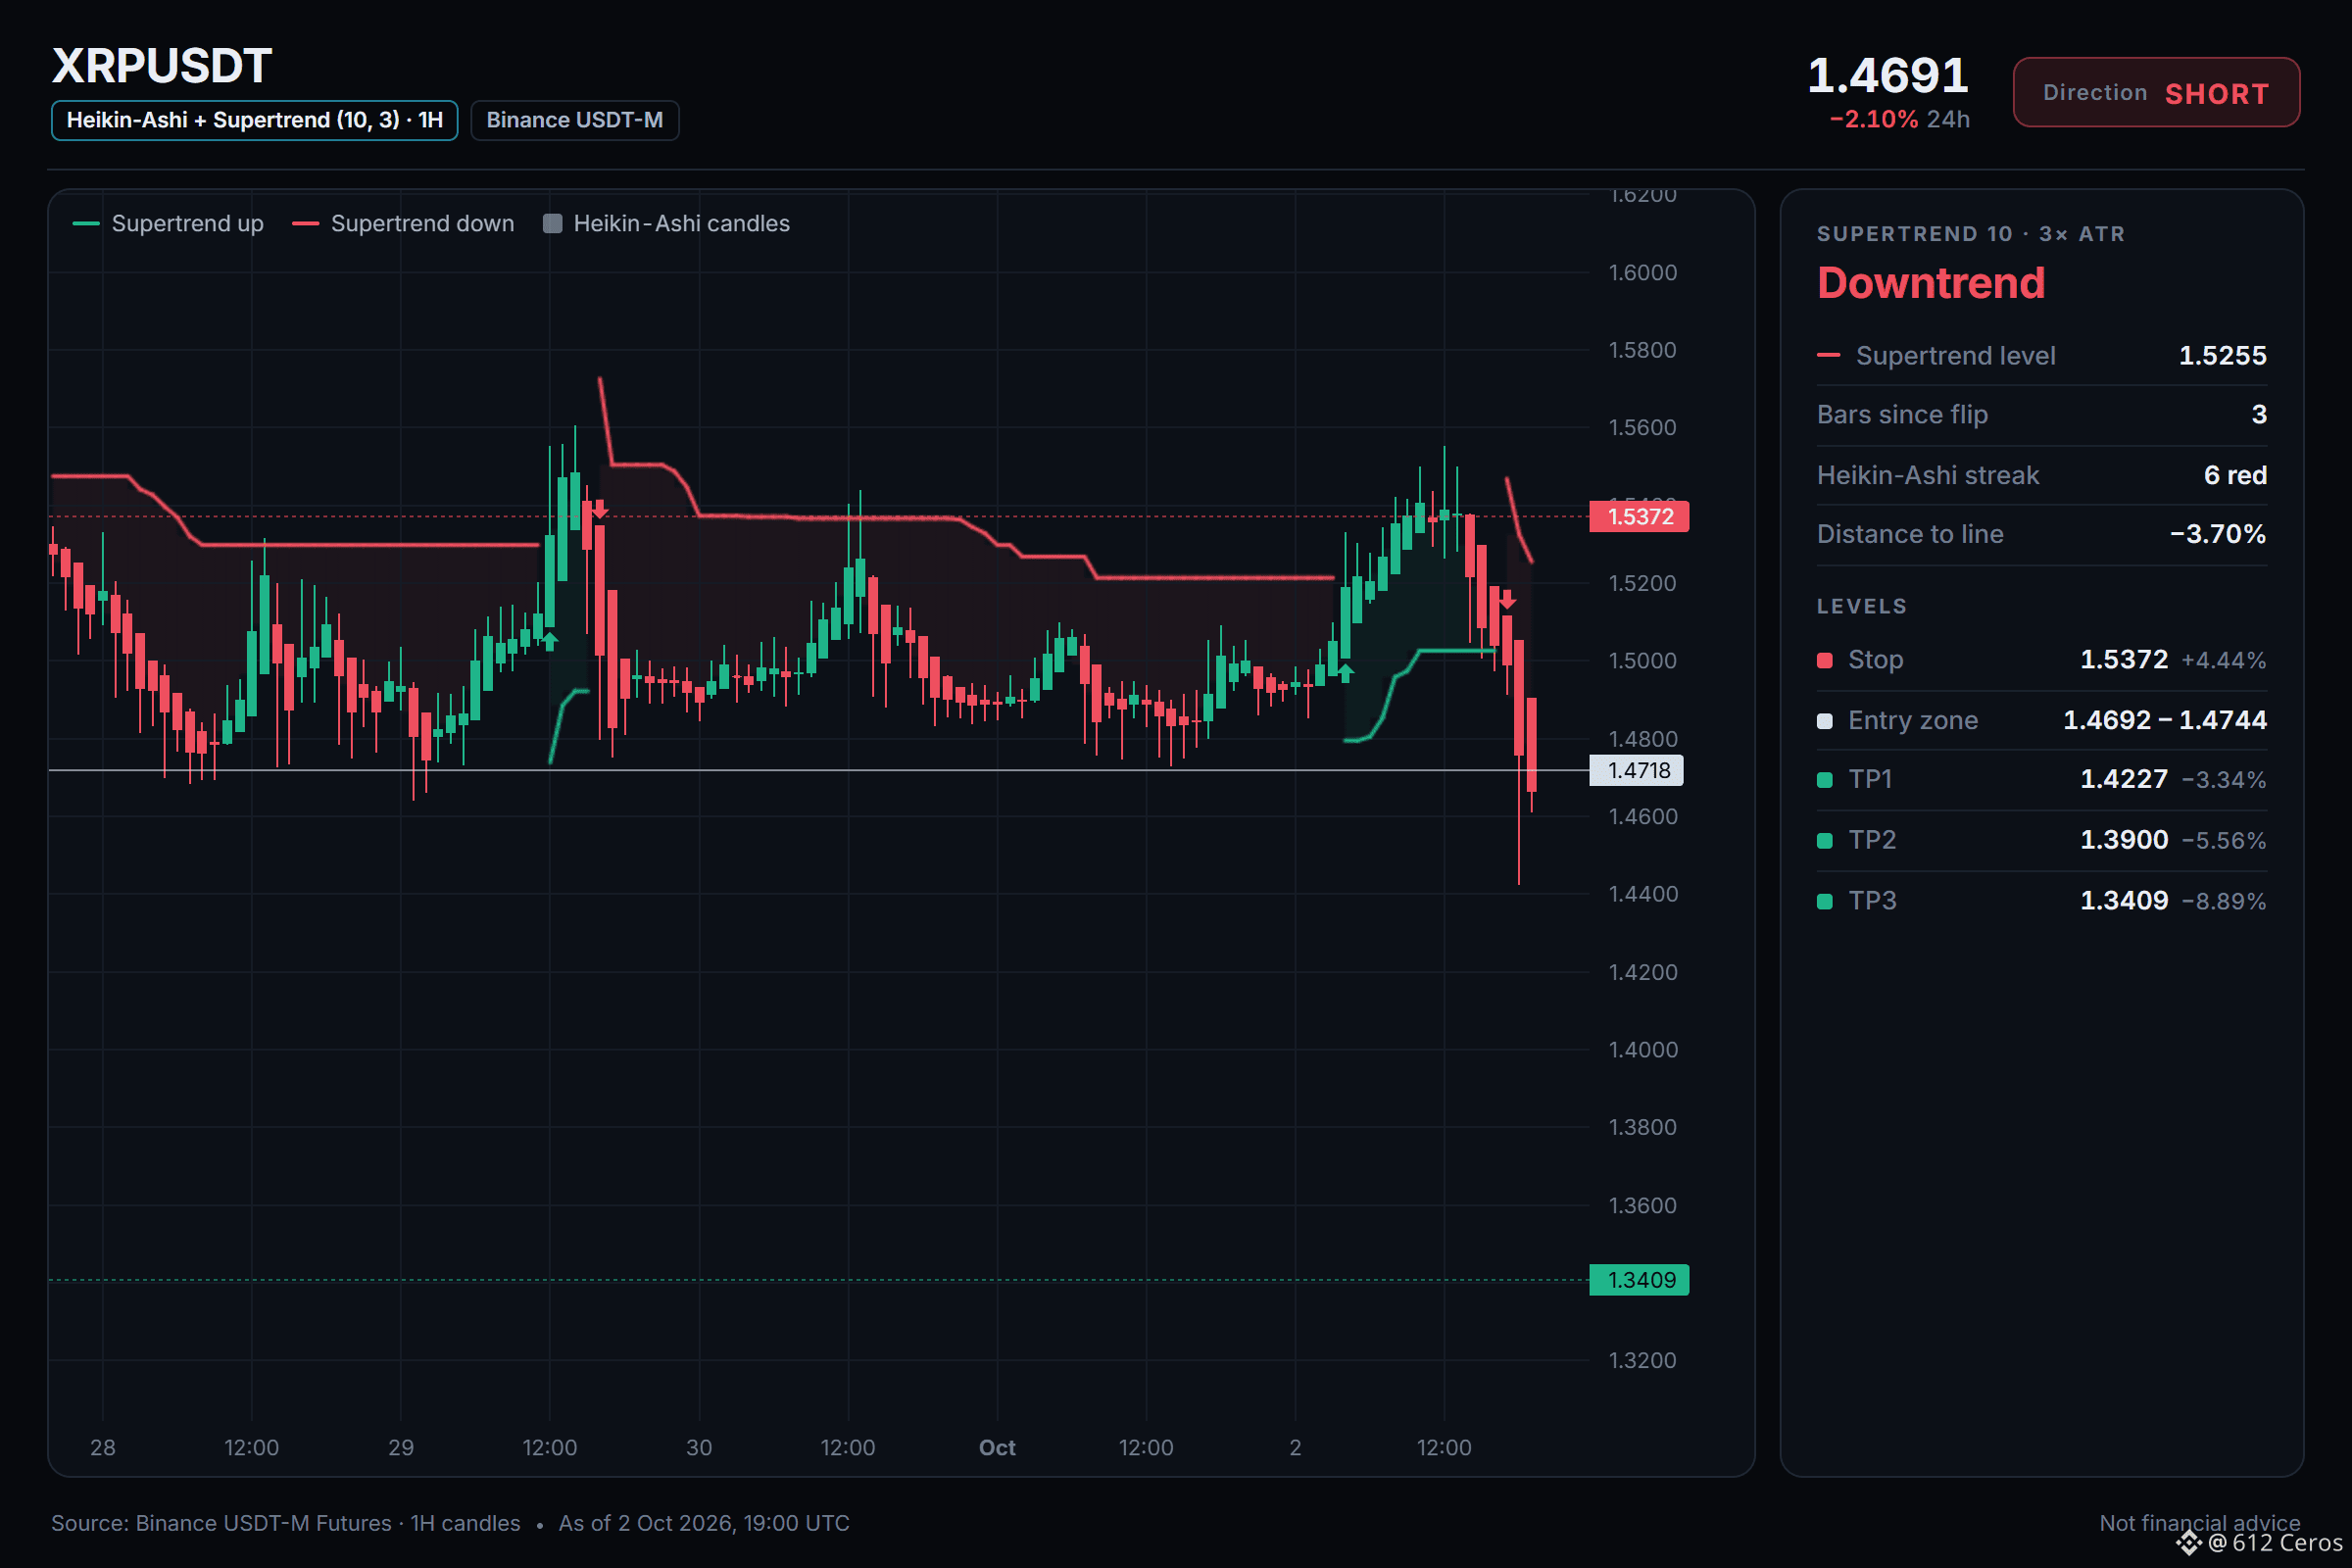
Bias: SHORT · Leaning
Entry: 1.4692 – 1.4744
TP1: 1.4227 (-3.3%)
TP2: 1.3900 (-5.6%)
TP3: 1.3409 (-8.9%)
SL: 1.5372 (+4.4%)
Plan: enter only inside the zone, take half at TP1, then move the stop to entry.
Caution: counter-trend setup against the bigger trend, only 6 signals confirm it. Size down, respect the stop.
Why SHORT? Leaning call, 6/12 signals agree, 1 against, 5 undecided.
• 1h trend: price < EMA50 < EMA200, bearish stack → the short-term trend is down
• Trend strength (ADX/DI, 15m): ADX 42.3 with sellers in control (DI+ 12.4 vs DI− 33.8) → sellers are driving the move
• BTC backdrop: BTC trend is bearish and correlation is 0.74 → BTC is falling and this coin tends to follow
Risk: Daily trend: price > EMA50 > EMA200, bullish stack → the big-picture trend is up
My read on XRP today
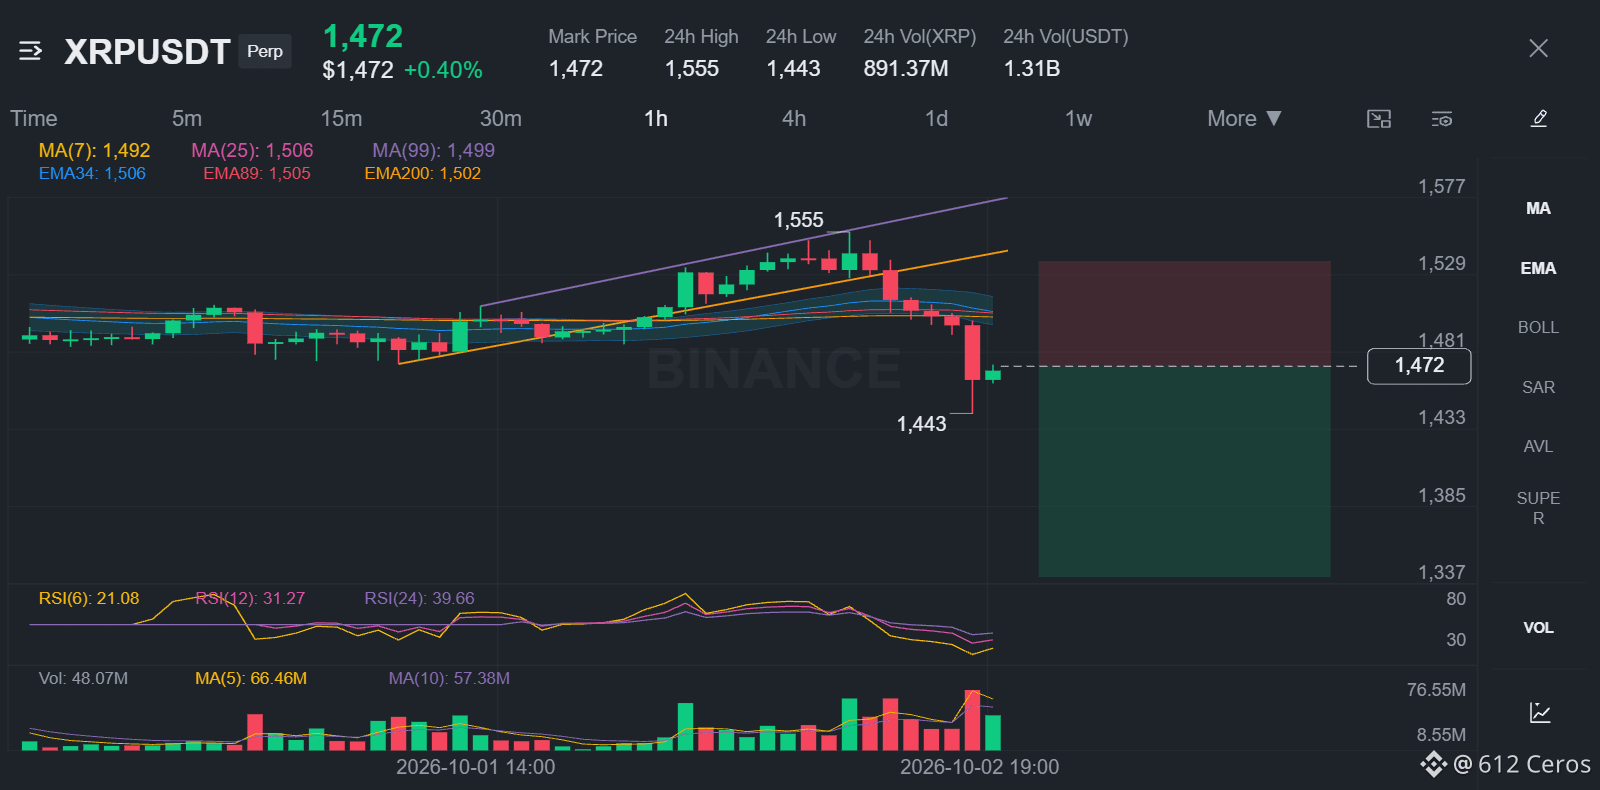
I'm watching XRP on the 1h chart, aiming to short the current pullback inside the 1.4692-1.4744 zone. The 1h trend is bearish with price below the EMA50 and EMA200, and the RSI at 31.58 shows sellers are in control. This is a counter-trend reversal bet against the higher-timeframe bullish daily trend, so I am sizing down and respecting the stop at 1.5372. The main risk is the daily bullish stack, meaning the bigger picture is still up. Conviction is moderate because only 6 out of 12 signals align.
Where is your level if you want to fade the daily bullish stack and take the opposite side?
Chart with every level below.
{future}(XRPUSDT)
📲 Want more of my latest signals? Join me here:
[https://app.binance.com/uni-qr/D26WbL9t](https://app.binance.com/uni-qr/D26WbL9t)
⚠️ Personal market analysis only. NFA — manage risk and DYOR.
Educational content, not investment advice or a recommendation to buy, sell, deposit, or withdraw any asset. No paid promotion or referral/affiliate links.
XRP is not stuck in a myth of easy direction
🔴 SHORT $XRP /USDT: expecting price to go DOWN
Bias: SHORT · Leaning
Entry: 1.4692 – 1.4744
TP1: 1.4227 (-3.3%)
TP2: 1.3900 (-5.6%)
TP3: 1.3409 (-8.9%)
SL: 1.5372 (+4.4%)
Plan: enter only inside the zone, take half at TP1, then move the stop to entry.
Caution: counter-trend setup against the bigger trend, only 6 signals confirm it. Size down, respect the stop.
Why SHORT? Leaning call, 6/12 signals agree, 1 against, 5 undecided.
• 1h trend: price < EMA50 < EMA200, bearish stack → the short-term trend is down
• Trend strength (ADX/DI, 15m): ADX 42.3 with sellers in control (DI+ 12.4 vs DI− 33.8) → sellers are driving the move
• BTC backdrop: BTC trend is bearish and correlation is 0.74 → BTC is falling and this coin tends to follow
Risk: Daily trend: price > EMA50 > EMA200, bullish stack → the big-picture trend is up
My read on XRP today
I'm watching XRP on the 1h chart, aiming to short the current pullback inside the 1.4692-1.4744 zone. The 1h trend is bearish with price below the EMA50 and EMA200, and the RSI at 31.58 shows sellers are in control. This is a counter-trend reversal bet against the higher-timeframe bullish daily trend, so I am sizing down and respecting the stop at 1.5372. The main risk is the daily bullish stack, meaning the bigger picture is still up. Conviction is moderate because only 6 out of 12 signals align.
Where is your level if you want to fade the daily bullish stack and take the opposite side?
Chart with every level below.
📲 Want more of my latest signals? Join me here:
https://app.binance.com/uni-qr/D26WbL9t
⚠️ Personal market analysis only. NFA — manage risk and DYOR.
Educational content, not investment advice or a recommendation to buy, sell, deposit, or withdraw any asset. No paid promotion or referral/affiliate links.
🔴 SHORT $XRP /USDT: expecting price to go DOWN
Bias: SHORT · Leaning
Entry: 1.4692 – 1.4744
TP1: 1.4227 (-3.3%)
TP2: 1.3900 (-5.6%)
TP3: 1.3409 (-8.9%)
SL: 1.5372 (+4.4%)
Plan: enter only inside the zone, take half at TP1, then move the stop to entry.
Caution: counter-trend setup against the bigger trend, only 6 signals confirm it. Size down, respect the stop.
Why SHORT? Leaning call, 6/12 signals agree, 1 against, 5 undecided.
• 1h trend: price < EMA50 < EMA200, bearish stack → the short-term trend is down
• Trend strength (ADX/DI, 15m): ADX 42.3 with sellers in control (DI+ 12.4 vs DI− 33.8) → sellers are driving the move
• BTC backdrop: BTC trend is bearish and correlation is 0.74 → BTC is falling and this coin tends to follow
Risk: Daily trend: price > EMA50 > EMA200, bullish stack → the big-picture trend is up
My read on XRP today
I'm watching XRP on the 1h chart, aiming to short the current pullback inside the 1.4692-1.4744 zone. The 1h trend is bearish with price below the EMA50 and EMA200, and the RSI at 31.58 shows sellers are in control. This is a counter-trend reversal bet against the higher-timeframe bullish daily trend, so I am sizing down and respecting the stop at 1.5372. The main risk is the daily bullish stack, meaning the bigger picture is still up. Conviction is moderate because only 6 out of 12 signals align.
Where is your level if you want to fade the daily bullish stack and take the opposite side?
Chart with every level below.
📲 Want more of my latest signals? Join me here:
https://app.binance.com/uni-qr/D26WbL9t
⚠️ Personal market analysis only. NFA — manage risk and DYOR.
Educational content, not investment advice or a recommendation to buy, sell, deposit, or withdraw any asset. No paid promotion or referral/affiliate links.
1
621
·
--
Baissier
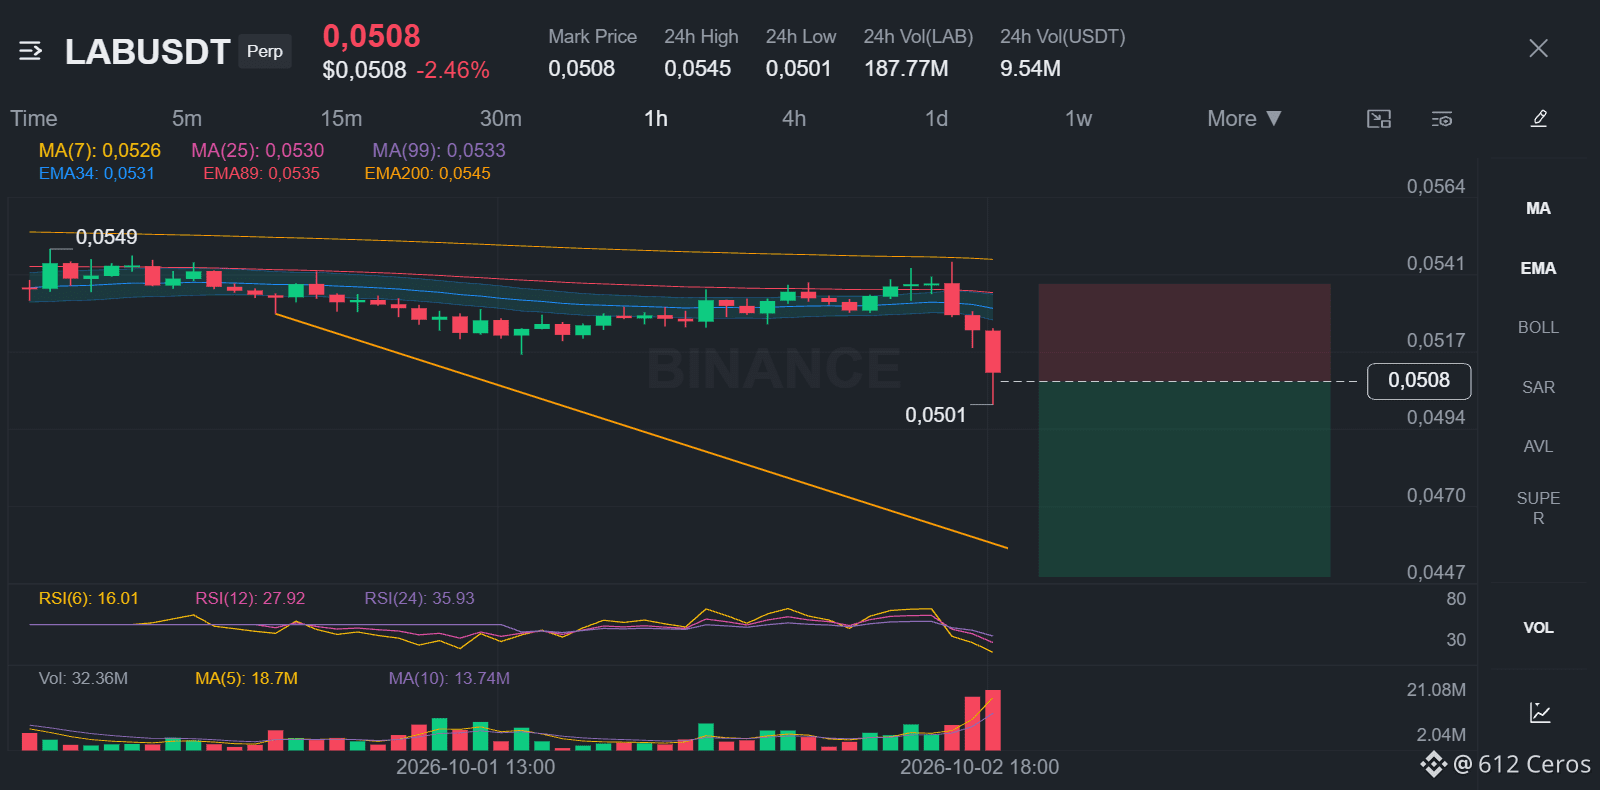
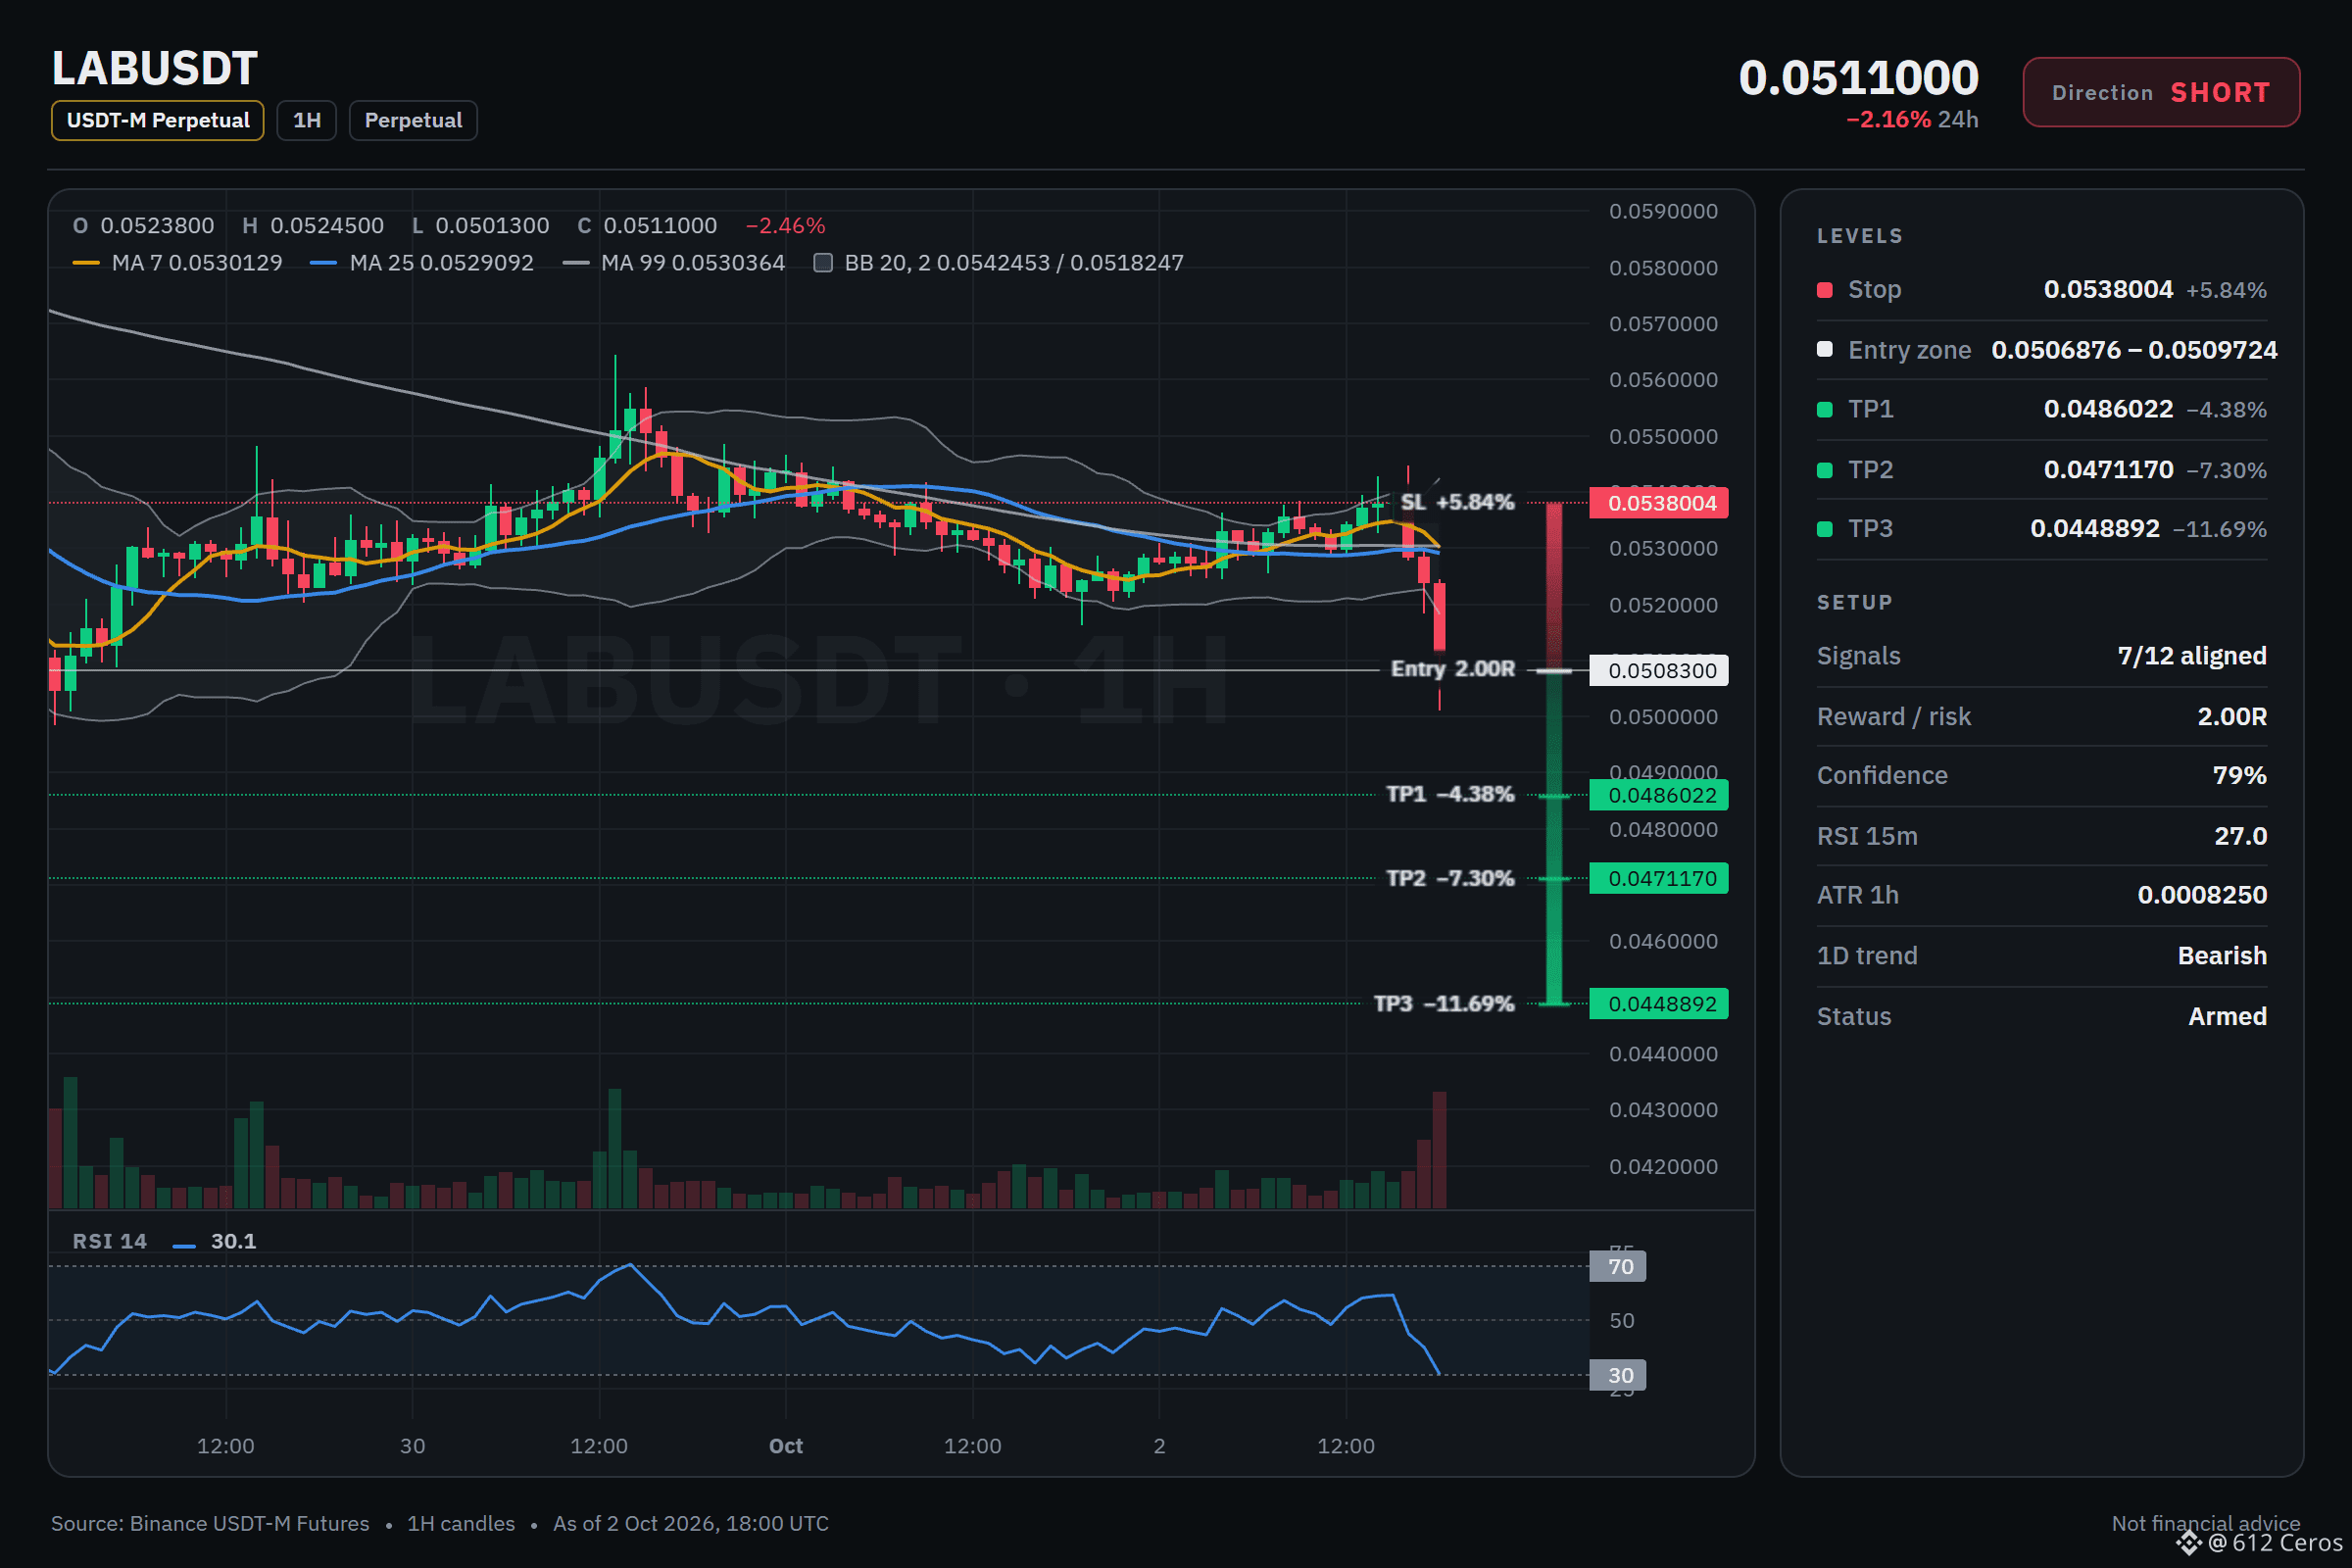
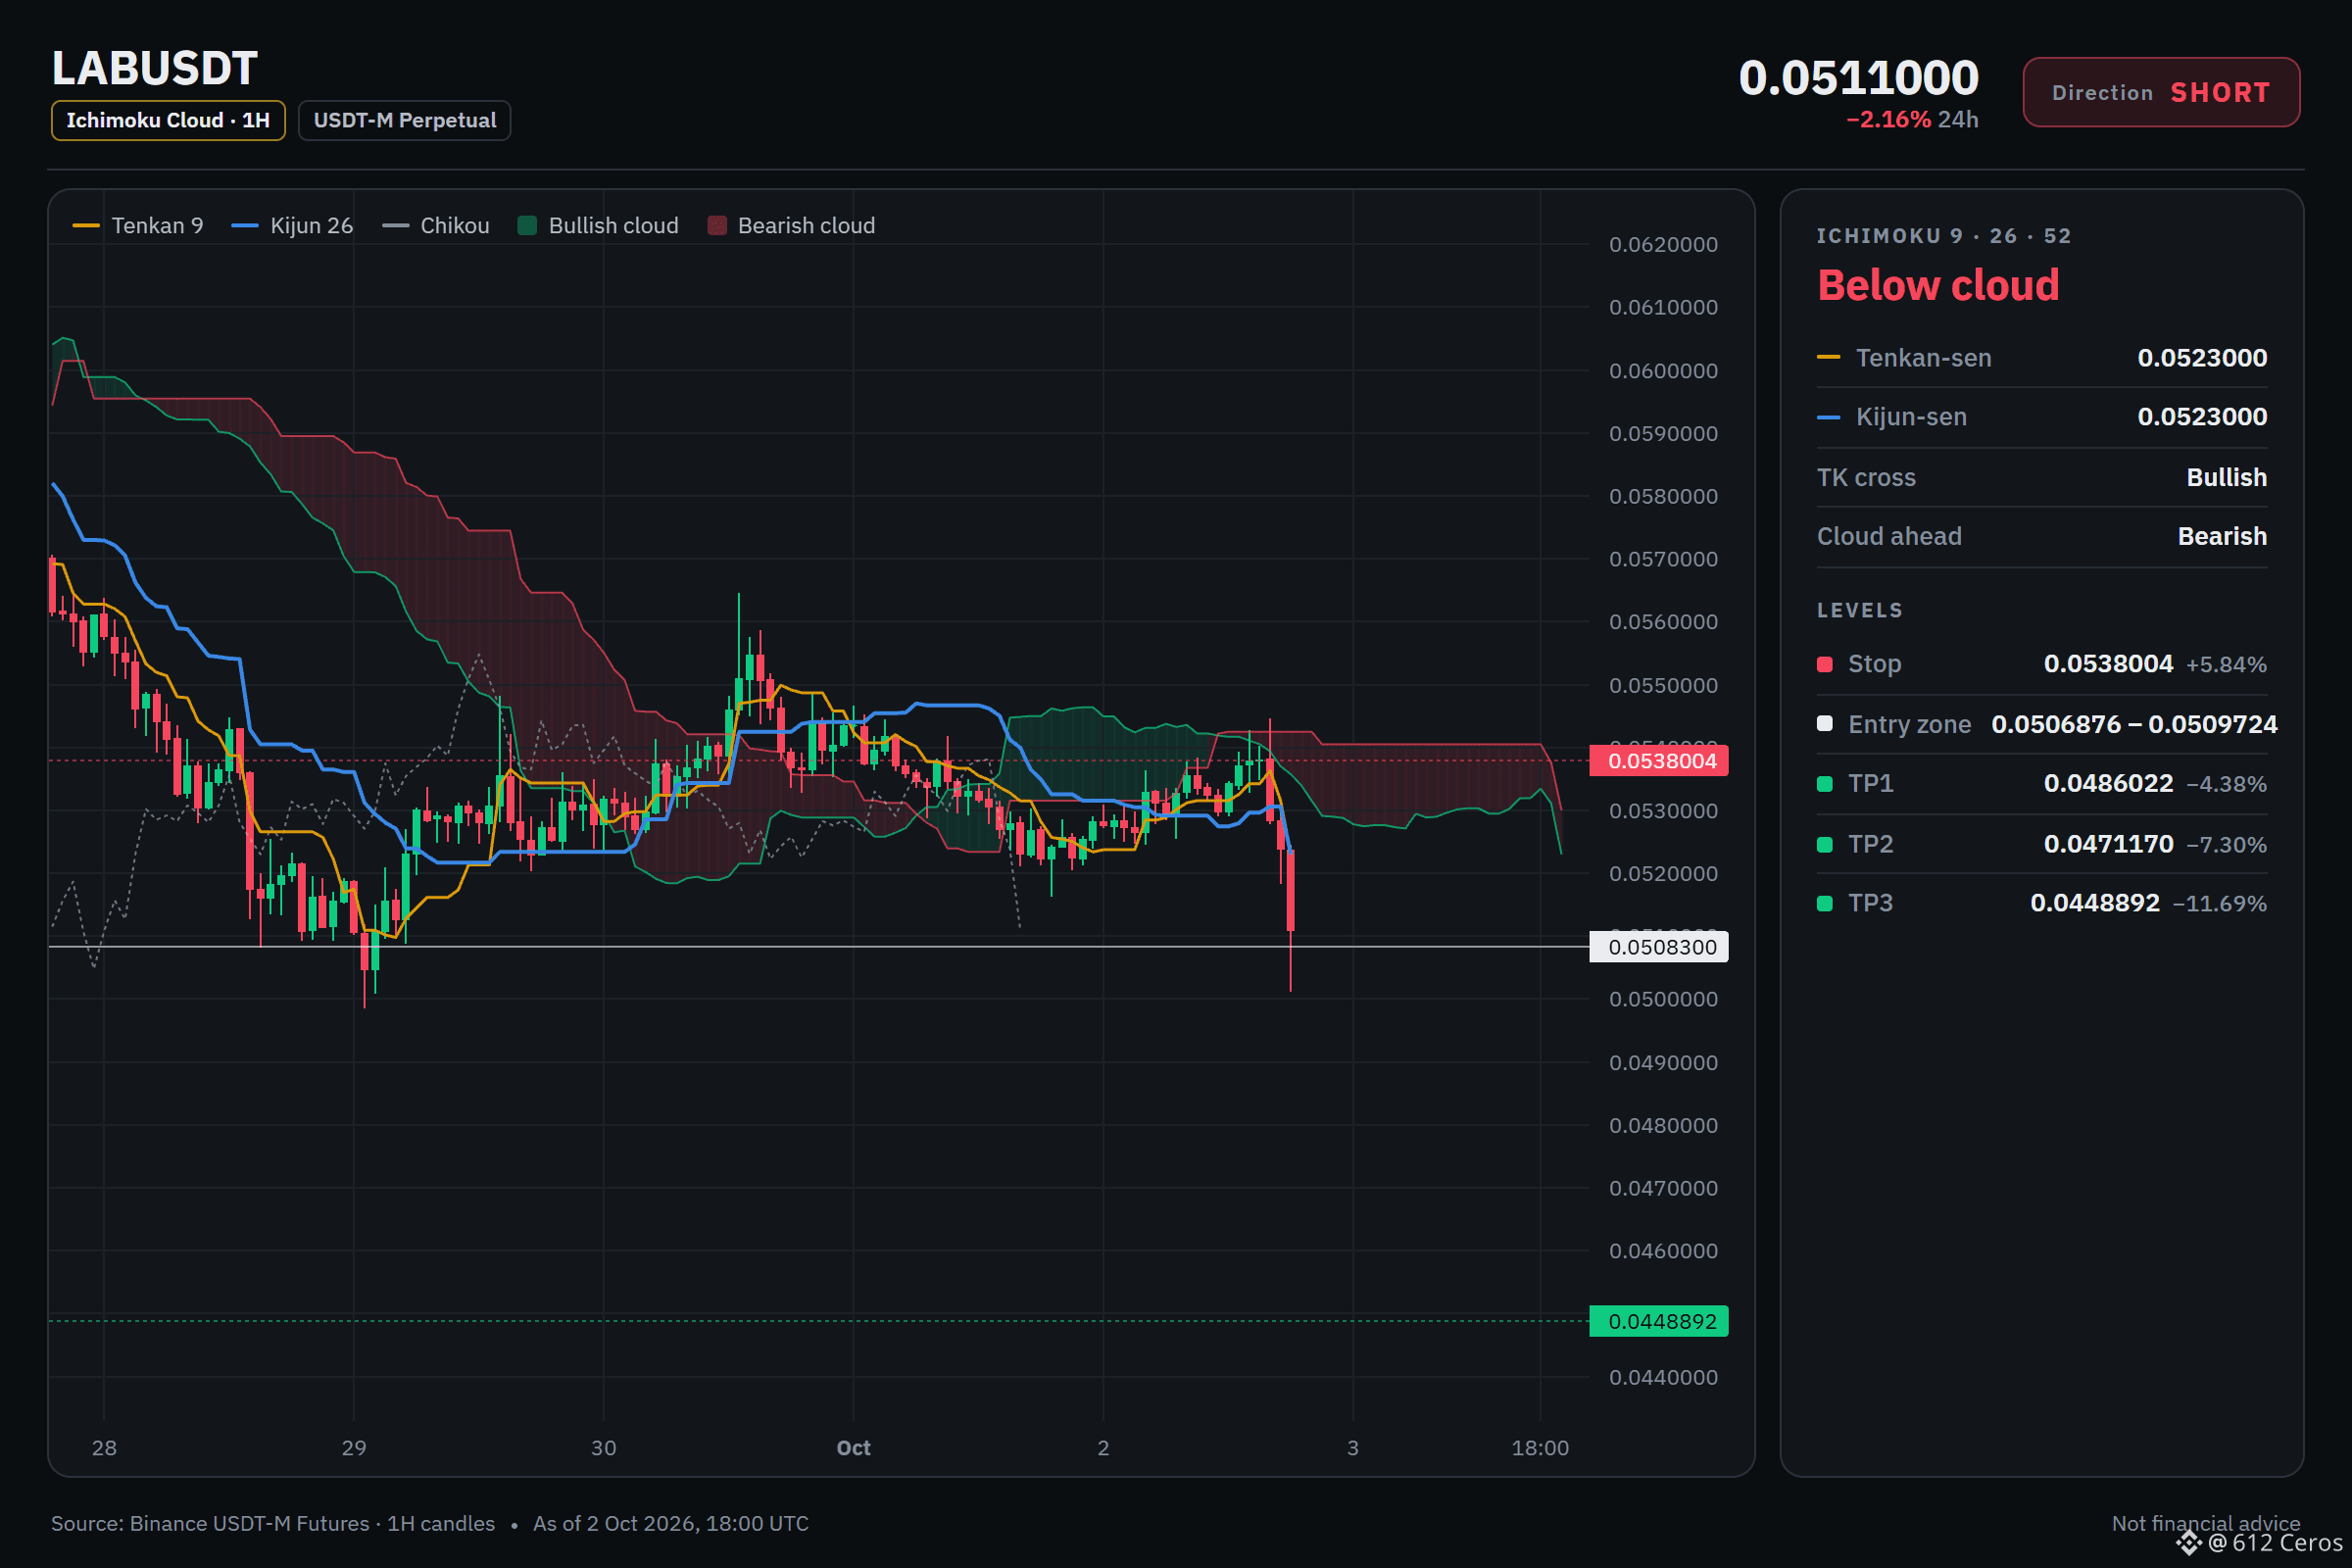
The daily bearish stack keeps LAB pressed below key moving averages.
🔴 SHORT $LAB /USDT: expecting price to go DOWN
Bias: SHORT · Strong
Entry: 0.0506876 – 0.0509724
TP1: 0.0486022 (-4.4%)
TP2: 0.0471170 (-7.3%)
TP3: 0.0448892 (-11.7%)
SL: 0.0538004 (+5.8%)
Plan: enter only inside the zone, take half at TP1, then move the stop to entry.
Why SHORT? Strong call, 7/12 signals agree, 0 against, 5 undecided.
• Daily trend: price < EMA50 < EMA200, bearish stack → the big-picture trend is down
• 4h trend: price < EMA50 < EMA200, bearish stack → the swing trend is down
• 1h trend: price < EMA50 < EMA200, bearish stack → the short-term trend is down
Q: Why short when the 4h trend already points down?
A: The 4h trend shows price below the 4h EMA50 and EMA200, confirming a bearish swing trend.
Q: What if sellers lose control and LAB bounces?
A: The invalidation level sits at 0.0538004, above the entry zone, so a break there would signal a failed setup.
Where would you place your stop if you took the opposite side, and why?
Full setup on the chart below.
{future}(LABUSDT)
📲 Want more of my latest signals? Join me here:
[https://app.binance.com/uni-qr/D26WbL9t](https://app.binance.com/uni-qr/D26WbL9t)
⚠️ Personal market analysis only. NFA — manage risk and DYOR.
Educational content, not investment advice or a recommendation to buy, sell, deposit, or withdraw any asset. No paid promotion or referral/affiliate links.
The daily bearish stack keeps LAB pressed below key moving averages.
🔴 SHORT $LAB /USDT: expecting price to go DOWN
Bias: SHORT · Strong
Entry: 0.0506876 – 0.0509724
TP1: 0.0486022 (-4.4%)
TP2: 0.0471170 (-7.3%)
TP3: 0.0448892 (-11.7%)
SL: 0.0538004 (+5.8%)
Plan: enter only inside the zone, take half at TP1, then move the stop to entry.
Why SHORT? Strong call, 7/12 signals agree, 0 against, 5 undecided.
• Daily trend: price < EMA50 < EMA200, bearish stack → the big-picture trend is down
• 4h trend: price < EMA50 < EMA200, bearish stack → the swing trend is down
• 1h trend: price < EMA50 < EMA200, bearish stack → the short-term trend is down
Q: Why short when the 4h trend already points down?
A: The 4h trend shows price below the 4h EMA50 and EMA200, confirming a bearish swing trend.
Q: What if sellers lose control and LAB bounces?
A: The invalidation level sits at 0.0538004, above the entry zone, so a break there would signal a failed setup.
Where would you place your stop if you took the opposite side, and why?
Full setup on the chart below.
📲 Want more of my latest signals? Join me here:
https://app.binance.com/uni-qr/D26WbL9t
⚠️ Personal market analysis only. NFA — manage risk and DYOR.
Educational content, not investment advice or a recommendation to buy, sell, deposit, or withdraw any asset. No paid promotion or referral/affiliate links.
🔴 SHORT $LAB /USDT: expecting price to go DOWN
Bias: SHORT · Strong
Entry: 0.0506876 – 0.0509724
TP1: 0.0486022 (-4.4%)
TP2: 0.0471170 (-7.3%)
TP3: 0.0448892 (-11.7%)
SL: 0.0538004 (+5.8%)
Plan: enter only inside the zone, take half at TP1, then move the stop to entry.
Why SHORT? Strong call, 7/12 signals agree, 0 against, 5 undecided.
• Daily trend: price < EMA50 < EMA200, bearish stack → the big-picture trend is down
• 4h trend: price < EMA50 < EMA200, bearish stack → the swing trend is down
• 1h trend: price < EMA50 < EMA200, bearish stack → the short-term trend is down
Q: Why short when the 4h trend already points down?
A: The 4h trend shows price below the 4h EMA50 and EMA200, confirming a bearish swing trend.
Q: What if sellers lose control and LAB bounces?
A: The invalidation level sits at 0.0538004, above the entry zone, so a break there would signal a failed setup.
Where would you place your stop if you took the opposite side, and why?
Full setup on the chart below.
📲 Want more of my latest signals? Join me here:
https://app.binance.com/uni-qr/D26WbL9t
⚠️ Personal market analysis only. NFA — manage risk and DYOR.
Educational content, not investment advice or a recommendation to buy, sell, deposit, or withdraw any asset. No paid promotion or referral/affiliate links.
726
·
--
Baissier
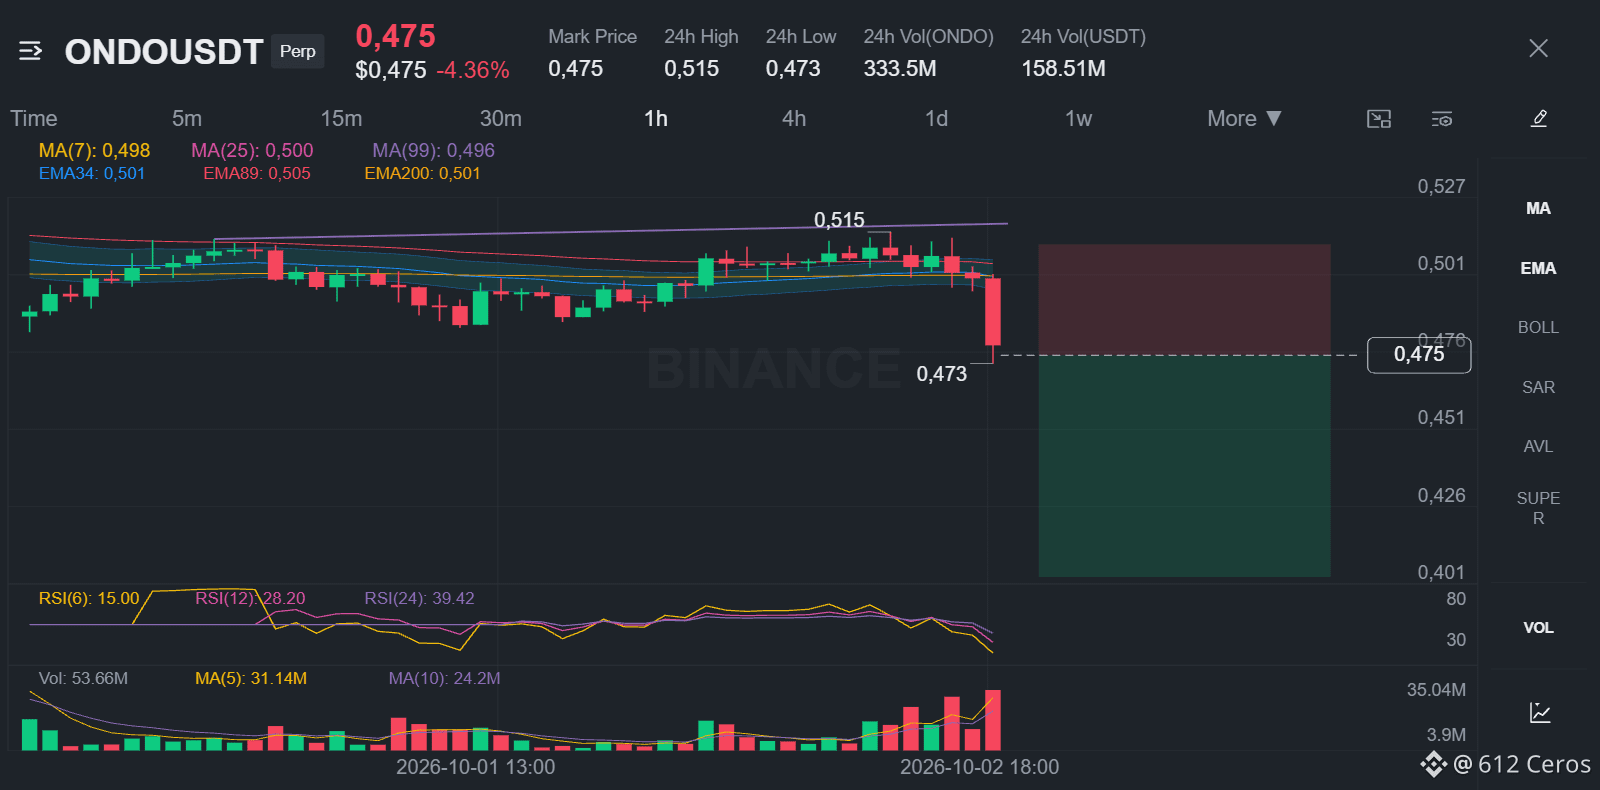
The daily stack is bullish, but sellers are pressing now.
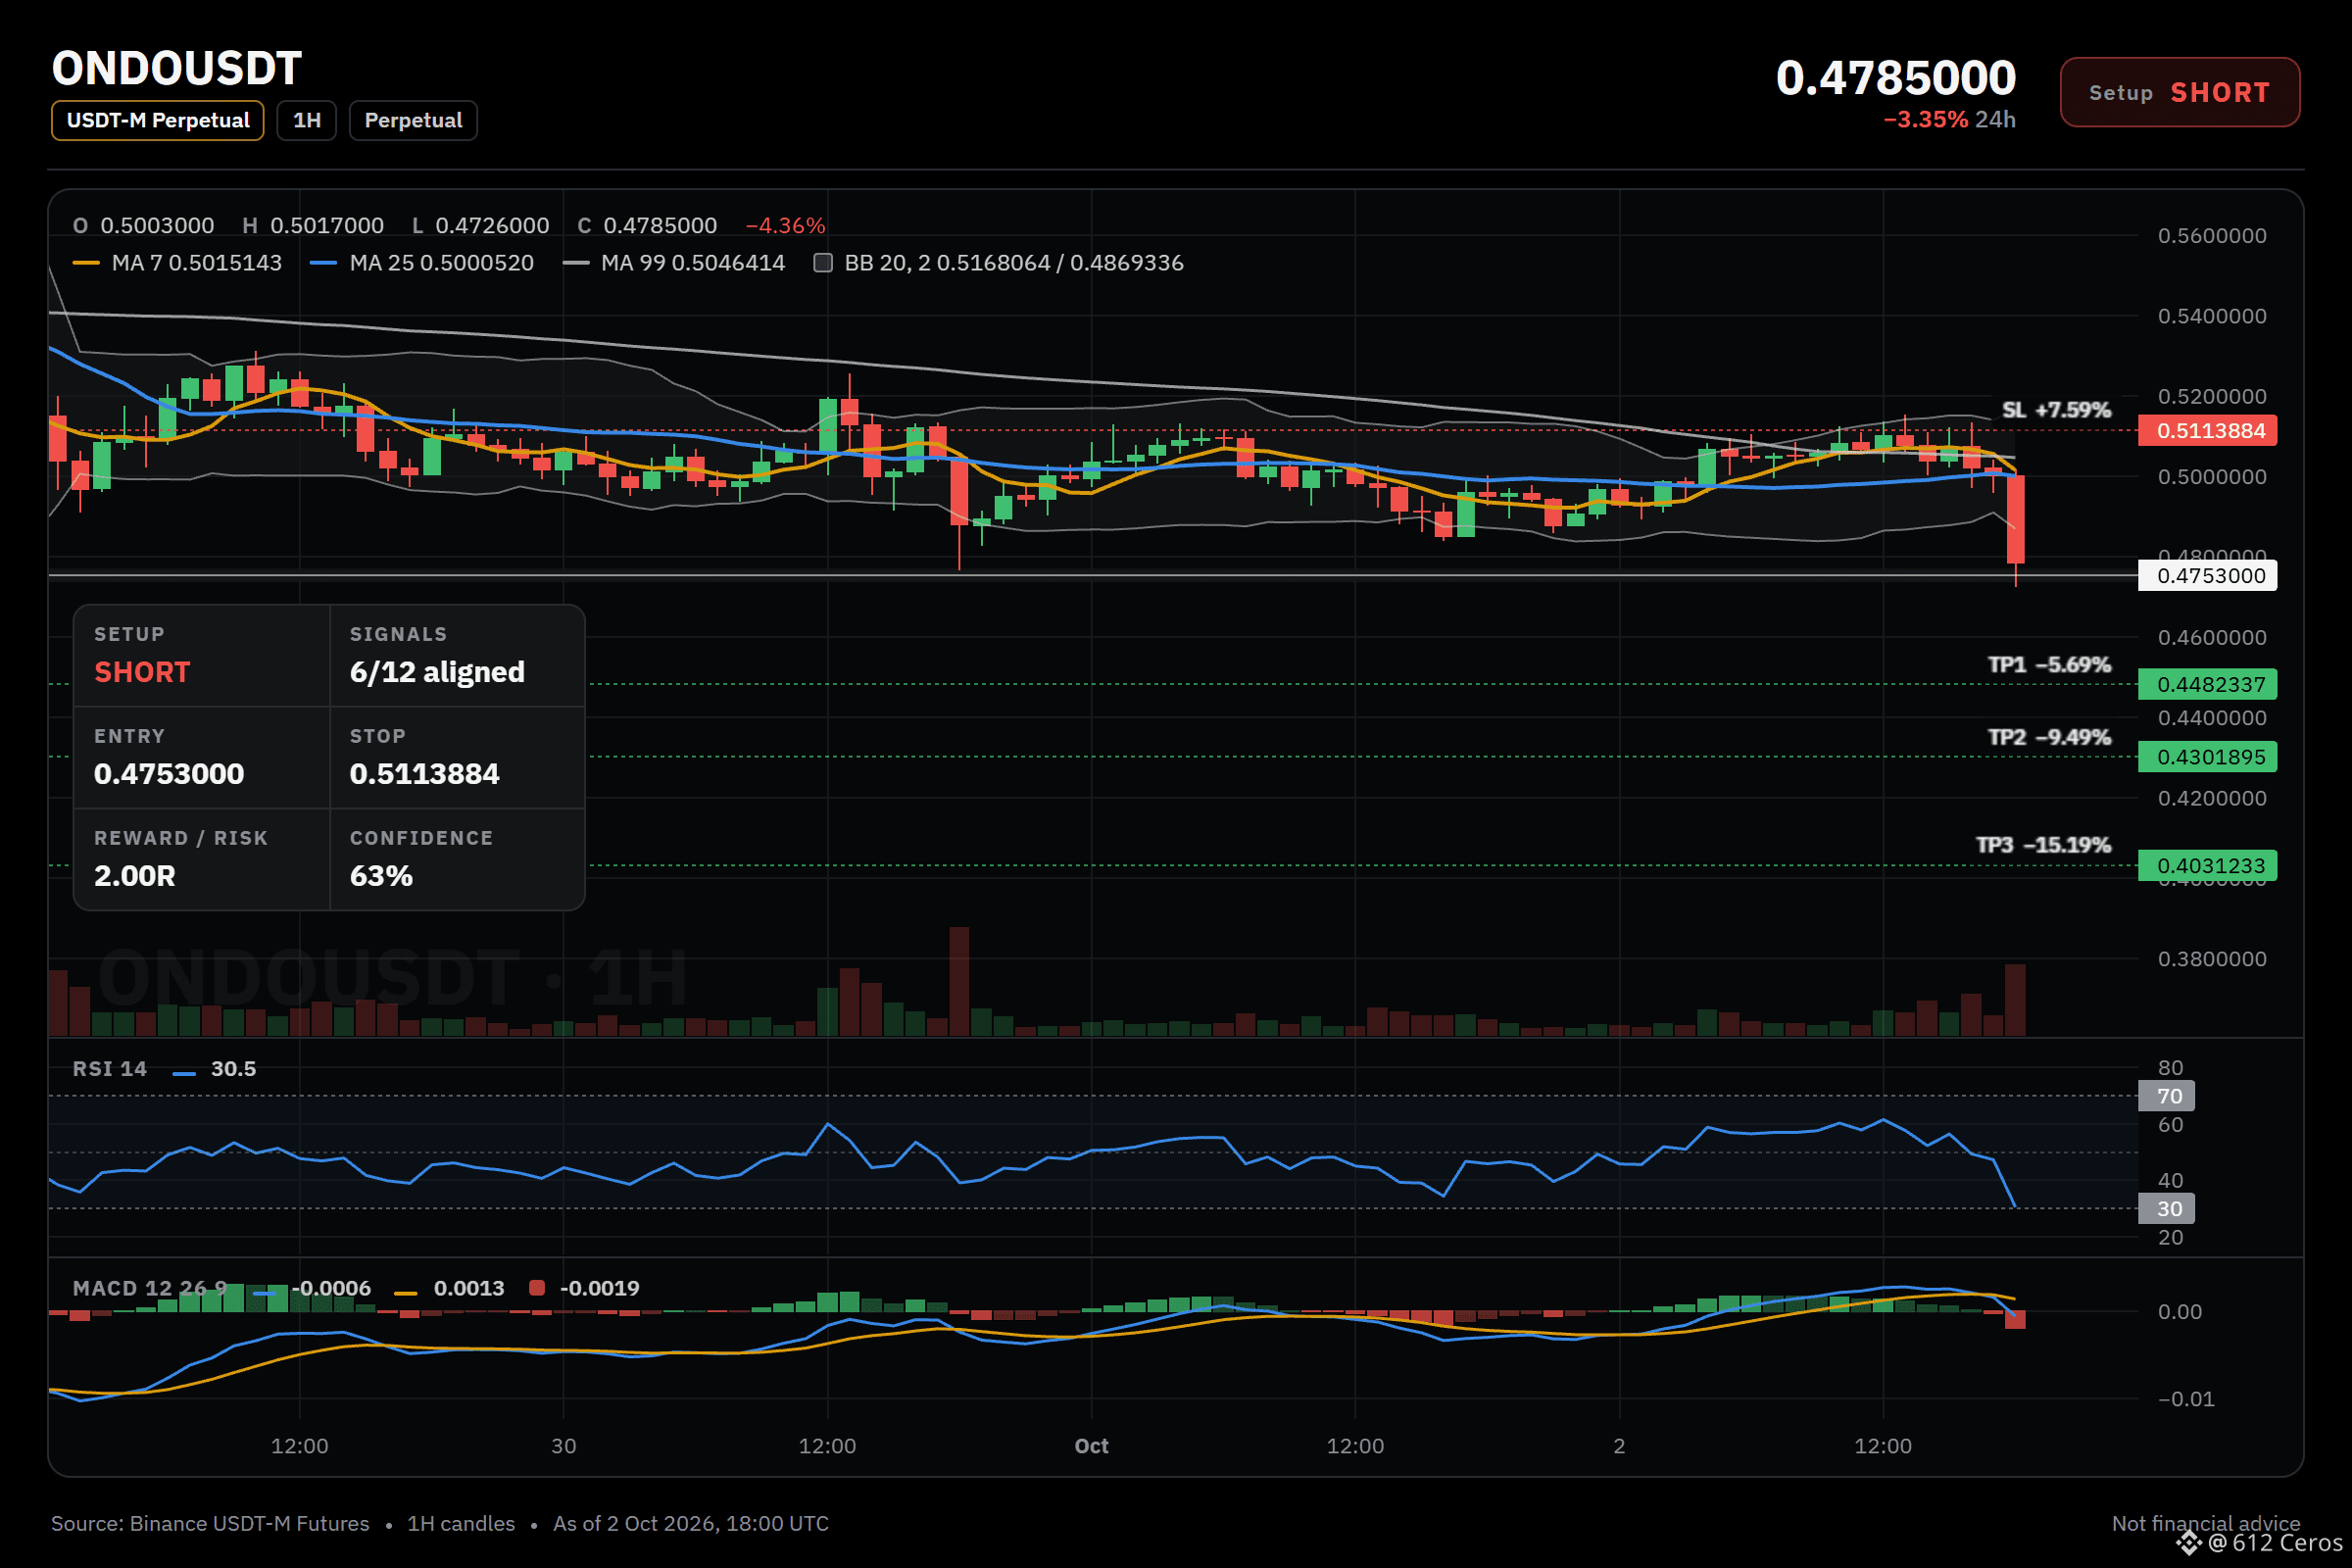
🔴 SHORT $ONDO /USDT: expecting price to go DOWN
Bias: SHORT · Leaning
Entry: 0.4737088 – 0.4768912
TP1: 0.4482337 (-5.7%)
TP2: 0.4301895 (-9.5%)
TP3: 0.4031233 (-15.2%)
SL: 0.5113884 (+7.6%)
Plan: enter only inside the zone, take half at TP1, then move the stop to entry.
Caution: counter-trend setup against the bigger trend, only 6 signals confirm it. Size down, respect the stop.
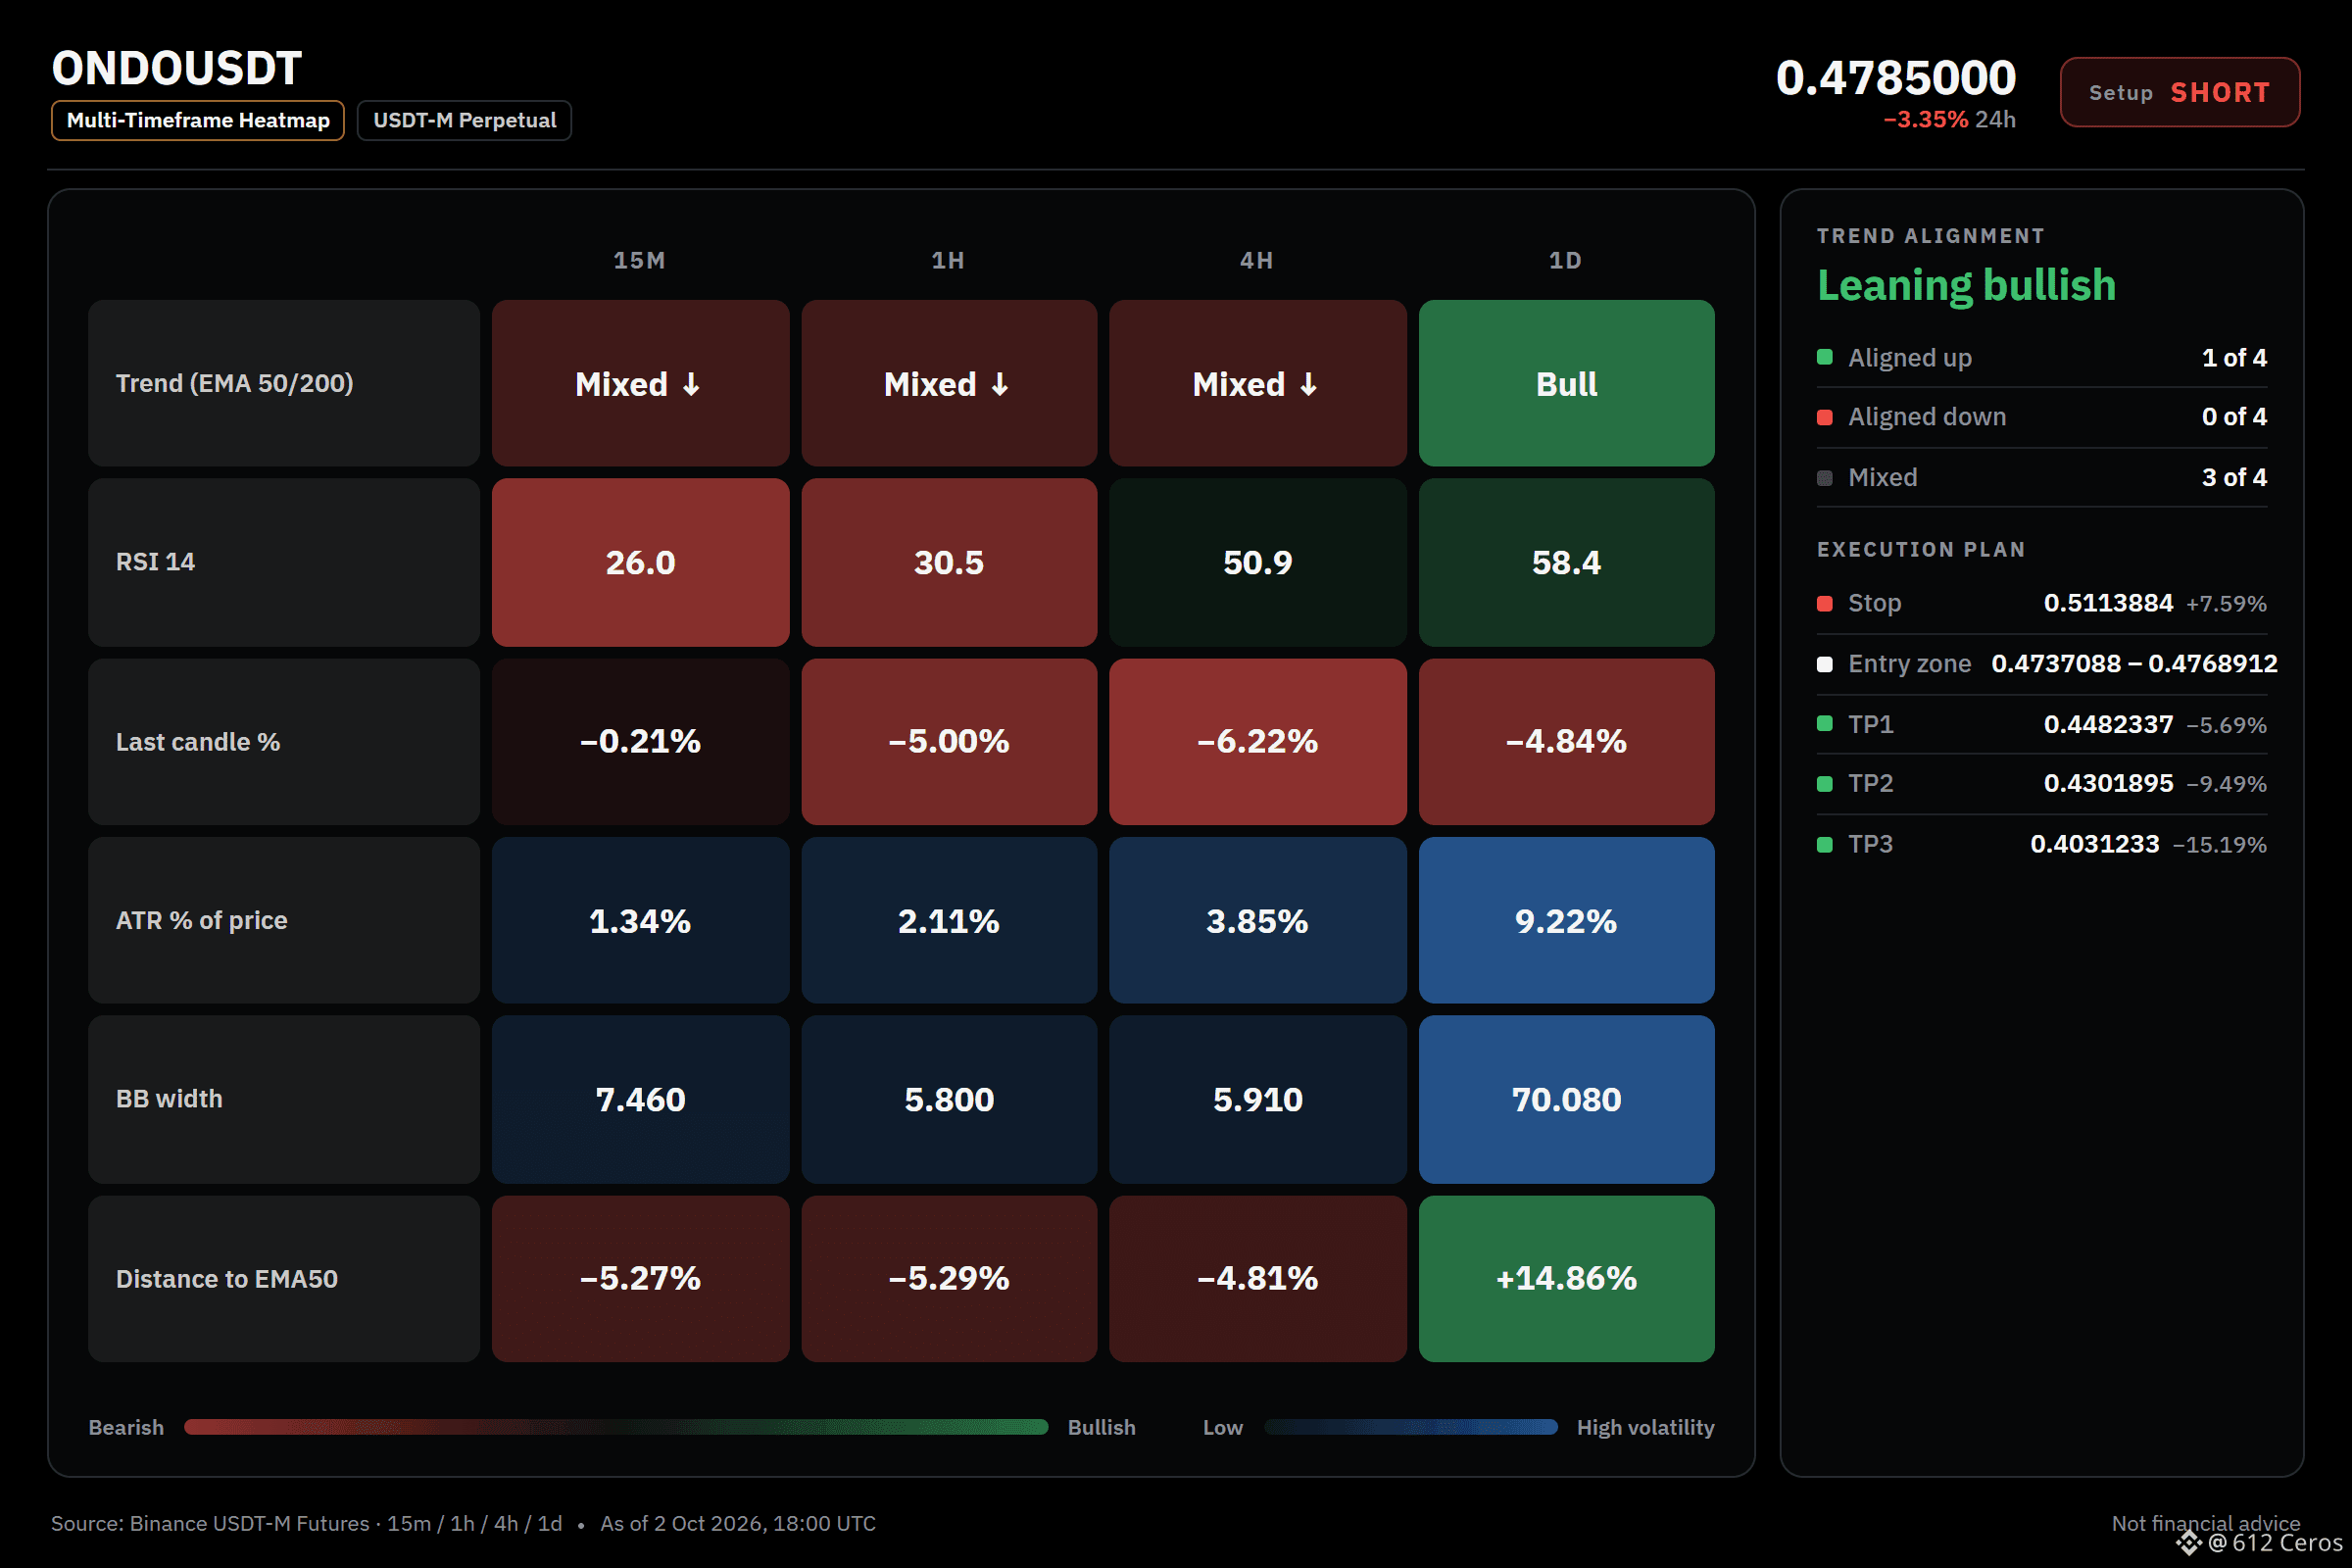
Why SHORT? Leaning call, 6/12 signals agree, 1 against, 5 undecided.
• Trend strength (ADX/DI, 15m): ADX 30.2 with sellers in control (DI+ 8.3 vs DI− 39.0) → sellers are driving the move
• BTC backdrop: BTC trend is bearish and correlation is 0.68 → BTC is falling and this coin tends to follow
• 1h RSI: 30.5, bearish momentum (below 45) → sellers have the momentum
Risk: Daily trend: price > EMA50 > EMA200, bullish stack → the big-picture trend is up
Quick ONDO read:
1. The daily trend is bullish, but the setup is a counter-trend reversal bet, so size down and respect the stop.
2. The 1h RSI is 30.5 and ADX shows sellers driving the move with DI- at 39.0 versus DI+ at 8.3.
3. BTC is bearish with 0.68 correlation, and ONDO is underperforming by 2.73% over the last day.
What is your stop level if you take this short, and do you think the daily bullish trend will flip first?
Full setup on the chart below.
{future}(ONDOUSDT)
📲 Want more of my latest signals? Join me here:
[https://app.binance.com/uni-qr/D26WbL9t](https://app.binance.com/uni-qr/D26WbL9t)
⚠️ Personal market analysis only. NFA — manage risk and DYOR.
Educational content, not investment advice or a recommendation to buy, sell, deposit, or withdraw any asset. No paid promotion or referral/affiliate links.
The daily stack is bullish, but sellers are pressing now.
🔴 SHORT $ONDO /USDT: expecting price to go DOWN
Bias: SHORT · Leaning
Entry: 0.4737088 – 0.4768912
TP1: 0.4482337 (-5.7%)
TP2: 0.4301895 (-9.5%)
TP3: 0.4031233 (-15.2%)
SL: 0.5113884 (+7.6%)
Plan: enter only inside the zone, take half at TP1, then move the stop to entry.
Caution: counter-trend setup against the bigger trend, only 6 signals confirm it. Size down, respect the stop.
Why SHORT? Leaning call, 6/12 signals agree, 1 against, 5 undecided.
• Trend strength (ADX/DI, 15m): ADX 30.2 with sellers in control (DI+ 8.3 vs DI− 39.0) → sellers are driving the move
• BTC backdrop: BTC trend is bearish and correlation is 0.68 → BTC is falling and this coin tends to follow
• 1h RSI: 30.5, bearish momentum (below 45) → sellers have the momentum
Risk: Daily trend: price > EMA50 > EMA200, bullish stack → the big-picture trend is up
Quick ONDO read:
1. The daily trend is bullish, but the setup is a counter-trend reversal bet, so size down and respect the stop.
2. The 1h RSI is 30.5 and ADX shows sellers driving the move with DI- at 39.0 versus DI+ at 8.3.
3. BTC is bearish with 0.68 correlation, and ONDO is underperforming by 2.73% over the last day.
What is your stop level if you take this short, and do you think the daily bullish trend will flip first?
Full setup on the chart below.
📲 Want more of my latest signals? Join me here:
https://app.binance.com/uni-qr/D26WbL9t
⚠️ Personal market analysis only. NFA — manage risk and DYOR.
Educational content, not investment advice or a recommendation to buy, sell, deposit, or withdraw any asset. No paid promotion or referral/affiliate links.
🔴 SHORT $ONDO /USDT: expecting price to go DOWN
Bias: SHORT · Leaning
Entry: 0.4737088 – 0.4768912
TP1: 0.4482337 (-5.7%)
TP2: 0.4301895 (-9.5%)
TP3: 0.4031233 (-15.2%)
SL: 0.5113884 (+7.6%)
Plan: enter only inside the zone, take half at TP1, then move the stop to entry.
Caution: counter-trend setup against the bigger trend, only 6 signals confirm it. Size down, respect the stop.
Why SHORT? Leaning call, 6/12 signals agree, 1 against, 5 undecided.
• Trend strength (ADX/DI, 15m): ADX 30.2 with sellers in control (DI+ 8.3 vs DI− 39.0) → sellers are driving the move
• BTC backdrop: BTC trend is bearish and correlation is 0.68 → BTC is falling and this coin tends to follow
• 1h RSI: 30.5, bearish momentum (below 45) → sellers have the momentum
Risk: Daily trend: price > EMA50 > EMA200, bullish stack → the big-picture trend is up
Quick ONDO read:
1. The daily trend is bullish, but the setup is a counter-trend reversal bet, so size down and respect the stop.
2. The 1h RSI is 30.5 and ADX shows sellers driving the move with DI- at 39.0 versus DI+ at 8.3.
3. BTC is bearish with 0.68 correlation, and ONDO is underperforming by 2.73% over the last day.
What is your stop level if you take this short, and do you think the daily bullish trend will flip first?
Full setup on the chart below.
📲 Want more of my latest signals? Join me here:
https://app.binance.com/uni-qr/D26WbL9t
⚠️ Personal market analysis only. NFA — manage risk and DYOR.
Educational content, not investment advice or a recommendation to buy, sell, deposit, or withdraw any asset. No paid promotion or referral/affiliate links.
5
2
1.3k
·
--
BNB is not stuck in a myth of easy direction
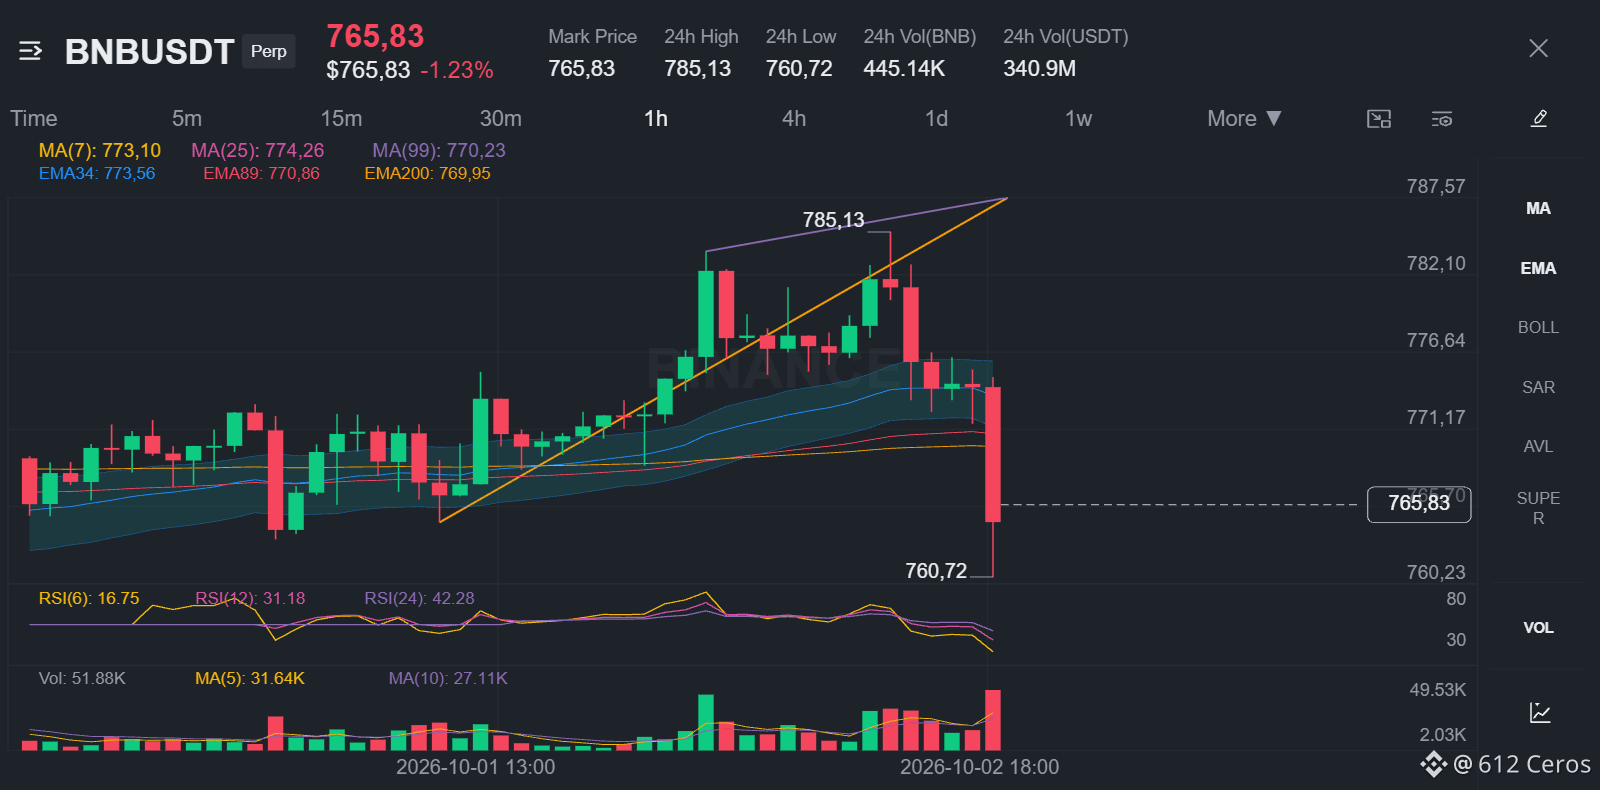
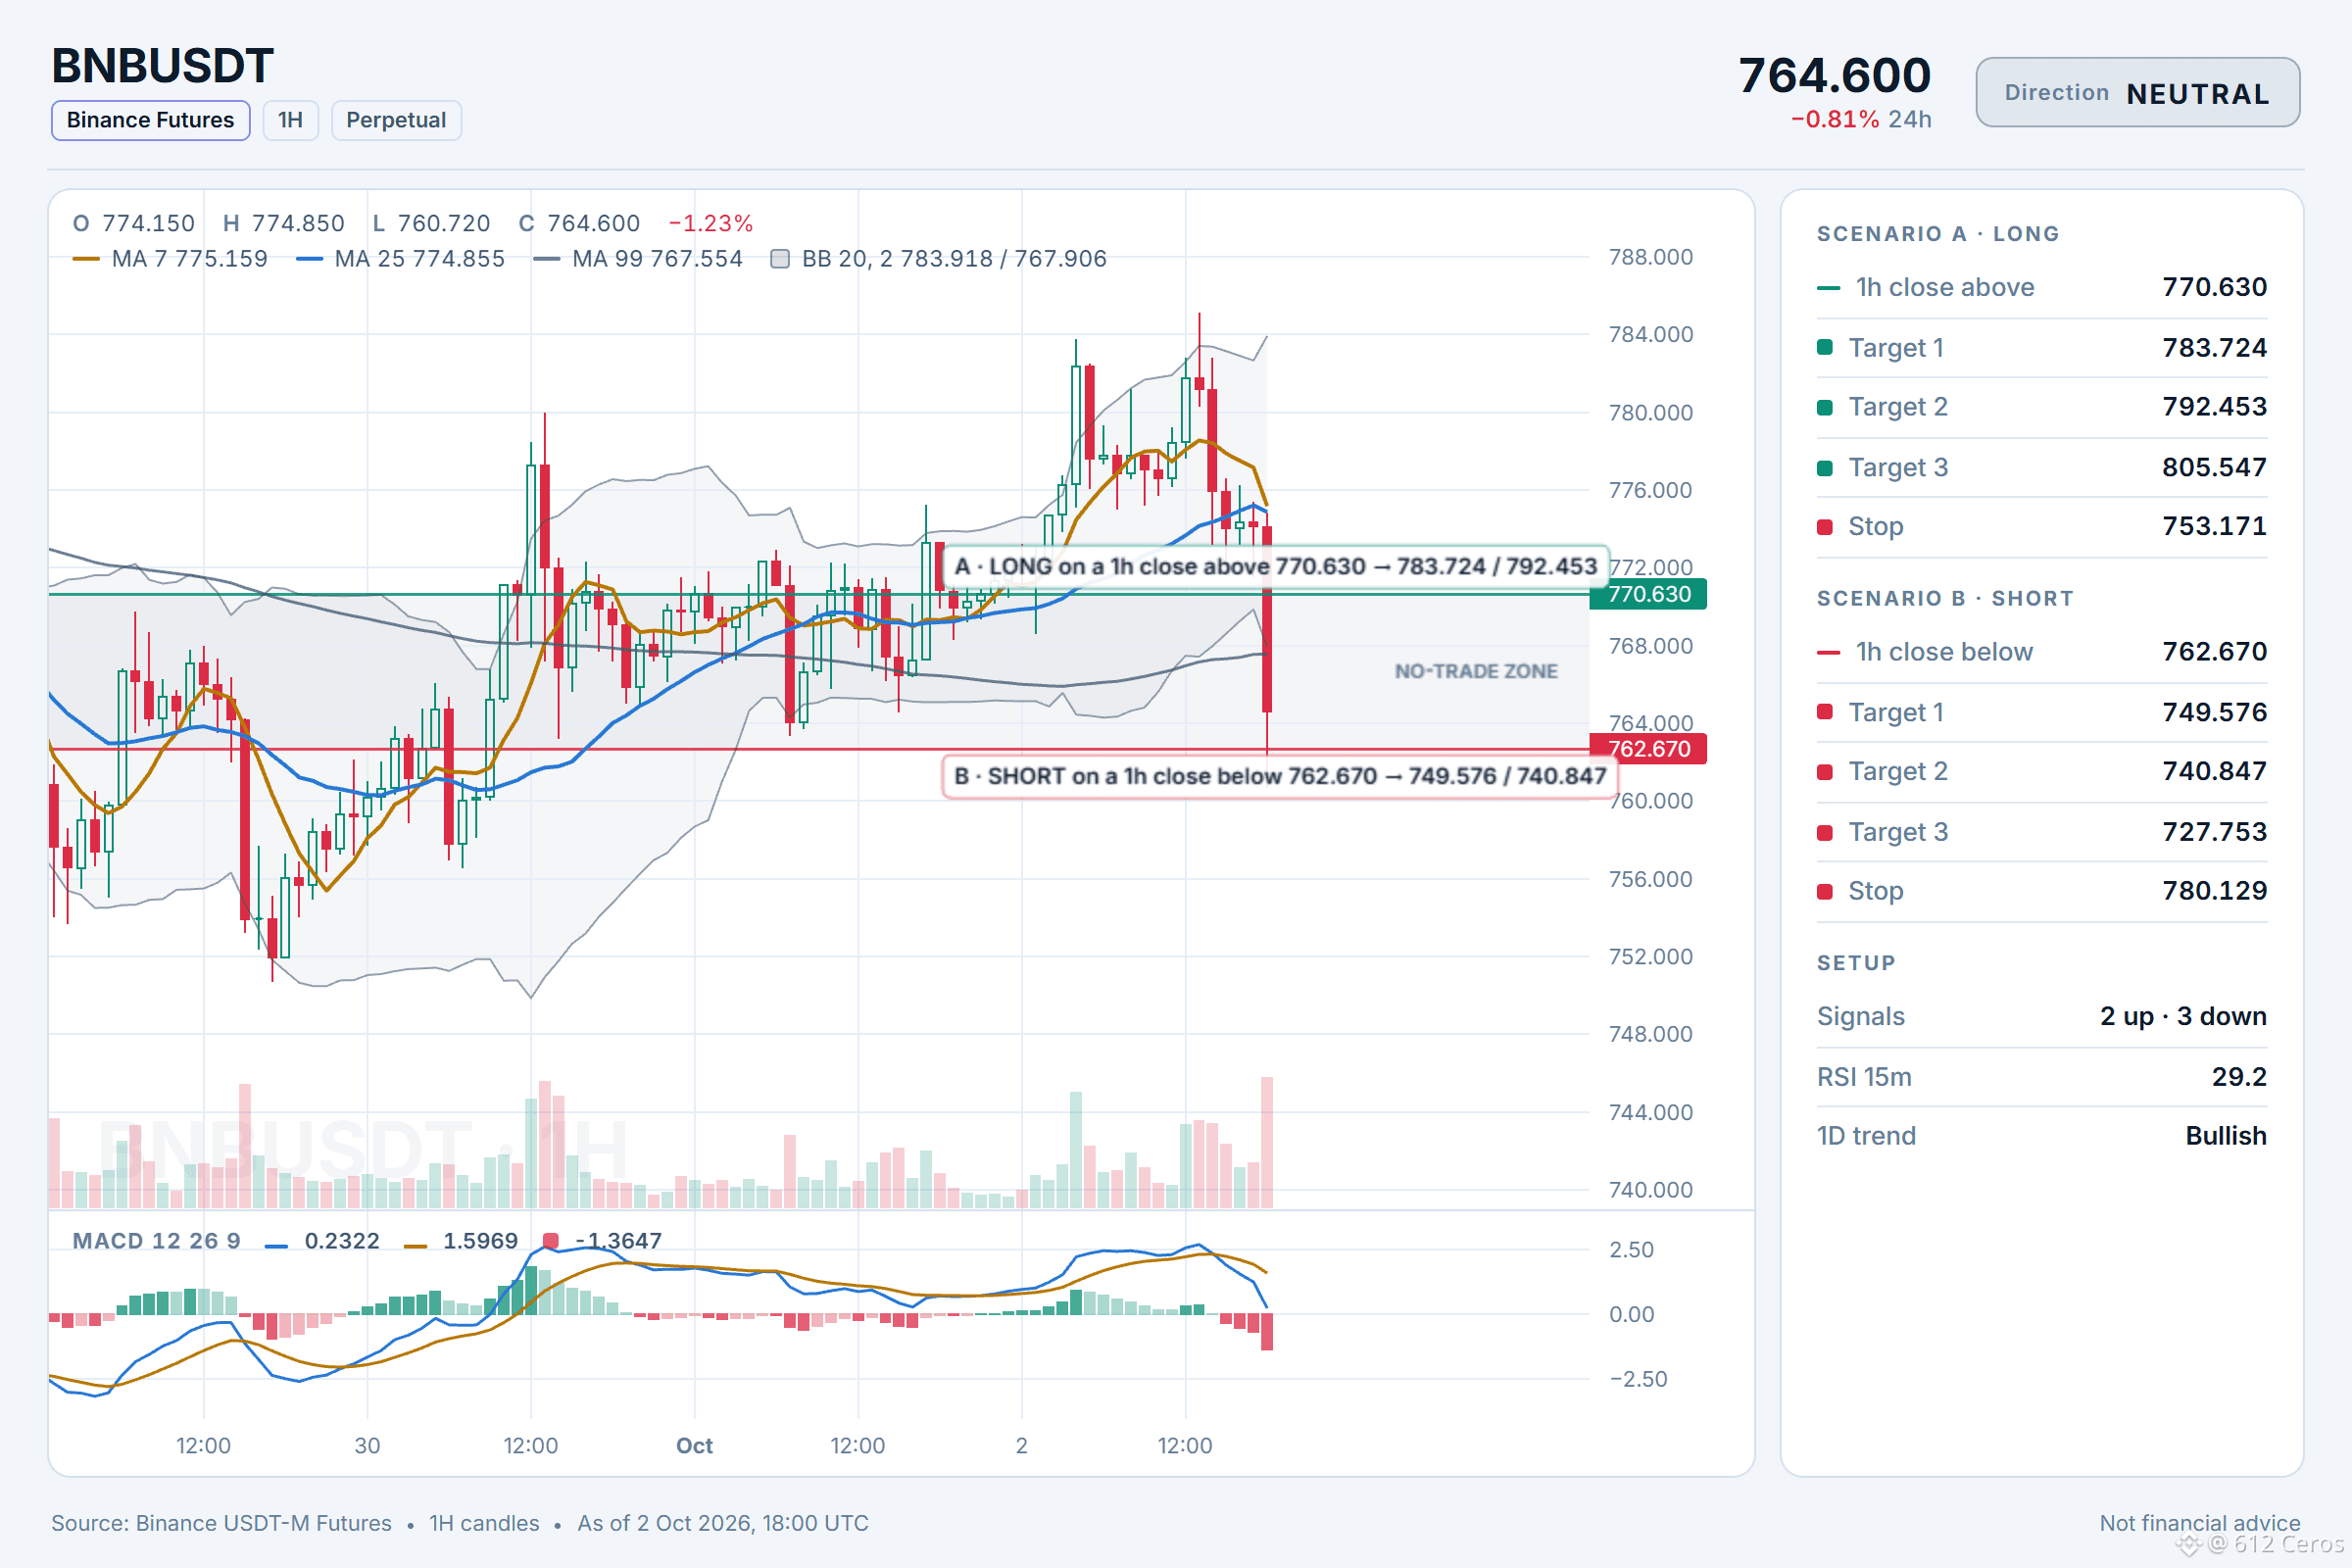
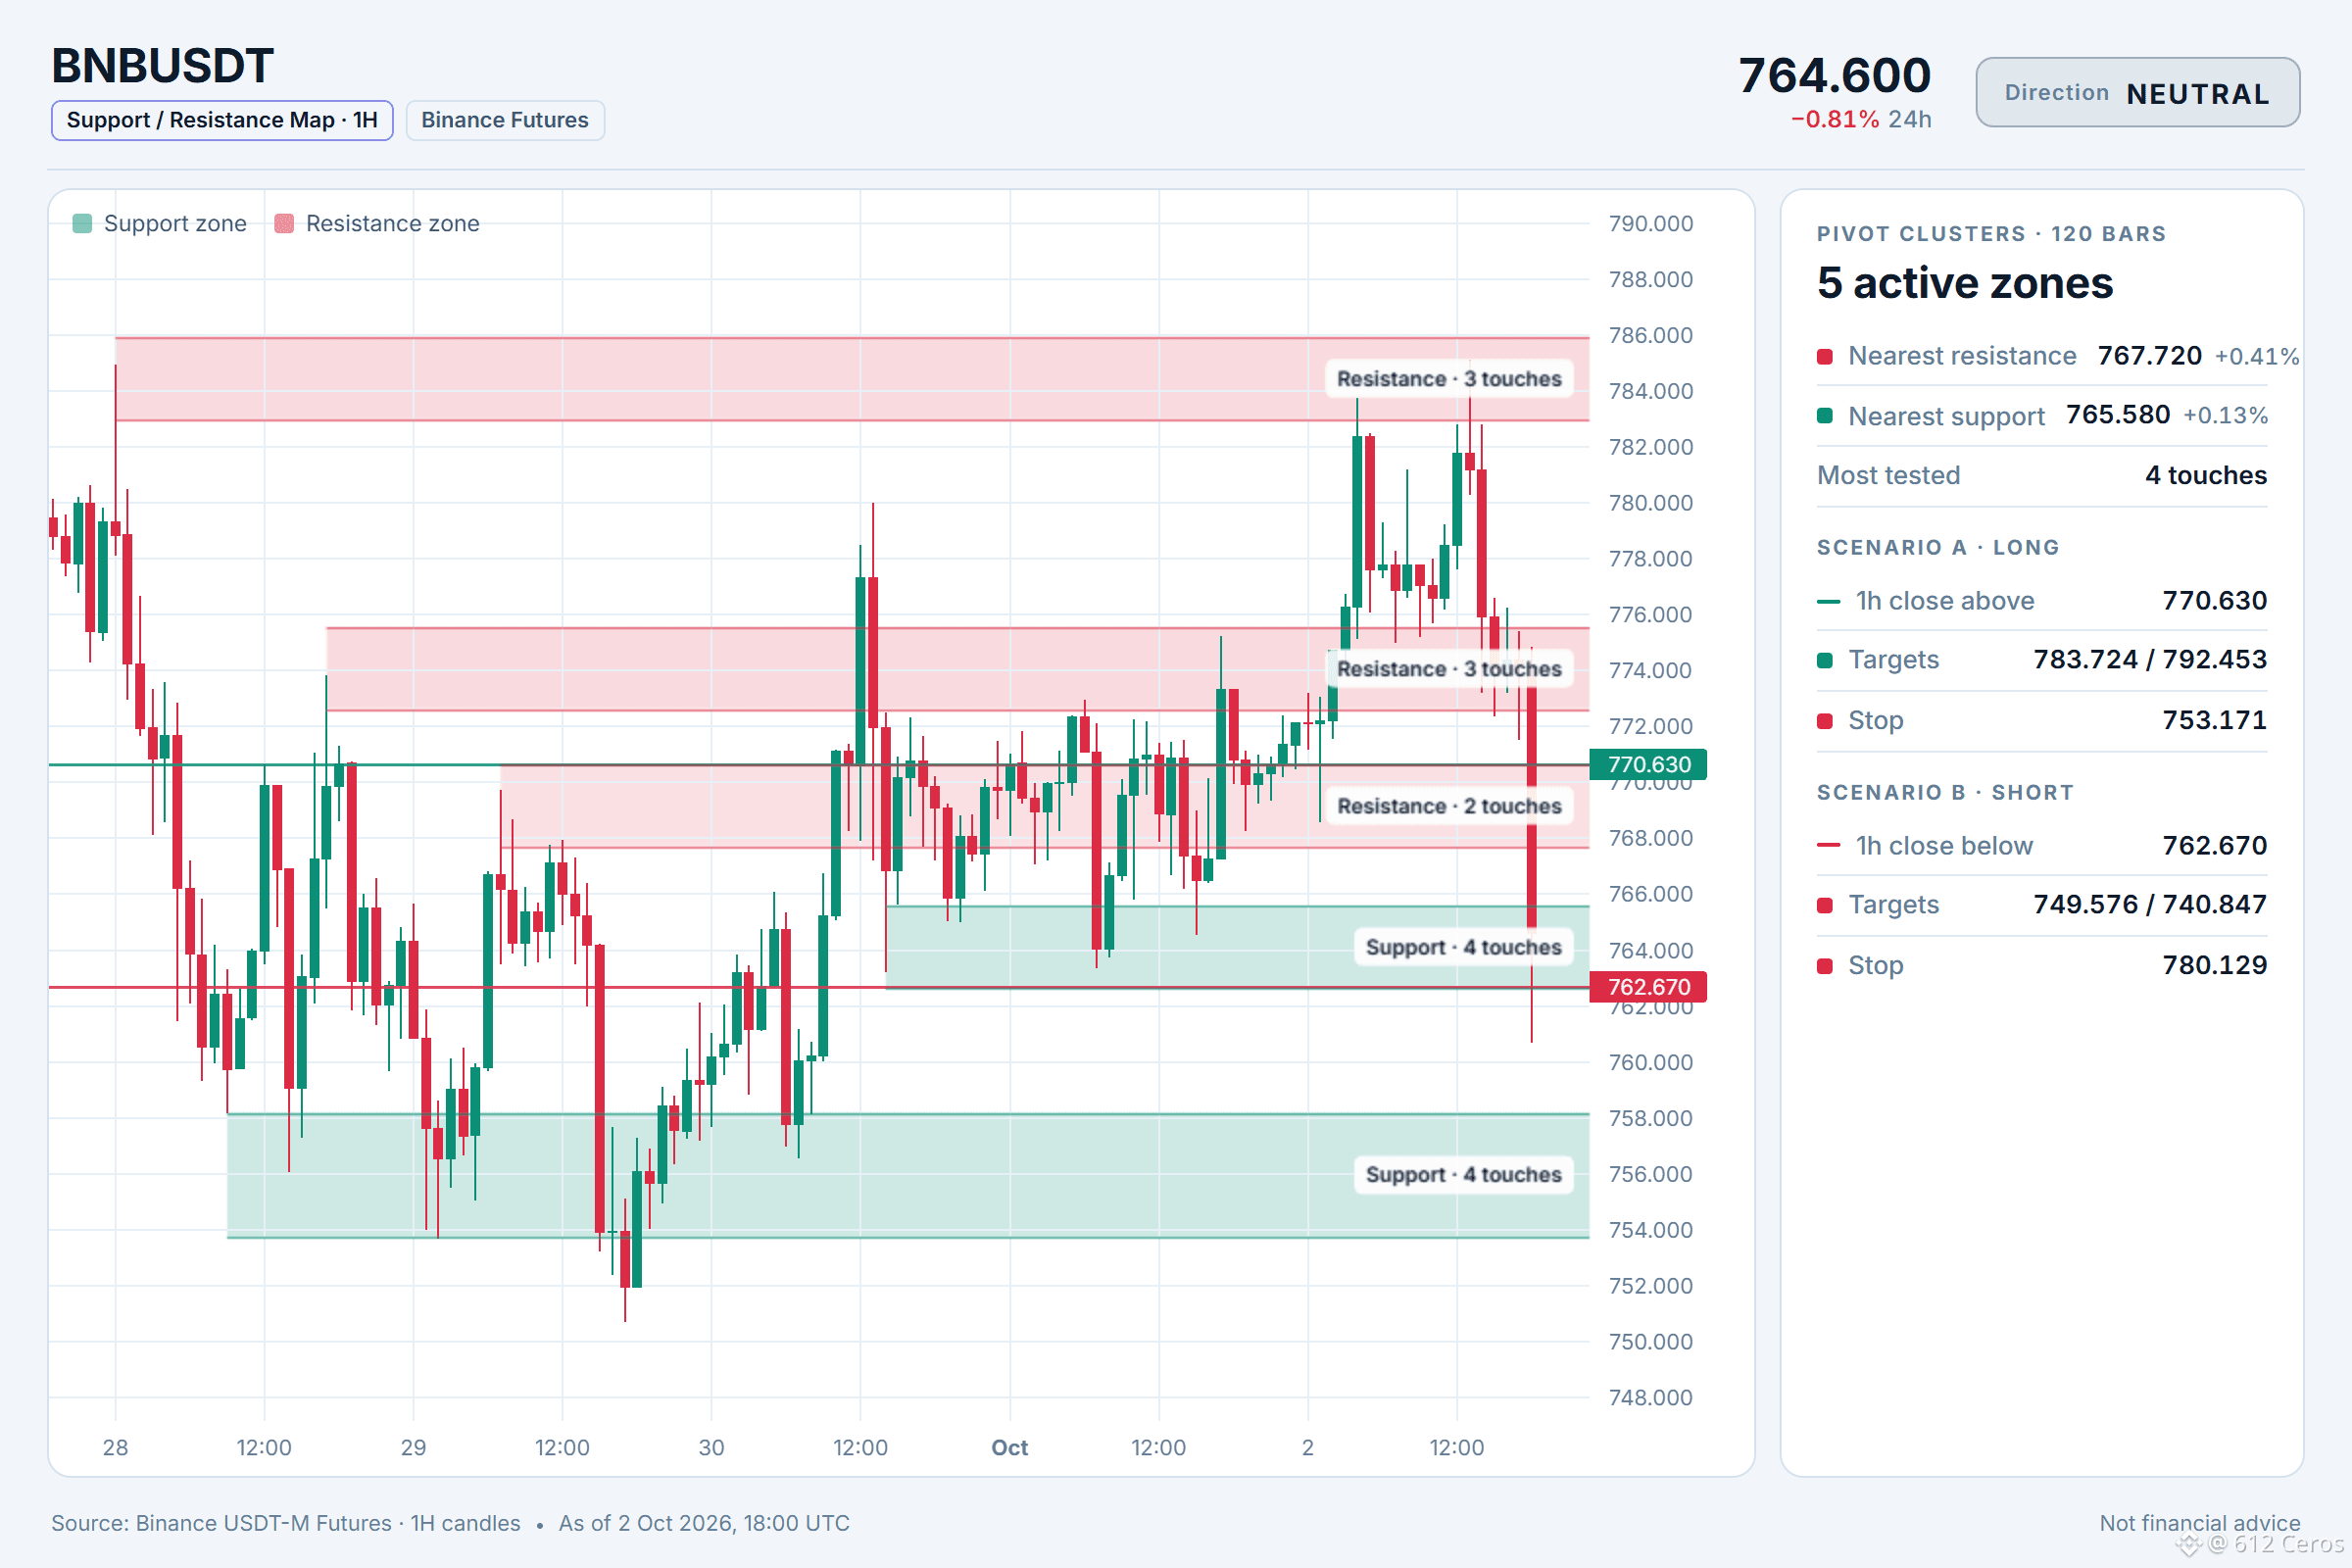
$BNB /USDT: NO TRADE YET, waiting for one side to break
Bias: NEUTRAL · 2 bullish vs 3 bearish
The plan is conditional:
LONG on a 1h close above 770.630 → targets 783.724 / 792.453 / 805.547, stop 753.171
SHORT on a 1h close below 762.670 → targets 749.576 / 740.847 / 727.753, stop 780.129
In between (1.0% wide): no edge, no trade.
Technical read: NEUTRAL. 2 of 12 signals bullish, 3 bearish, 7 undecided.
Bullish side:
• Daily trend: price > EMA50 > EMA200, bullish stack → the big-picture trend is up
• Volume: volume z-score +1.7 on a green candle, demand confirms → real buying volume backs the move
Bearish side:
• Trend strength (ADX/DI, 15m): ADX 22.8 with sellers in control (DI+ 8.9 vs DI− 35.3) → sellers are driving the move
• BTC backdrop: BTC trend is bearish and correlation is 0.83 → BTC is falling and this coin tends to follow
My read:
There is no edge right now. The strongest bullish factor is the daily trend, which is up on a bullish stack of moving averages. The strongest bearish factor is the 15m trend strength, where sellers are in control with ADX 22.8 and DI minus 35.3 versus DI plus 8.9. A trade depends on a 1h close beyond a trigger level.
What level would you need to see on a 1h close to take the long or the short?
Full setup on the chart below.
{future}(BNBUSDT)
📲 Want more of my latest signals? Join me here:
[https://app.binance.com/uni-qr/D26WbL9t](https://app.binance.com/uni-qr/D26WbL9t)
⚠️ Personal market analysis only. NFA — manage risk and DYOR.
Educational content, not investment advice or a recommendation to buy, sell, deposit, or withdraw any asset. No paid promotion or referral/affiliate links.
BNB is not stuck in a myth of easy direction
$BNB /USDT: NO TRADE YET, waiting for one side to break
Bias: NEUTRAL · 2 bullish vs 3 bearish
The plan is conditional:
LONG on a 1h close above 770.630 → targets 783.724 / 792.453 / 805.547, stop 753.171
SHORT on a 1h close below 762.670 → targets 749.576 / 740.847 / 727.753, stop 780.129
In between (1.0% wide): no edge, no trade.
Technical read: NEUTRAL. 2 of 12 signals bullish, 3 bearish, 7 undecided.
Bullish side:
• Daily trend: price > EMA50 > EMA200, bullish stack → the big-picture trend is up
• Volume: volume z-score +1.7 on a green candle, demand confirms → real buying volume backs the move
Bearish side:
• Trend strength (ADX/DI, 15m): ADX 22.8 with sellers in control (DI+ 8.9 vs DI− 35.3) → sellers are driving the move
• BTC backdrop: BTC trend is bearish and correlation is 0.83 → BTC is falling and this coin tends to follow
My read:
There is no edge right now. The strongest bullish factor is the daily trend, which is up on a bullish stack of moving averages. The strongest bearish factor is the 15m trend strength, where sellers are in control with ADX 22.8 and DI minus 35.3 versus DI plus 8.9. A trade depends on a 1h close beyond a trigger level.
What level would you need to see on a 1h close to take the long or the short?
Full setup on the chart below.
📲 Want more of my latest signals? Join me here:
https://app.binance.com/uni-qr/D26WbL9t
⚠️ Personal market analysis only. NFA — manage risk and DYOR.
Educational content, not investment advice or a recommendation to buy, sell, deposit, or withdraw any asset. No paid promotion or referral/affiliate links.
$BNB /USDT: NO TRADE YET, waiting for one side to break
Bias: NEUTRAL · 2 bullish vs 3 bearish
The plan is conditional:
LONG on a 1h close above 770.630 → targets 783.724 / 792.453 / 805.547, stop 753.171
SHORT on a 1h close below 762.670 → targets 749.576 / 740.847 / 727.753, stop 780.129
In between (1.0% wide): no edge, no trade.
Technical read: NEUTRAL. 2 of 12 signals bullish, 3 bearish, 7 undecided.
Bullish side:
• Daily trend: price > EMA50 > EMA200, bullish stack → the big-picture trend is up
• Volume: volume z-score +1.7 on a green candle, demand confirms → real buying volume backs the move
Bearish side:
• Trend strength (ADX/DI, 15m): ADX 22.8 with sellers in control (DI+ 8.9 vs DI− 35.3) → sellers are driving the move
• BTC backdrop: BTC trend is bearish and correlation is 0.83 → BTC is falling and this coin tends to follow
My read:
There is no edge right now. The strongest bullish factor is the daily trend, which is up on a bullish stack of moving averages. The strongest bearish factor is the 15m trend strength, where sellers are in control with ADX 22.8 and DI minus 35.3 versus DI plus 8.9. A trade depends on a 1h close beyond a trigger level.
What level would you need to see on a 1h close to take the long or the short?
Full setup on the chart below.
📲 Want more of my latest signals? Join me here:
https://app.binance.com/uni-qr/D26WbL9t
⚠️ Personal market analysis only. NFA — manage risk and DYOR.
Educational content, not investment advice or a recommendation to buy, sell, deposit, or withdraw any asset. No paid promotion or referral/affiliate links.
2
579
·
--
No edge yet as price stalls between key levels
$BTC /USDT: NO TRADE YET, waiting for one side to break
Bias: NEUTRAL · 3 bullish vs 3 bearish
The plan is conditional:
LONG on a 1h close above 84640.34 → targets 86331.50 / 87458.94 / 89150.10, stop 82385.46
SHORT on a 1h close below 82500.10 → targets 80808.94 / 79681.50 / 77990.34, stop 84754.98
In between (2.6% wide): no edge, no trade.
Technical read: NEUTRAL. 3 of 12 signals bullish, 3 bearish, 6 undecided.
For the bulls:
• Daily trend: price > EMA50 > EMA200, bullish stack → the big-picture trend is up
• 4h trend: price > EMA50 > EMA200, bullish stack → the swing trend is up
For the bears:
• Trend strength (ADX/DI, 15m): ADX 34.9 with sellers in control (DI+ 9.4 vs DI− 35.2) → sellers are driving the move
• BTC backdrop: BTC trend is bearish and correlation is 1.00 → BTC is falling and this coin tends to follow
What would tip it:
There is no edge right now. The daily trend is bullish and the 4h trend is bullish, which are the strongest supportive factors. The strongest risk is that the 15m trend strength shows sellers in control with ADX 34.9, DI+ at 9.4 versus DI- at 35.2, meaning short-term sellers are driving the move.
Which trigger level do you think will break first, the 1h close above 84640.34 or below 82500.10?
Full setup on the chart below.
{future}(BTCUSDT)
📲 Want more of my latest signals? Join me here:
[https://app.binance.com/uni-qr/D26WbL9t](https://app.binance.com/uni-qr/D26WbL9t)
⚠️ Personal market analysis only. NFA — manage risk and DYOR.
Educational content, not investment advice or a recommendation to buy, sell, deposit, or withdraw any asset. No paid promotion or referral/affiliate links.
No edge yet as price stalls between key levels
$BTC /USDT: NO TRADE YET, waiting for one side to break
Bias: NEUTRAL · 3 bullish vs 3 bearish
The plan is conditional:
LONG on a 1h close above 84640.34 → targets 86331.50 / 87458.94 / 89150.10, stop 82385.46
SHORT on a 1h close below 82500.10 → targets 80808.94 / 79681.50 / 77990.34, stop 84754.98
In between (2.6% wide): no edge, no trade.
Technical read: NEUTRAL. 3 of 12 signals bullish, 3 bearish, 6 undecided.
For the bulls:
• Daily trend: price > EMA50 > EMA200, bullish stack → the big-picture trend is up
• 4h trend: price > EMA50 > EMA200, bullish stack → the swing trend is up
For the bears:
• Trend strength (ADX/DI, 15m): ADX 34.9 with sellers in control (DI+ 9.4 vs DI− 35.2) → sellers are driving the move
• BTC backdrop: BTC trend is bearish and correlation is 1.00 → BTC is falling and this coin tends to follow
What would tip it:
There is no edge right now. The daily trend is bullish and the 4h trend is bullish, which are the strongest supportive factors. The strongest risk is that the 15m trend strength shows sellers in control with ADX 34.9, DI+ at 9.4 versus DI- at 35.2, meaning short-term sellers are driving the move.
Which trigger level do you think will break first, the 1h close above 84640.34 or below 82500.10?
Full setup on the chart below.
📲 Want more of my latest signals? Join me here:
https://app.binance.com/uni-qr/D26WbL9t
⚠️ Personal market analysis only. NFA — manage risk and DYOR.
Educational content, not investment advice or a recommendation to buy, sell, deposit, or withdraw any asset. No paid promotion or referral/affiliate links.
$BTC /USDT: NO TRADE YET, waiting for one side to break
Bias: NEUTRAL · 3 bullish vs 3 bearish
The plan is conditional:
LONG on a 1h close above 84640.34 → targets 86331.50 / 87458.94 / 89150.10, stop 82385.46
SHORT on a 1h close below 82500.10 → targets 80808.94 / 79681.50 / 77990.34, stop 84754.98
In between (2.6% wide): no edge, no trade.
Technical read: NEUTRAL. 3 of 12 signals bullish, 3 bearish, 6 undecided.
For the bulls:
• Daily trend: price > EMA50 > EMA200, bullish stack → the big-picture trend is up
• 4h trend: price > EMA50 > EMA200, bullish stack → the swing trend is up
For the bears:
• Trend strength (ADX/DI, 15m): ADX 34.9 with sellers in control (DI+ 9.4 vs DI− 35.2) → sellers are driving the move
• BTC backdrop: BTC trend is bearish and correlation is 1.00 → BTC is falling and this coin tends to follow
What would tip it:
There is no edge right now. The daily trend is bullish and the 4h trend is bullish, which are the strongest supportive factors. The strongest risk is that the 15m trend strength shows sellers in control with ADX 34.9, DI+ at 9.4 versus DI- at 35.2, meaning short-term sellers are driving the move.
Which trigger level do you think will break first, the 1h close above 84640.34 or below 82500.10?
Full setup on the chart below.
📲 Want more of my latest signals? Join me here:
https://app.binance.com/uni-qr/D26WbL9t
⚠️ Personal market analysis only. NFA — manage risk and DYOR.
Educational content, not investment advice or a recommendation to buy, sell, deposit, or withdraw any asset. No paid promotion or referral/affiliate links.
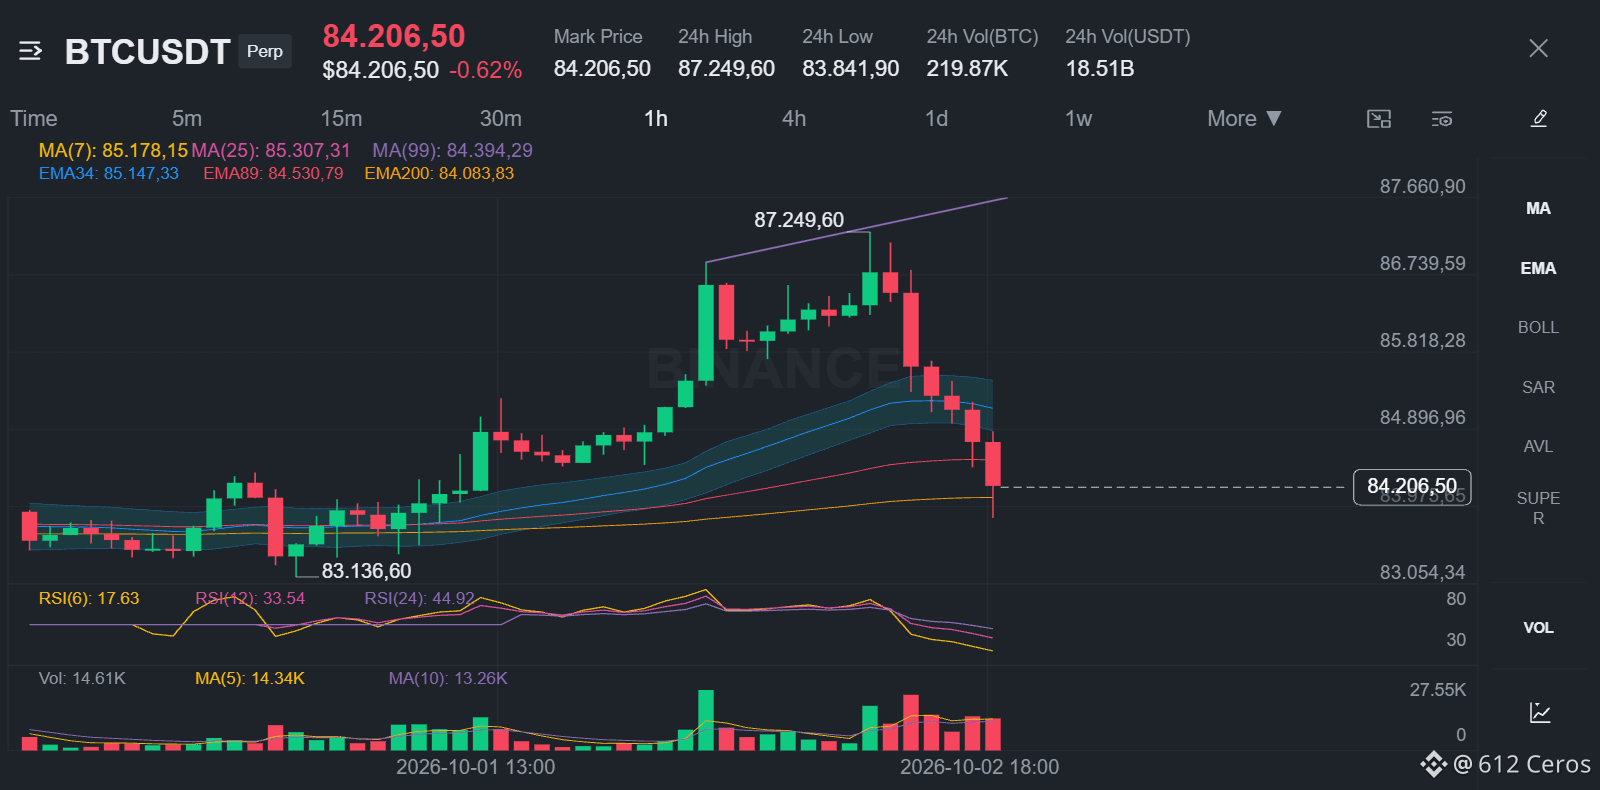
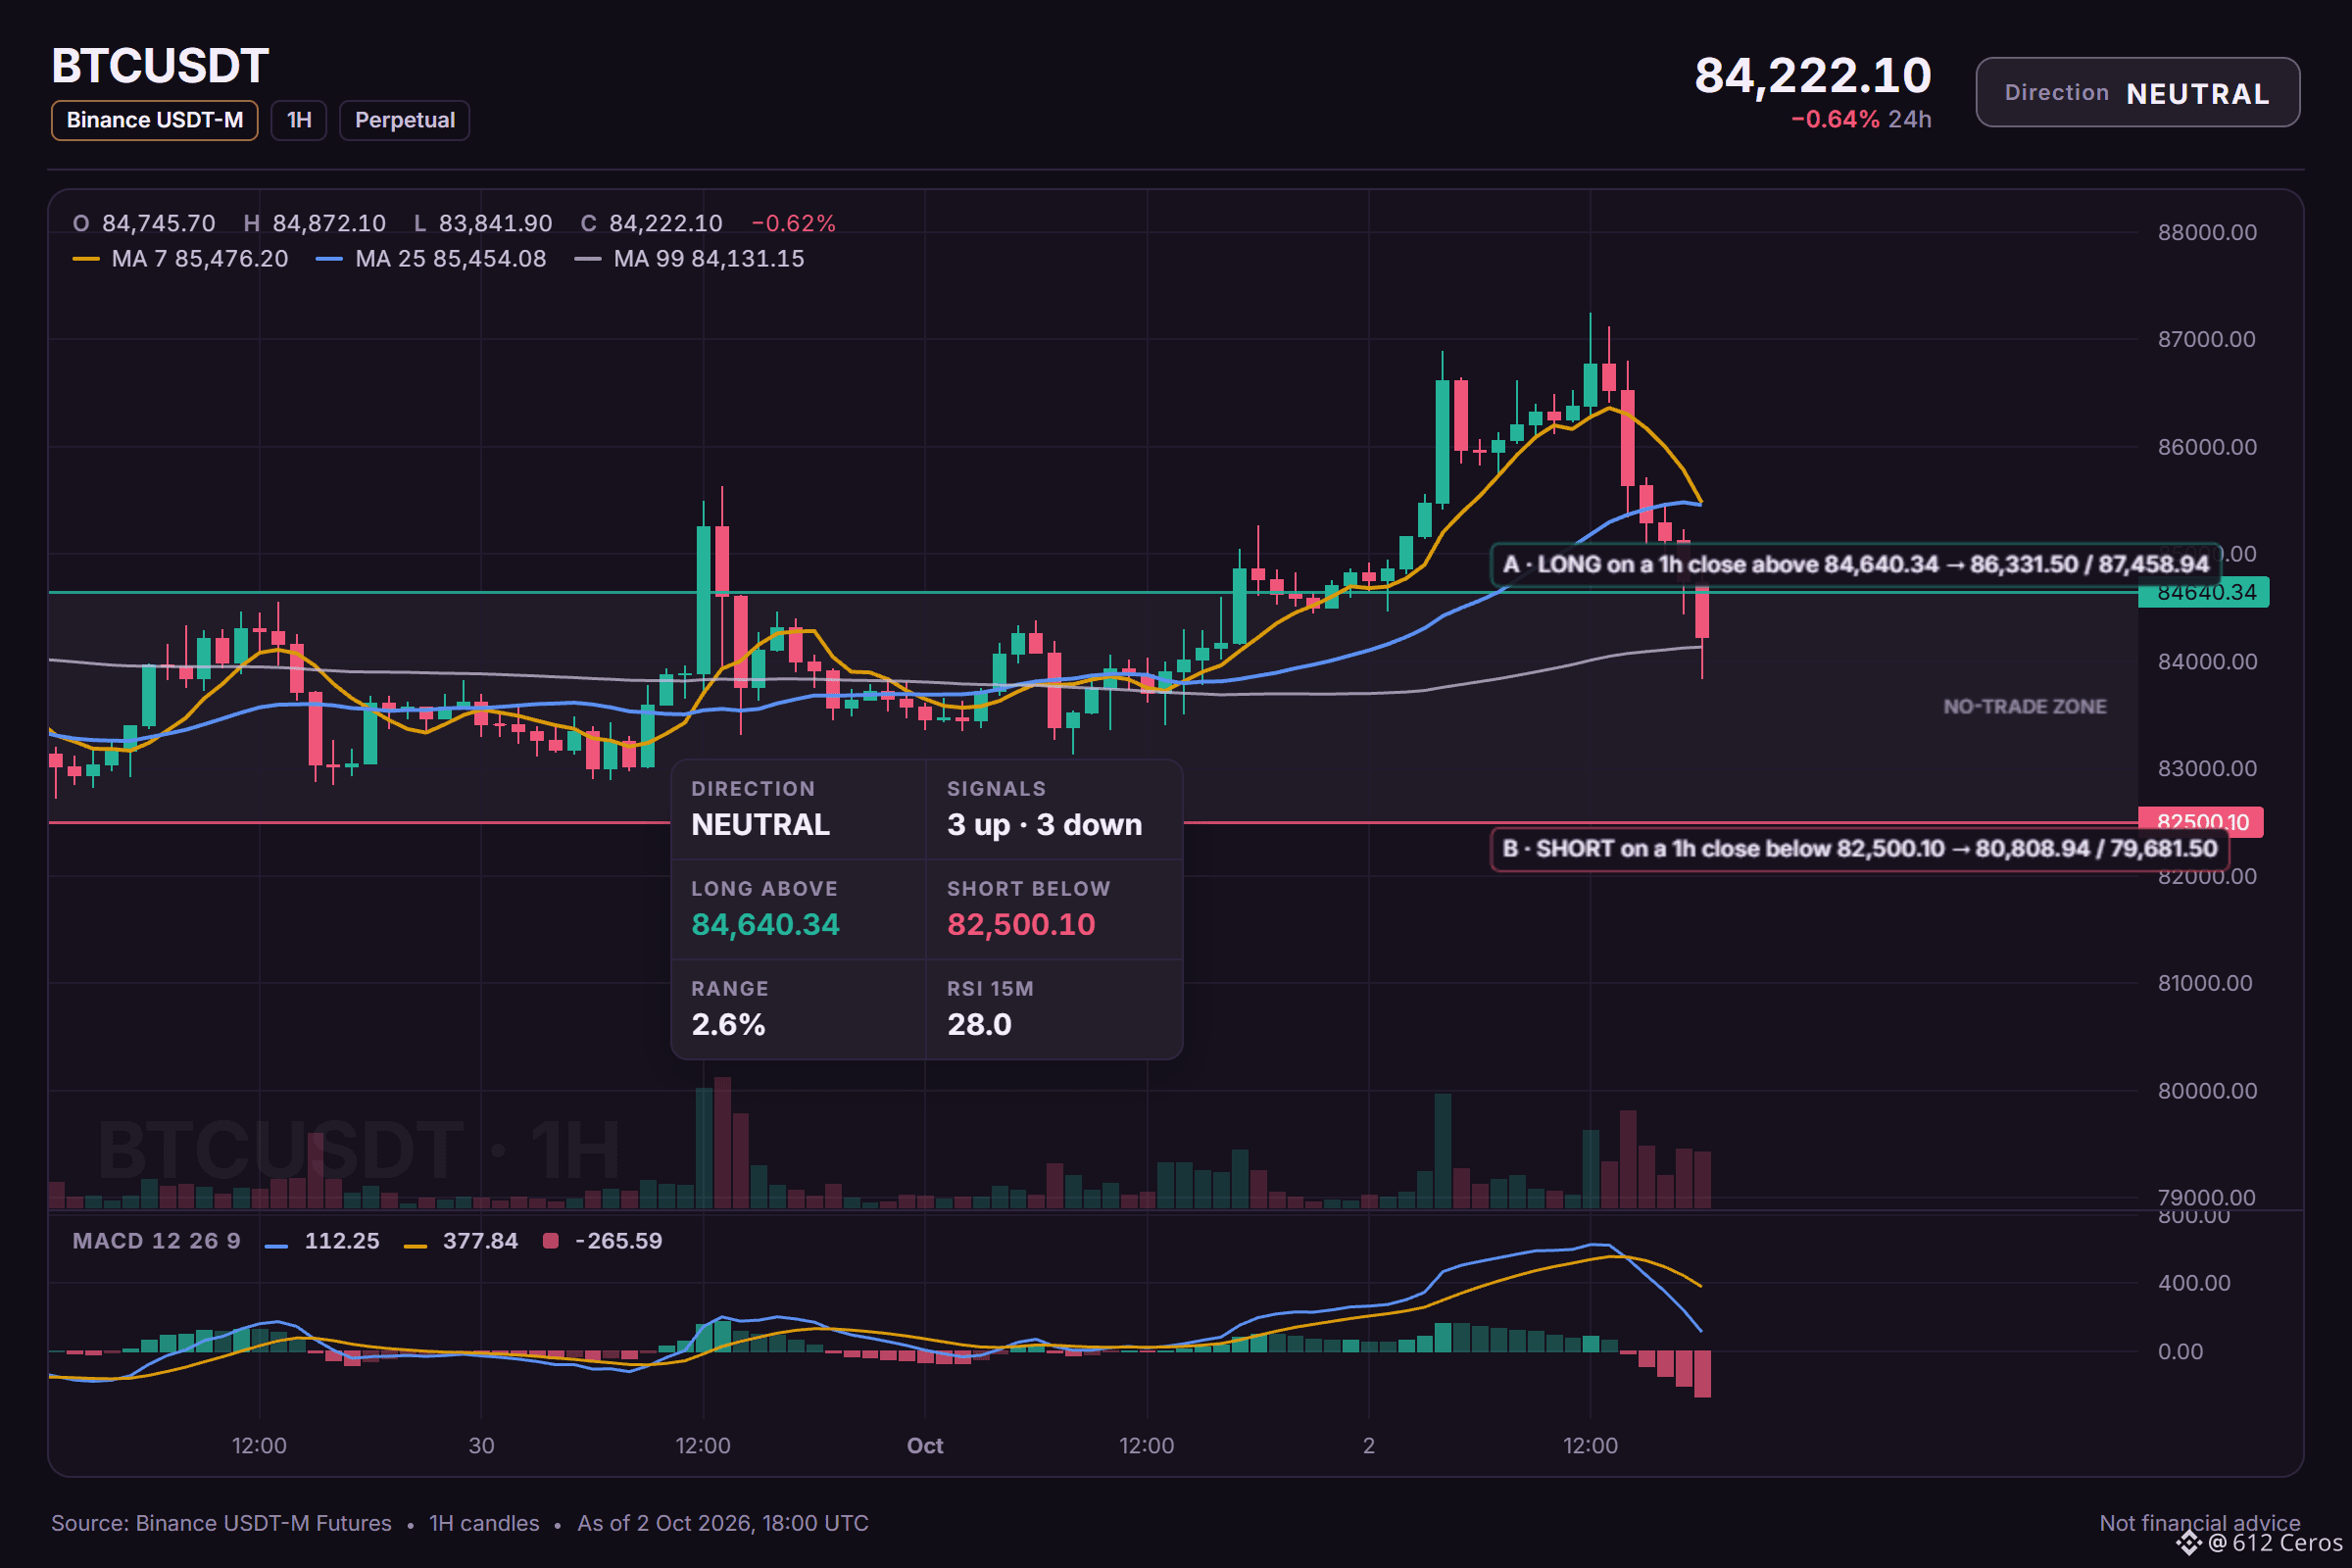
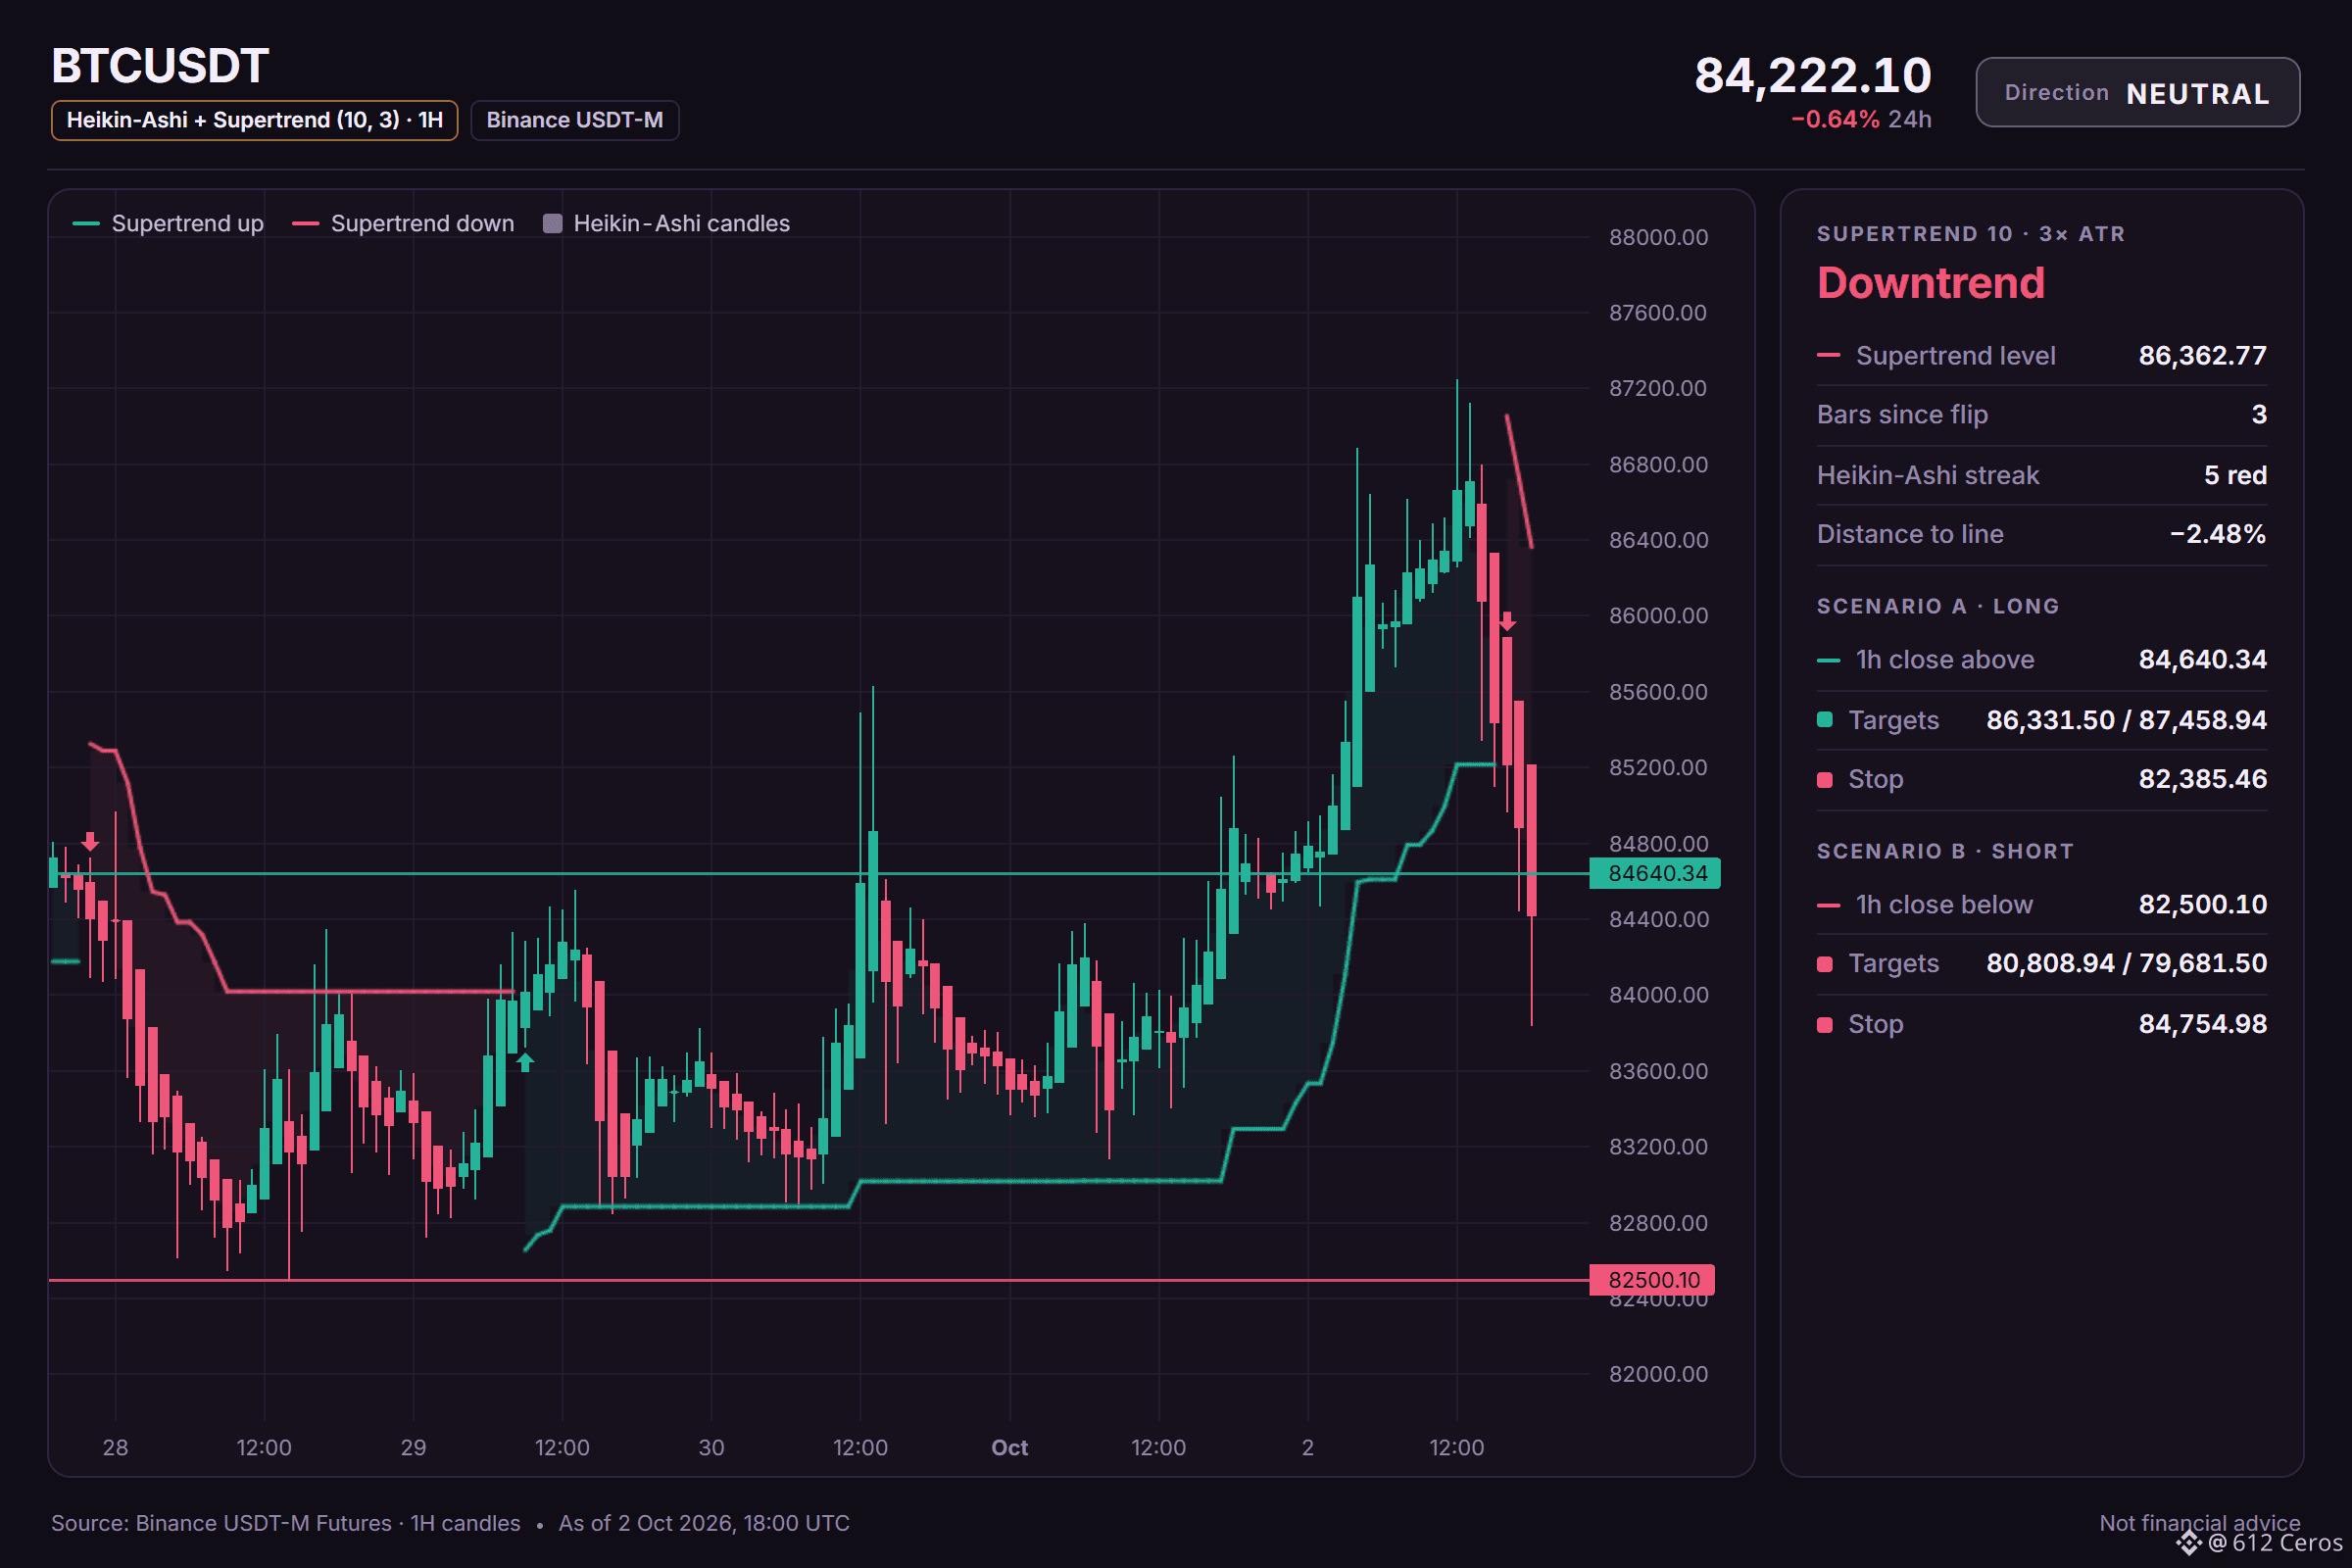
2
3
1.5k
·
--
Baissier
Can BR reverse the daily bullish trend on a single 1h breakdown?
🔴 SHORT $BR /USDT: expecting price to go DOWN
Bias: SHORT · Leaning
Entry: 0.6603226 – 0.6658374
TP1: 0.6093121 (-8.1%)
TP2: 0.5734669 (-13.5%)
TP3: 0.5196990 (-21.6%)
SL: 0.7347705 (+10.8%)
Plan: enter only inside the zone, take half at TP1, then move the stop to entry.
Caution: counter-trend idea backed by 5 signals only. Smaller size, hard stop.
Why SHORT? What I checked: 5/12 signals agree, 1 against, 6 undecided
• 1h trend: price < EMA50 < EMA200, bearish stack → the short-term trend is down
• Trend strength (ADX/DI, 15m): ADX 20.8 with sellers in control (DI+ 16.2 vs DI− 19.9) → sellers are driving the move
• 4h RSI: 31.7, bearish momentum (below 45) → sellers have the momentum
Watch: Daily trend: price > EMA50 > EMA200, bullish stack → the big-picture trend is up
Watch: The idea is wrong if price reaches the stop at 0.7347705
Verdict: The 1h bearish stack and RSI confirm seller control, but the daily bullish trend argues against it, so conviction is moderate.
Where would you place your stop if you were short here?
Chart with every level below.
{future}(BRUSDT)
📲 Want more of my latest signals? Join me here:
[https://app.binance.com/uni-qr/D26WbL9t](https://app.binance.com/uni-qr/D26WbL9t)
⚠️ Personal market analysis only. NFA — manage risk and DYOR.
Educational content, not investment advice or a recommendation to buy, sell, deposit, or withdraw any asset. No paid promotion or referral/affiliate links.
Can BR reverse the daily bullish trend on a single 1h breakdown?
🔴 SHORT $BR /USDT: expecting price to go DOWN
Bias: SHORT · Leaning
Entry: 0.6603226 – 0.6658374
TP1: 0.6093121 (-8.1%)
TP2: 0.5734669 (-13.5%)
TP3: 0.5196990 (-21.6%)
SL: 0.7347705 (+10.8%)
Plan: enter only inside the zone, take half at TP1, then move the stop to entry.
Caution: counter-trend idea backed by 5 signals only. Smaller size, hard stop.
Why SHORT? What I checked: 5/12 signals agree, 1 against, 6 undecided
• 1h trend: price < EMA50 < EMA200, bearish stack → the short-term trend is down
• Trend strength (ADX/DI, 15m): ADX 20.8 with sellers in control (DI+ 16.2 vs DI− 19.9) → sellers are driving the move
• 4h RSI: 31.7, bearish momentum (below 45) → sellers have the momentum
Watch: Daily trend: price > EMA50 > EMA200, bullish stack → the big-picture trend is up
Watch: The idea is wrong if price reaches the stop at 0.7347705
Verdict: The 1h bearish stack and RSI confirm seller control, but the daily bullish trend argues against it, so conviction is moderate.
Where would you place your stop if you were short here?
Chart with every level below.
📲 Want more of my latest signals? Join me here:
https://app.binance.com/uni-qr/D26WbL9t
⚠️ Personal market analysis only. NFA — manage risk and DYOR.
Educational content, not investment advice or a recommendation to buy, sell, deposit, or withdraw any asset. No paid promotion or referral/affiliate links.
🔴 SHORT $BR /USDT: expecting price to go DOWN
Bias: SHORT · Leaning
Entry: 0.6603226 – 0.6658374
TP1: 0.6093121 (-8.1%)
TP2: 0.5734669 (-13.5%)
TP3: 0.5196990 (-21.6%)
SL: 0.7347705 (+10.8%)
Plan: enter only inside the zone, take half at TP1, then move the stop to entry.
Caution: counter-trend idea backed by 5 signals only. Smaller size, hard stop.
Why SHORT? What I checked: 5/12 signals agree, 1 against, 6 undecided
• 1h trend: price < EMA50 < EMA200, bearish stack → the short-term trend is down
• Trend strength (ADX/DI, 15m): ADX 20.8 with sellers in control (DI+ 16.2 vs DI− 19.9) → sellers are driving the move
• 4h RSI: 31.7, bearish momentum (below 45) → sellers have the momentum
Watch: Daily trend: price > EMA50 > EMA200, bullish stack → the big-picture trend is up
Watch: The idea is wrong if price reaches the stop at 0.7347705
Verdict: The 1h bearish stack and RSI confirm seller control, but the daily bullish trend argues against it, so conviction is moderate.
Where would you place your stop if you were short here?
Chart with every level below.
📲 Want more of my latest signals? Join me here:
https://app.binance.com/uni-qr/D26WbL9t
⚠️ Personal market analysis only. NFA — manage risk and DYOR.
Educational content, not investment advice or a recommendation to buy, sell, deposit, or withdraw any asset. No paid promotion or referral/affiliate links.
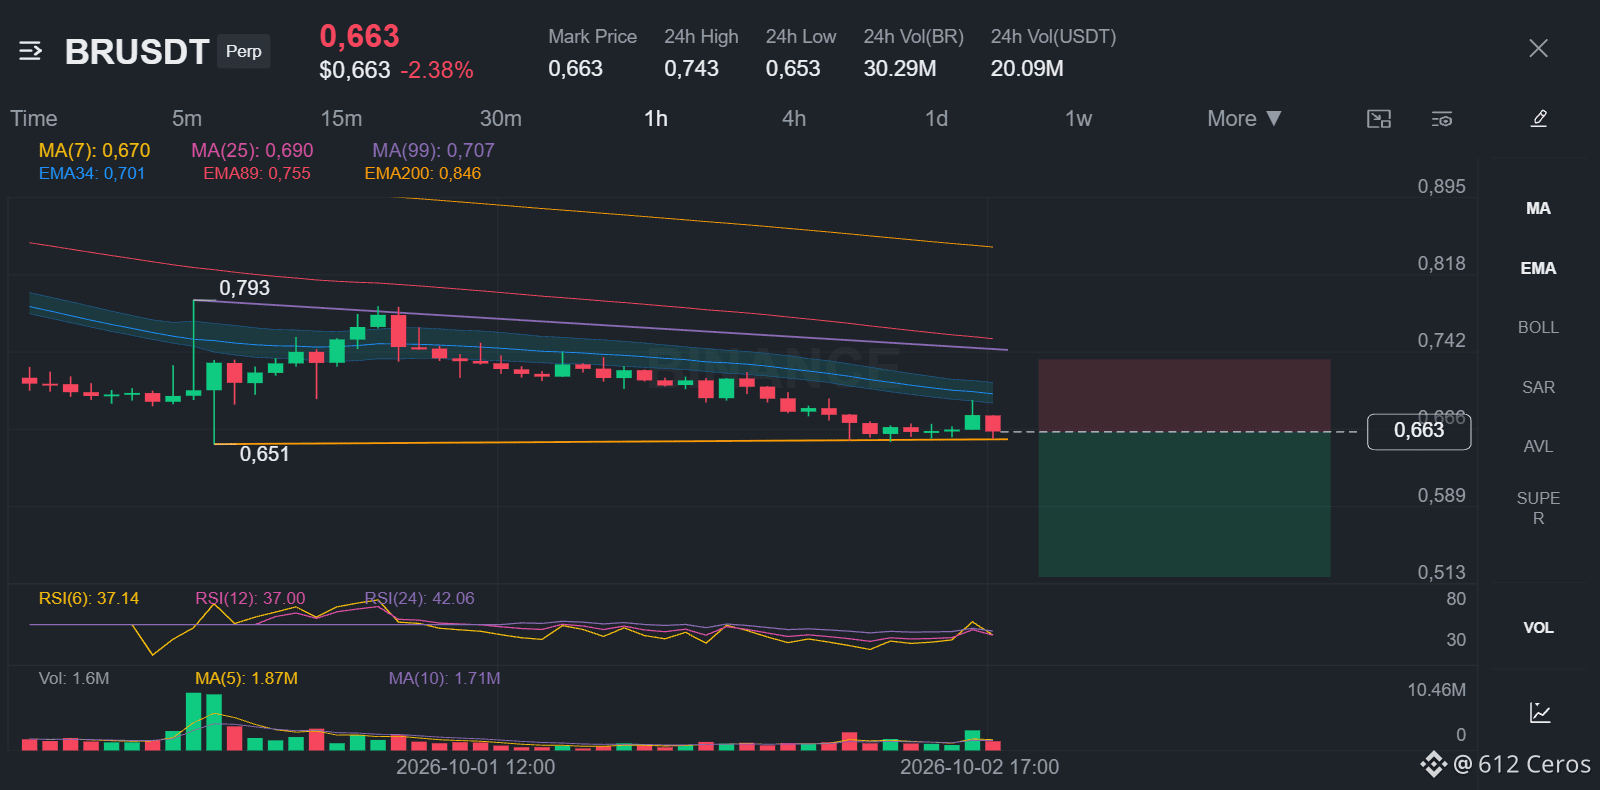
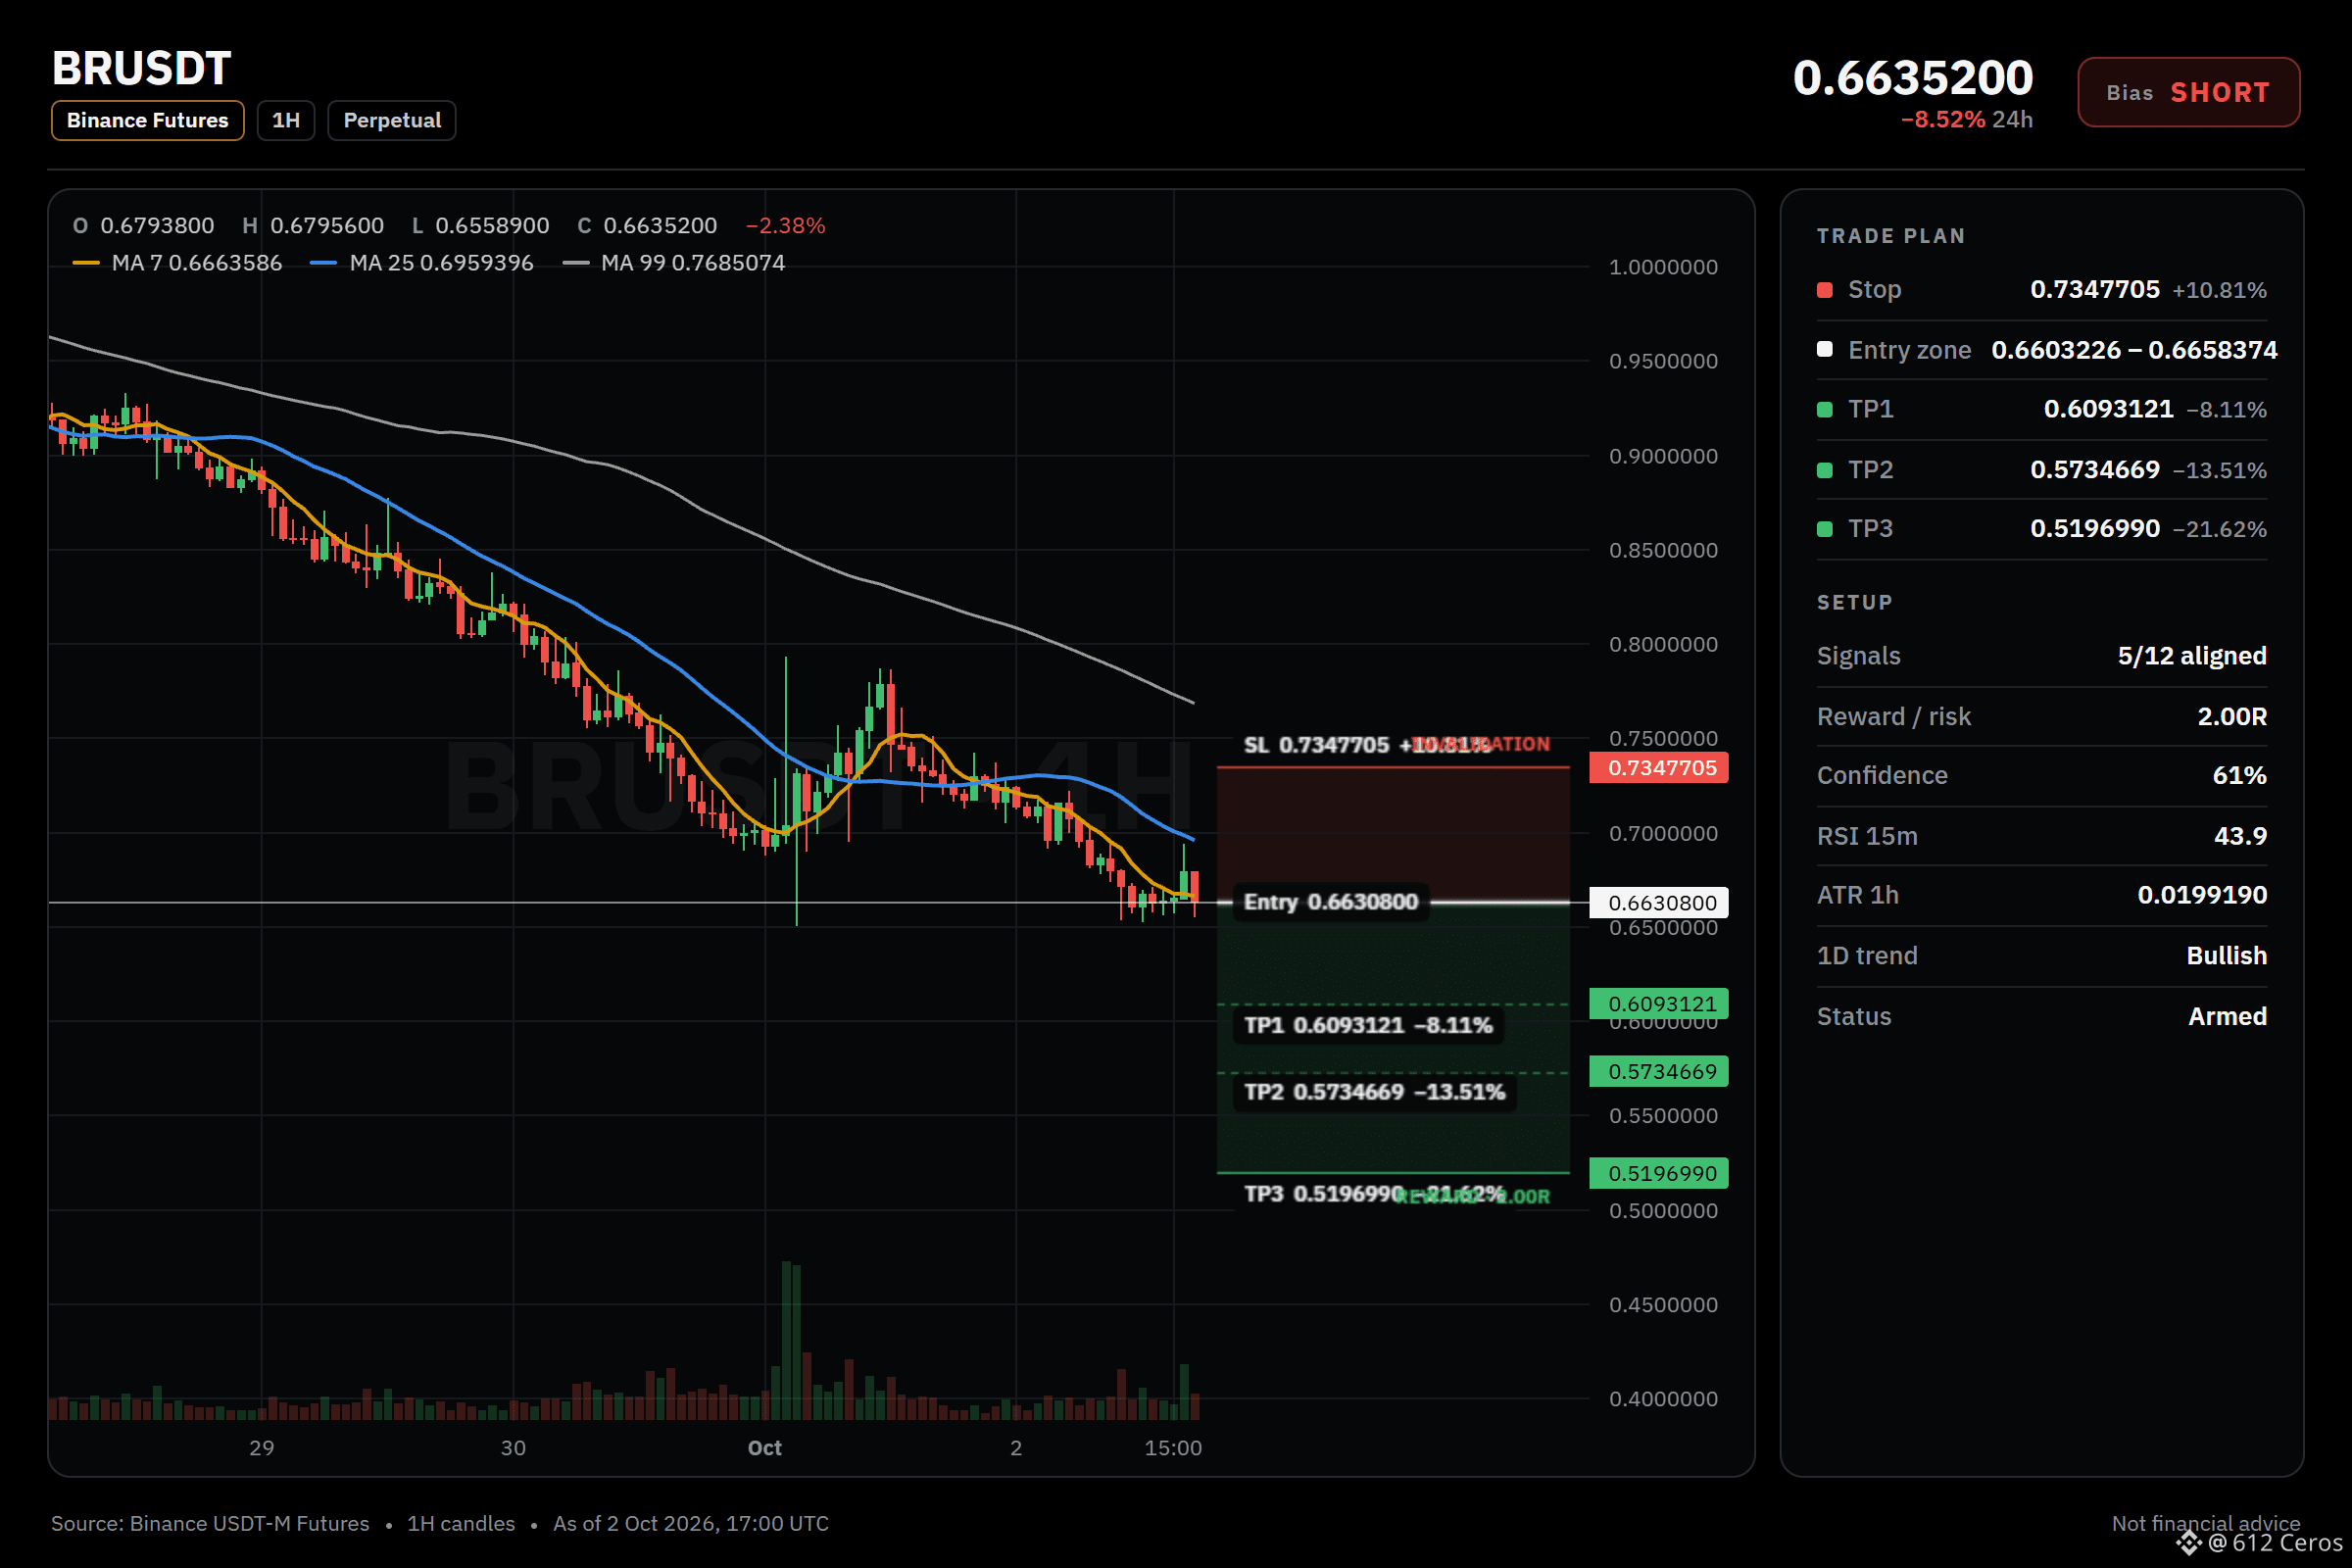
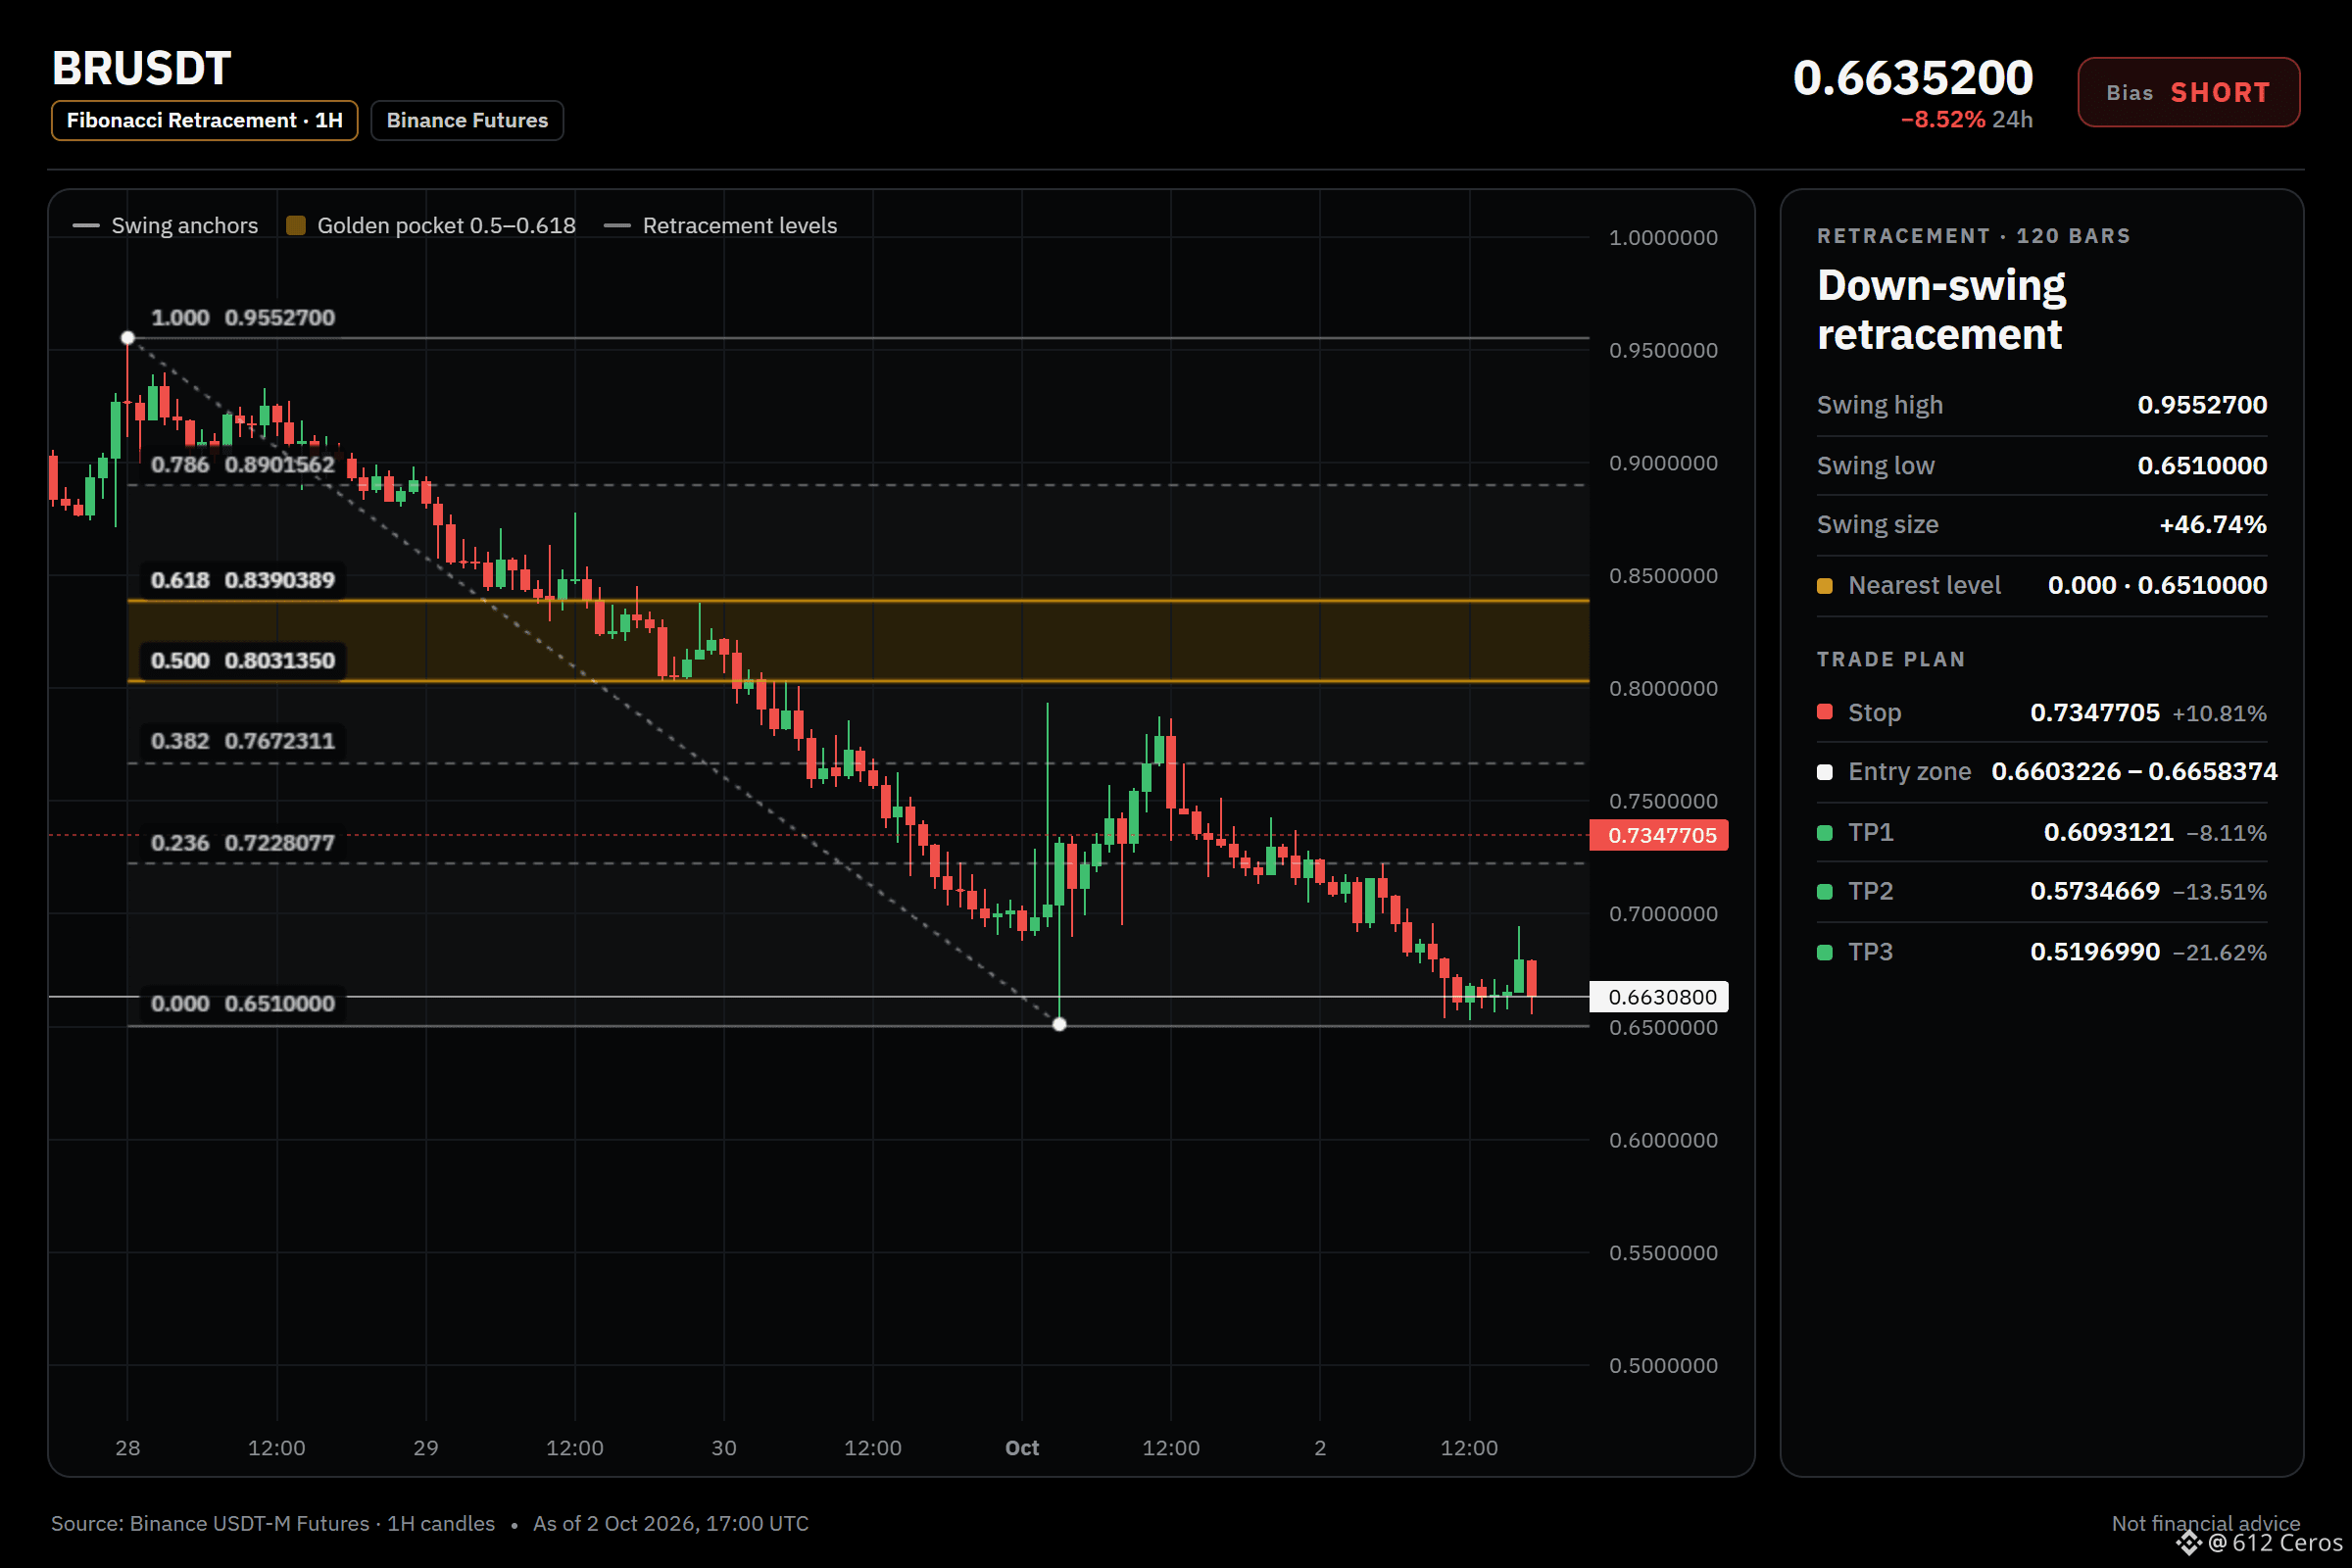
1
1.5k
·
--
SOL is not stuck in a myth of easy direction
$SOL /USDT: NO TRADE YET, waiting for one side to break
Bias: NEUTRAL · 4 bullish vs 3 bearish
What would make me act:
LONG on a 1h close above 123.7700 → targets 125.9725 / 127.4408 / 129.6432, stop 120.8334
SHORT on a 1h close below 117.0700 → targets 114.8675 / 113.3992 / 111.1968, stop 120.0066
In between (5.7% wide): no edge, no trade.
Technical read: NEUTRAL. 4 of 12 signals bullish, 3 bearish, 5 undecided.
What leans up:
• Daily trend: price > EMA50 > EMA200, bullish stack → the big-picture trend is up
• 4h trend: price > EMA50 > EMA200, bullish stack → the swing trend is up
What leans down:
• Trend strength (ADX/DI, 15m): ADX 24.8 with sellers in control (DI+ 13.3 vs DI− 24.7) → sellers are driving the move
• BTC backdrop: BTC trend is bearish and correlation is 0.80 → BTC is falling and this coin tends to follow
What would tip it:
There is no edge right now. The daily trend is bullish, but the 1h trend is mixed and sellers are pressing. The strongest bullish factor is the daily trend with price above EMA50 and EMA200, while the strongest bearish factor is the 15m trend where ADX 24.8 shows sellers in control with DI+ 13.3 versus DI- 24.7. Both scenarios need a 1h close beyond a trigger level before the position is taken.
Which trigger level do you think will hold first, the 24h high or the 24h low?
Levels mapped on the chart below.
{future}(SOLUSDT)
📲 Want more of my latest signals? Join me here:
[https://app.binance.com/uni-qr/D26WbL9t](https://app.binance.com/uni-qr/D26WbL9t)
⚠️ Personal market analysis only. NFA — manage risk and DYOR.
Educational content, not investment advice or a recommendation to buy, sell, deposit, or withdraw any asset. No paid promotion or referral/affiliate links.
SOL is not stuck in a myth of easy direction
$SOL /USDT: NO TRADE YET, waiting for one side to break
Bias: NEUTRAL · 4 bullish vs 3 bearish
What would make me act:
LONG on a 1h close above 123.7700 → targets 125.9725 / 127.4408 / 129.6432, stop 120.8334
SHORT on a 1h close below 117.0700 → targets 114.8675 / 113.3992 / 111.1968, stop 120.0066
In between (5.7% wide): no edge, no trade.
Technical read: NEUTRAL. 4 of 12 signals bullish, 3 bearish, 5 undecided.
What leans up:
• Daily trend: price > EMA50 > EMA200, bullish stack → the big-picture trend is up
• 4h trend: price > EMA50 > EMA200, bullish stack → the swing trend is up
What leans down:
• Trend strength (ADX/DI, 15m): ADX 24.8 with sellers in control (DI+ 13.3 vs DI− 24.7) → sellers are driving the move
• BTC backdrop: BTC trend is bearish and correlation is 0.80 → BTC is falling and this coin tends to follow
What would tip it:
There is no edge right now. The daily trend is bullish, but the 1h trend is mixed and sellers are pressing. The strongest bullish factor is the daily trend with price above EMA50 and EMA200, while the strongest bearish factor is the 15m trend where ADX 24.8 shows sellers in control with DI+ 13.3 versus DI- 24.7. Both scenarios need a 1h close beyond a trigger level before the position is taken.
Which trigger level do you think will hold first, the 24h high or the 24h low?
Levels mapped on the chart below.
📲 Want more of my latest signals? Join me here:
https://app.binance.com/uni-qr/D26WbL9t
⚠️ Personal market analysis only. NFA — manage risk and DYOR.
Educational content, not investment advice or a recommendation to buy, sell, deposit, or withdraw any asset. No paid promotion or referral/affiliate links.
$SOL /USDT: NO TRADE YET, waiting for one side to break
Bias: NEUTRAL · 4 bullish vs 3 bearish
What would make me act:
LONG on a 1h close above 123.7700 → targets 125.9725 / 127.4408 / 129.6432, stop 120.8334
SHORT on a 1h close below 117.0700 → targets 114.8675 / 113.3992 / 111.1968, stop 120.0066
In between (5.7% wide): no edge, no trade.
Technical read: NEUTRAL. 4 of 12 signals bullish, 3 bearish, 5 undecided.
What leans up:
• Daily trend: price > EMA50 > EMA200, bullish stack → the big-picture trend is up
• 4h trend: price > EMA50 > EMA200, bullish stack → the swing trend is up
What leans down:
• Trend strength (ADX/DI, 15m): ADX 24.8 with sellers in control (DI+ 13.3 vs DI− 24.7) → sellers are driving the move
• BTC backdrop: BTC trend is bearish and correlation is 0.80 → BTC is falling and this coin tends to follow
What would tip it:
There is no edge right now. The daily trend is bullish, but the 1h trend is mixed and sellers are pressing. The strongest bullish factor is the daily trend with price above EMA50 and EMA200, while the strongest bearish factor is the 15m trend where ADX 24.8 shows sellers in control with DI+ 13.3 versus DI- 24.7. Both scenarios need a 1h close beyond a trigger level before the position is taken.
Which trigger level do you think will hold first, the 24h high or the 24h low?
Levels mapped on the chart below.
📲 Want more of my latest signals? Join me here:
https://app.binance.com/uni-qr/D26WbL9t
⚠️ Personal market analysis only. NFA — manage risk and DYOR.
Educational content, not investment advice or a recommendation to buy, sell, deposit, or withdraw any asset. No paid promotion or referral/affiliate links.
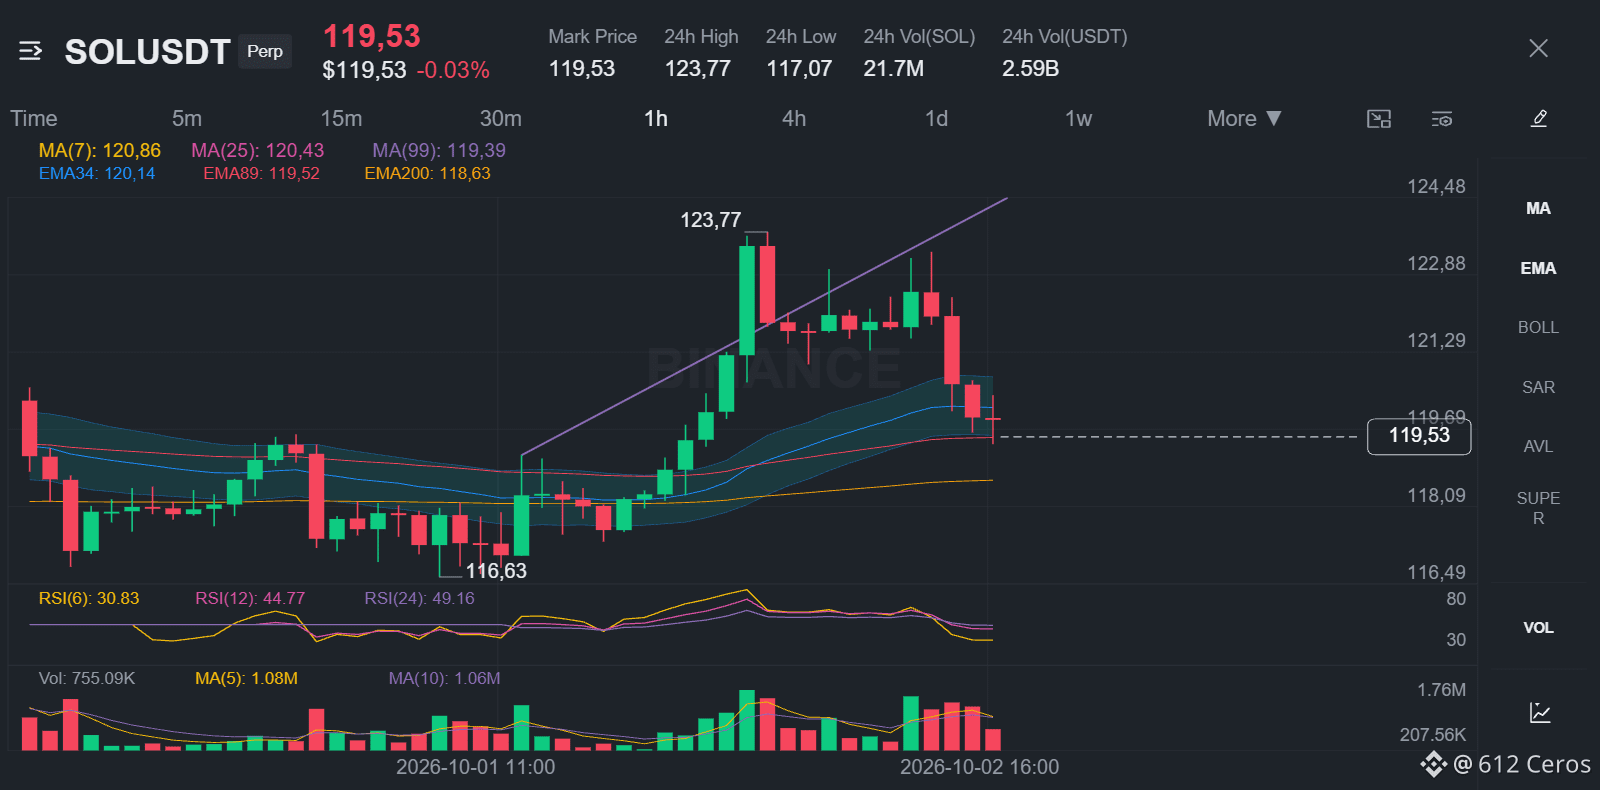
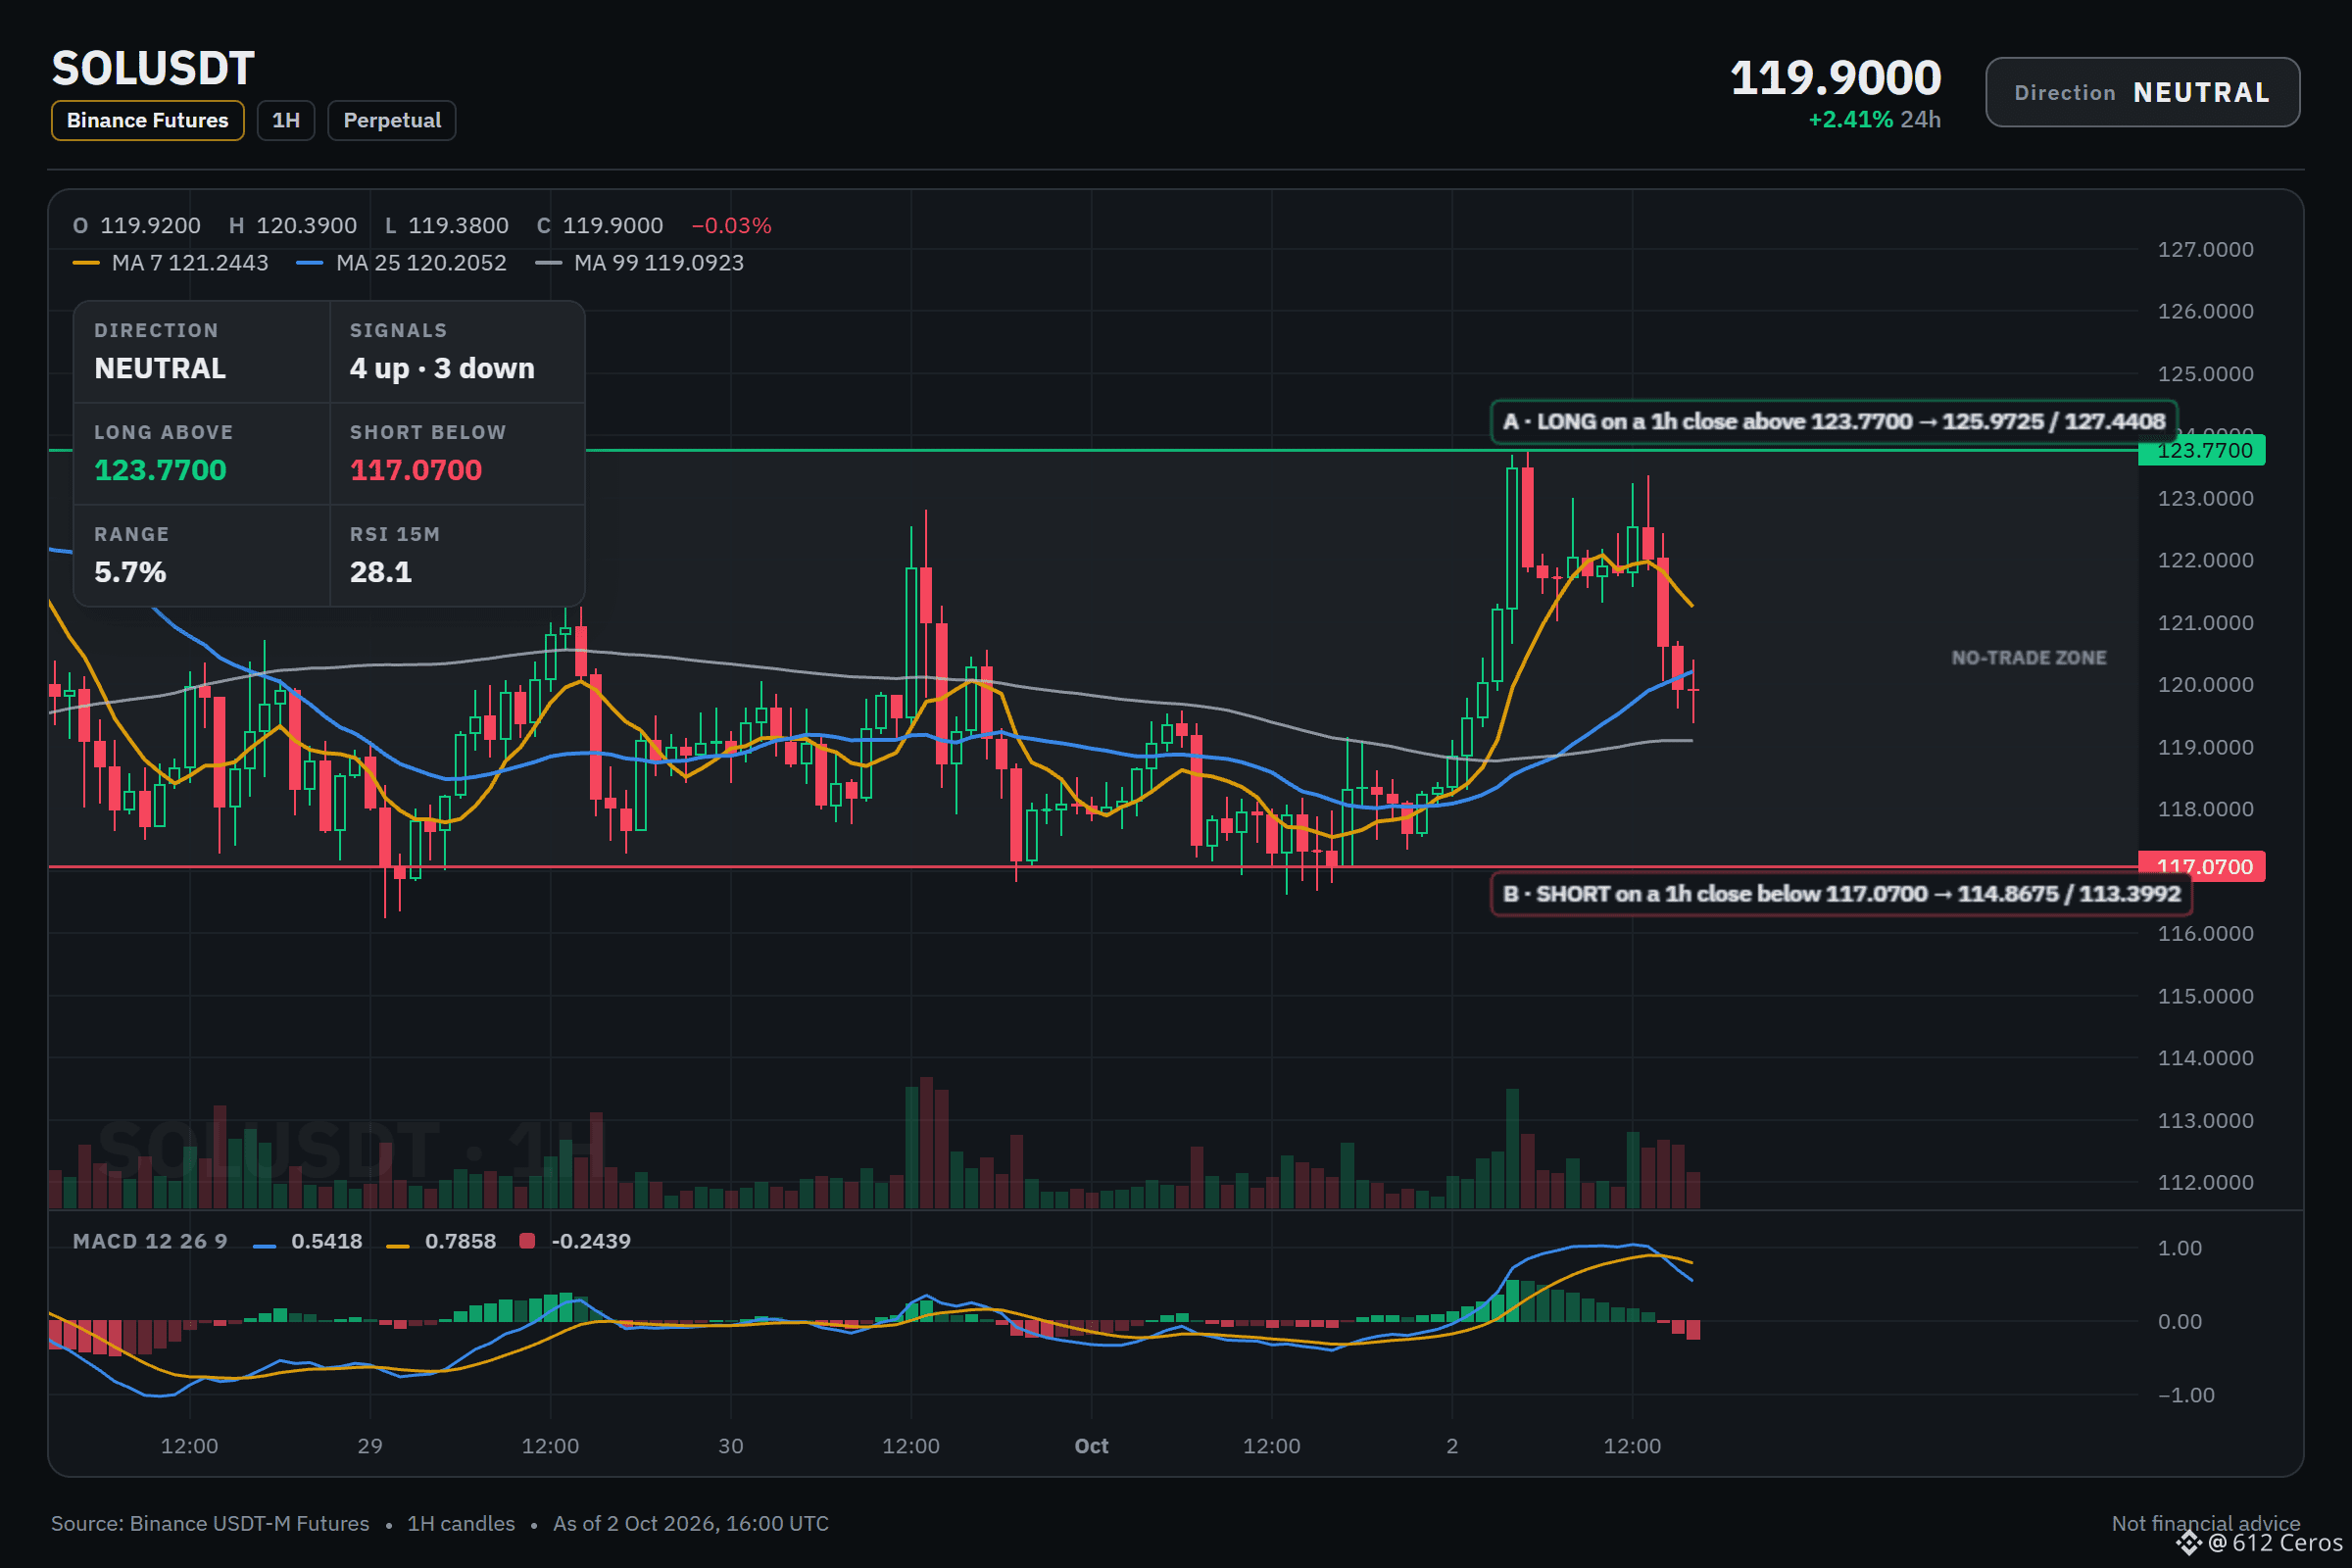
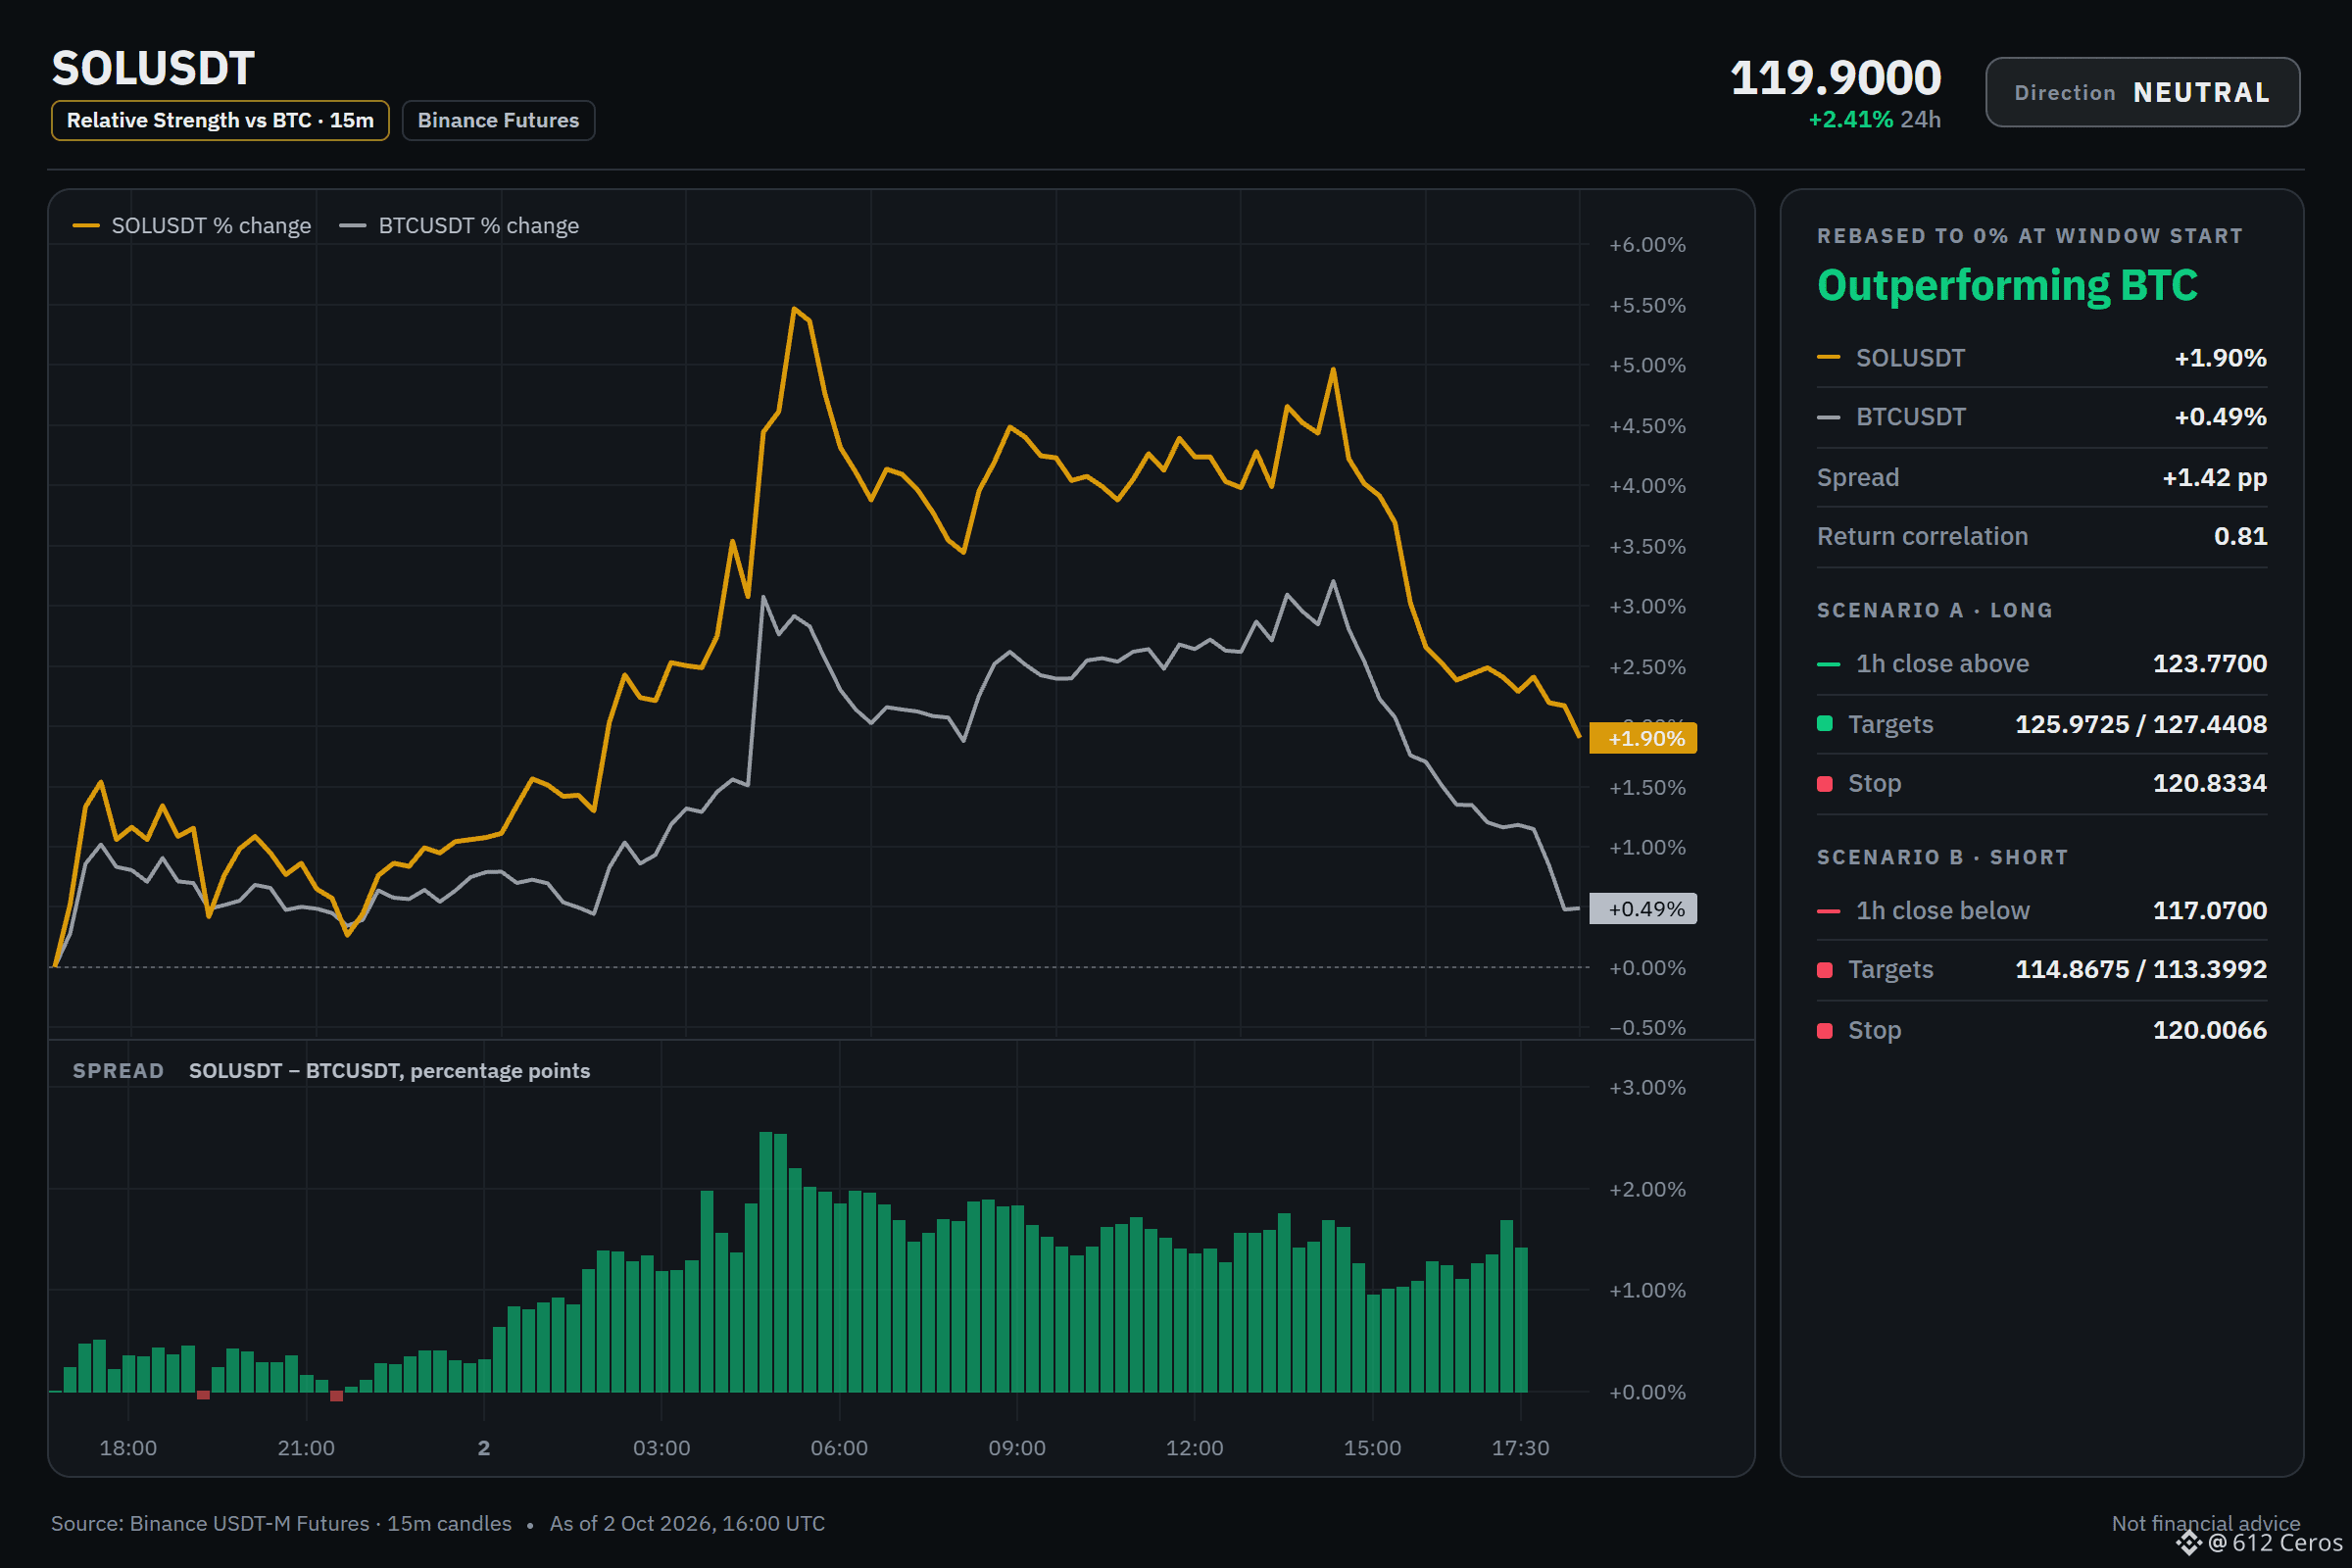
1.1k
·
--
ETH lacks an edge as price sits between key levels
$ETH /USDT: NO TRADE YET, waiting for one side to break
Bias: NEUTRAL · 1 bullish vs 3 bearish
The plan is conditional:
LONG on a 1h close above 2721.39 → targets 2781.54 / 2821.64 / 2881.79, stop 2641.19
SHORT on a 1h close below 2650.50 → targets 2590.35 / 2550.25 / 2490.10, stop 2730.70
In between (2.7% wide): no edge, no trade.
Technical read: NEUTRAL. 1 of 12 signals bullish, 3 bearish, 8 undecided.
For the bulls:
• Daily trend: price > EMA50 > EMA200, bullish stack → the big-picture trend is up
For the bears:
• Trend strength (ADX/DI, 15m): ADX 30.2 with sellers in control (DI+ 11.2 vs DI− 24.6) → sellers are driving the move
• BTC backdrop: BTC trend is bearish and correlation is 0.84 → BTC is falling and this coin tends to follow
Why I'm flat:
There is no edge right now. The daily trend is bullish, which is the strongest support. The strongest risk is sellers driving the move on the 1h chart, with ADX at 30.2 and DI minus at 24.6 versus DI plus at 11.2, meaning sellers are in control. A trigger is needed before any position.
Where would you place a trigger level on the 1h chart, and why?
Levels mapped on the chart below.
{future}(ETHUSDT)
📲 Want more of my latest signals? Join me here:
[https://app.binance.com/uni-qr/D26WbL9t](https://app.binance.com/uni-qr/D26WbL9t)
⚠️ Personal market analysis only. NFA — manage risk and DYOR.
Educational content, not investment advice or a recommendation to buy, sell, deposit, or withdraw any asset. No paid promotion or referral/affiliate links.
ETH lacks an edge as price sits between key levels
$ETH /USDT: NO TRADE YET, waiting for one side to break
Bias: NEUTRAL · 1 bullish vs 3 bearish
The plan is conditional:
LONG on a 1h close above 2721.39 → targets 2781.54 / 2821.64 / 2881.79, stop 2641.19
SHORT on a 1h close below 2650.50 → targets 2590.35 / 2550.25 / 2490.10, stop 2730.70
In between (2.7% wide): no edge, no trade.
Technical read: NEUTRAL. 1 of 12 signals bullish, 3 bearish, 8 undecided.
For the bulls:
• Daily trend: price > EMA50 > EMA200, bullish stack → the big-picture trend is up
For the bears:
• Trend strength (ADX/DI, 15m): ADX 30.2 with sellers in control (DI+ 11.2 vs DI− 24.6) → sellers are driving the move
• BTC backdrop: BTC trend is bearish and correlation is 0.84 → BTC is falling and this coin tends to follow
Why I'm flat:
There is no edge right now. The daily trend is bullish, which is the strongest support. The strongest risk is sellers driving the move on the 1h chart, with ADX at 30.2 and DI minus at 24.6 versus DI plus at 11.2, meaning sellers are in control. A trigger is needed before any position.
Where would you place a trigger level on the 1h chart, and why?
Levels mapped on the chart below.
📲 Want more of my latest signals? Join me here:
https://app.binance.com/uni-qr/D26WbL9t
⚠️ Personal market analysis only. NFA — manage risk and DYOR.
Educational content, not investment advice or a recommendation to buy, sell, deposit, or withdraw any asset. No paid promotion or referral/affiliate links.
$ETH /USDT: NO TRADE YET, waiting for one side to break
Bias: NEUTRAL · 1 bullish vs 3 bearish
The plan is conditional:
LONG on a 1h close above 2721.39 → targets 2781.54 / 2821.64 / 2881.79, stop 2641.19
SHORT on a 1h close below 2650.50 → targets 2590.35 / 2550.25 / 2490.10, stop 2730.70
In between (2.7% wide): no edge, no trade.
Technical read: NEUTRAL. 1 of 12 signals bullish, 3 bearish, 8 undecided.
For the bulls:
• Daily trend: price > EMA50 > EMA200, bullish stack → the big-picture trend is up
For the bears:
• Trend strength (ADX/DI, 15m): ADX 30.2 with sellers in control (DI+ 11.2 vs DI− 24.6) → sellers are driving the move
• BTC backdrop: BTC trend is bearish and correlation is 0.84 → BTC is falling and this coin tends to follow
Why I'm flat:
There is no edge right now. The daily trend is bullish, which is the strongest support. The strongest risk is sellers driving the move on the 1h chart, with ADX at 30.2 and DI minus at 24.6 versus DI plus at 11.2, meaning sellers are in control. A trigger is needed before any position.
Where would you place a trigger level on the 1h chart, and why?
Levels mapped on the chart below.
📲 Want more of my latest signals? Join me here:
https://app.binance.com/uni-qr/D26WbL9t
⚠️ Personal market analysis only. NFA — manage risk and DYOR.
Educational content, not investment advice or a recommendation to buy, sell, deposit, or withdraw any asset. No paid promotion or referral/affiliate links.
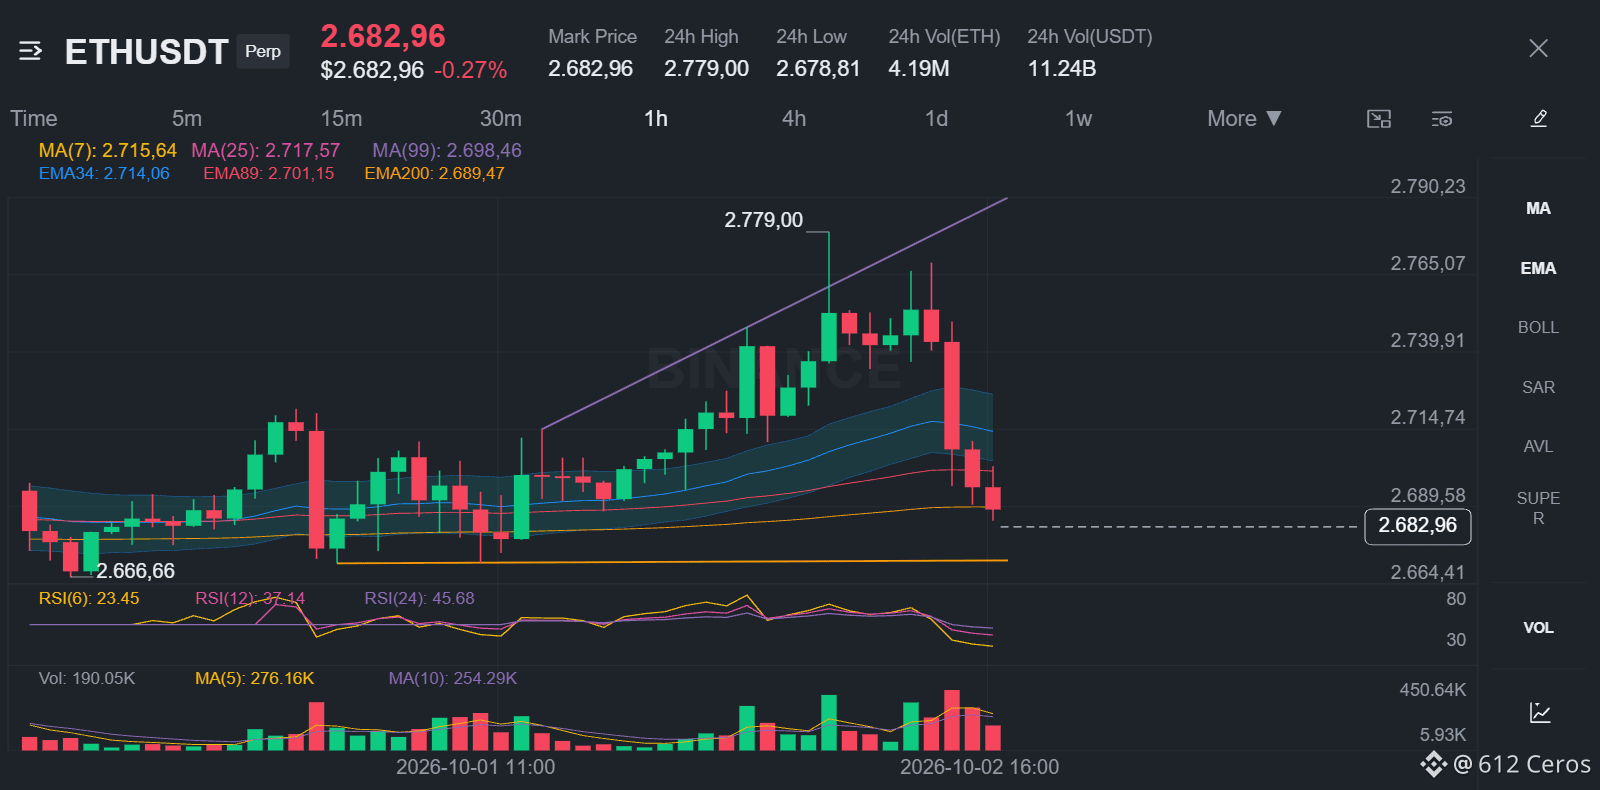
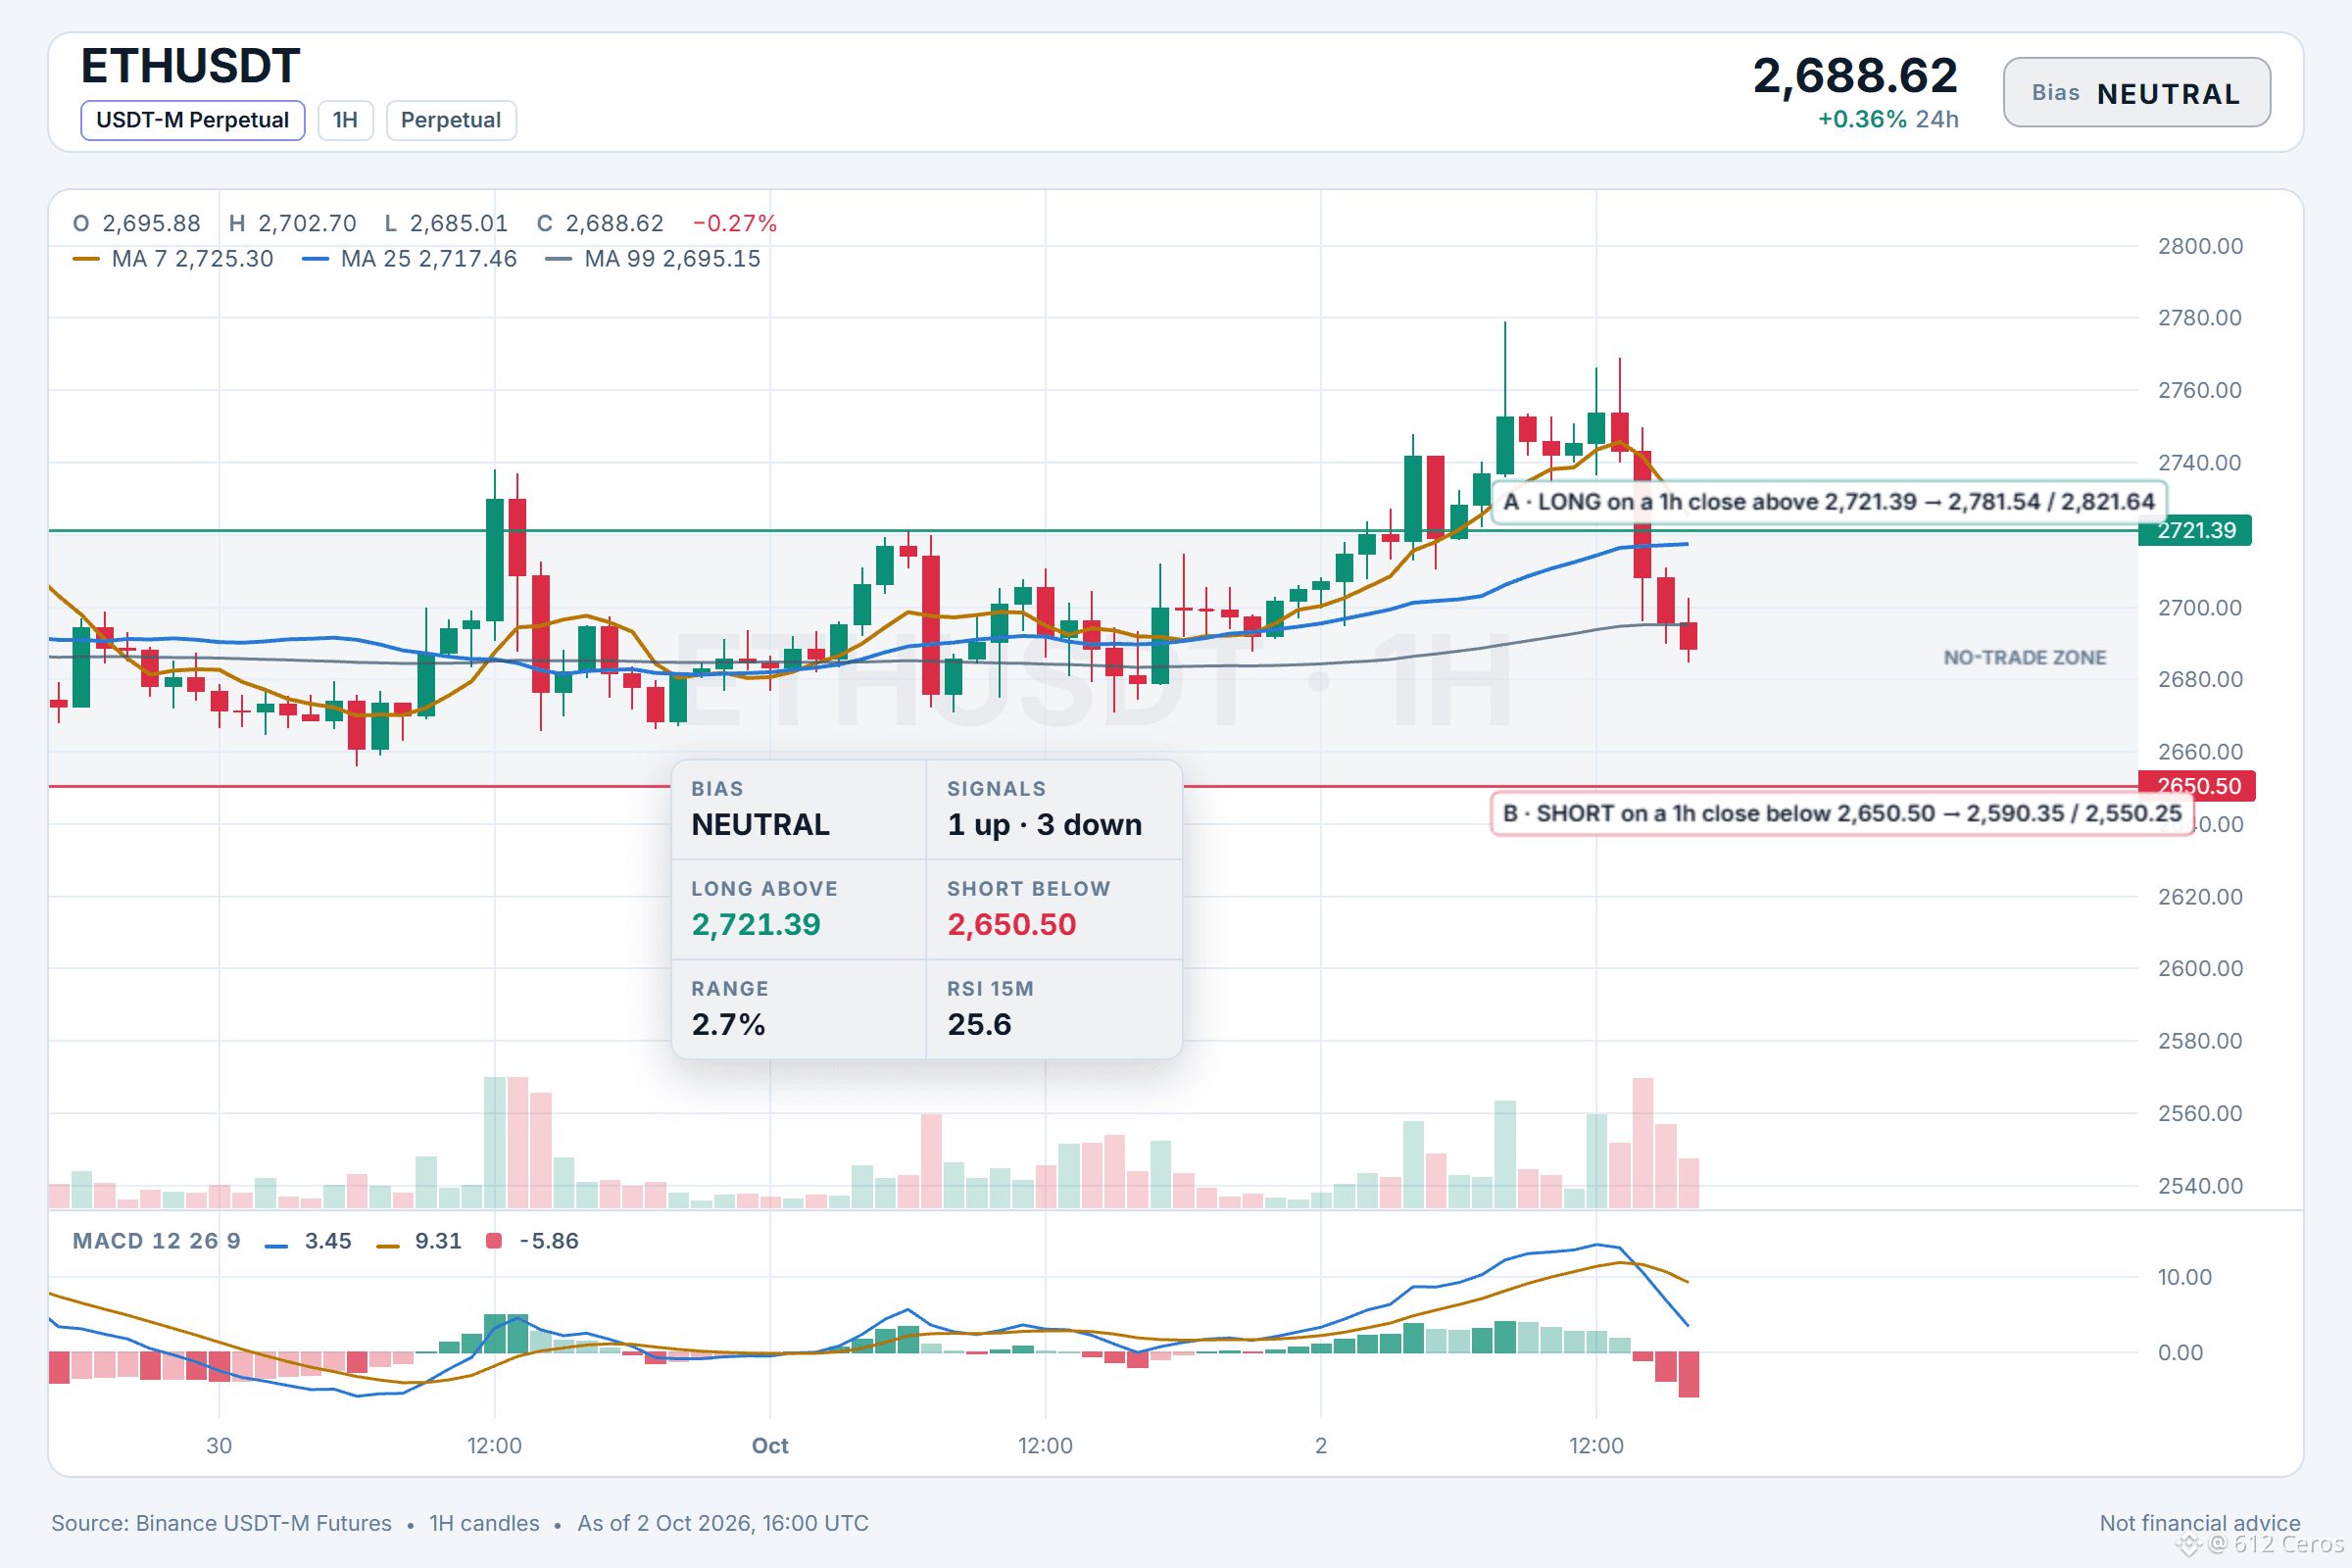
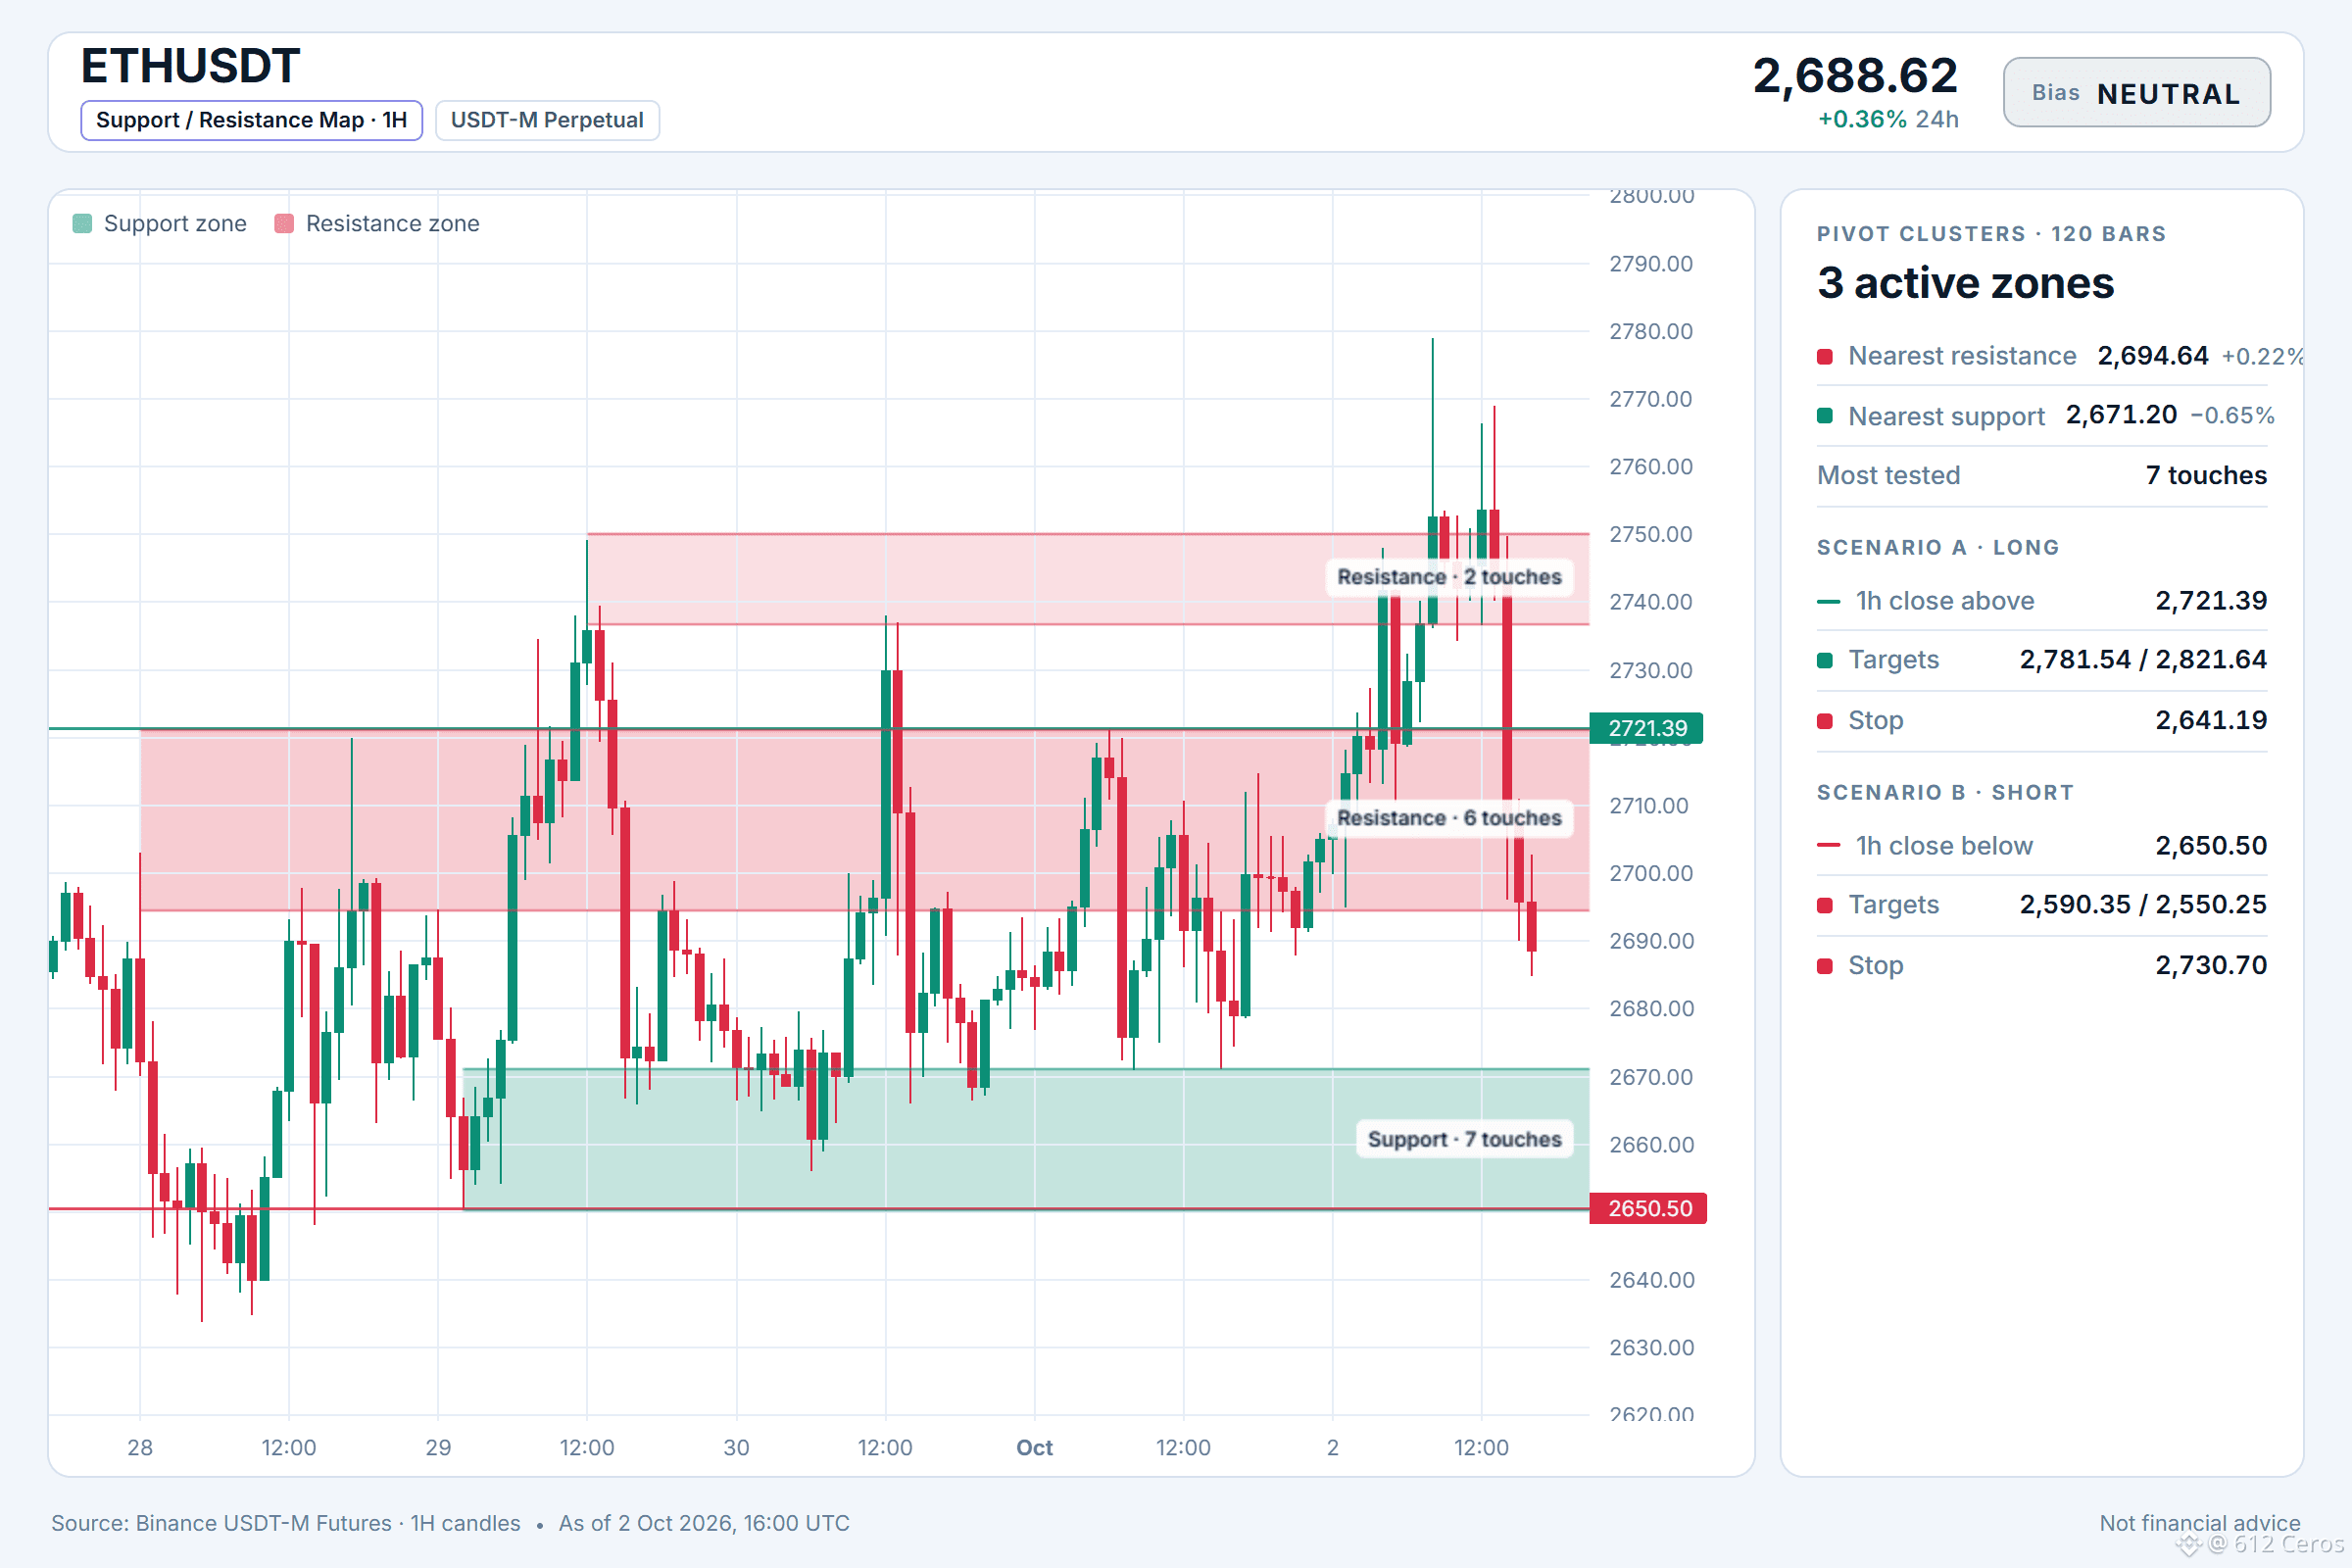
1k
Connectez-vous pour découvrir plus de contenu
Rejoignez la communauté mondiale des adeptes de cryptomonnaies sur Binance Square
⚡️ Suviez les dernières informations importantes sur les cryptomonnaies.
💬 Jugé digne de confiance par la plus grande plateforme d’échange de cryptomonnaies au monde.
👍 Découvrez les connaissances que partagent les créateurs vérifiés.
Adresse e-mail/Nº de téléphone