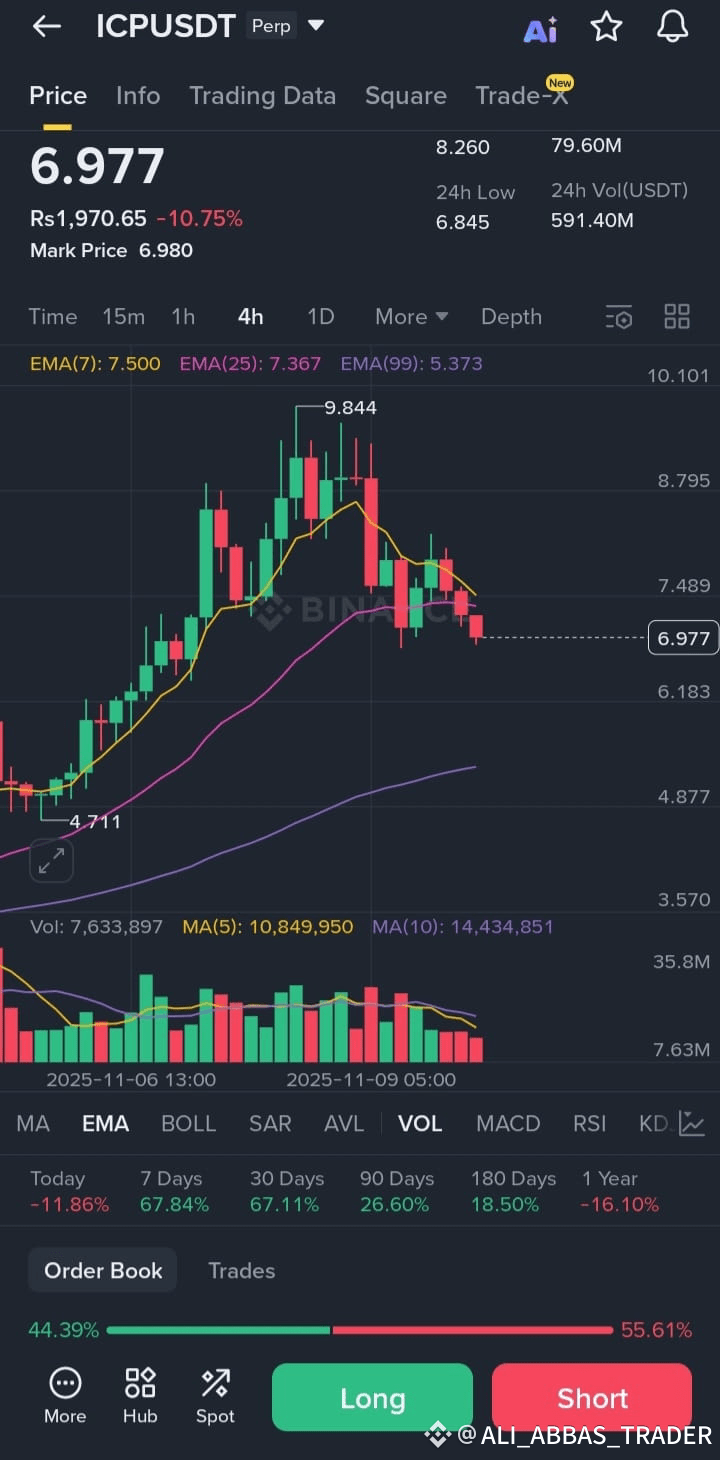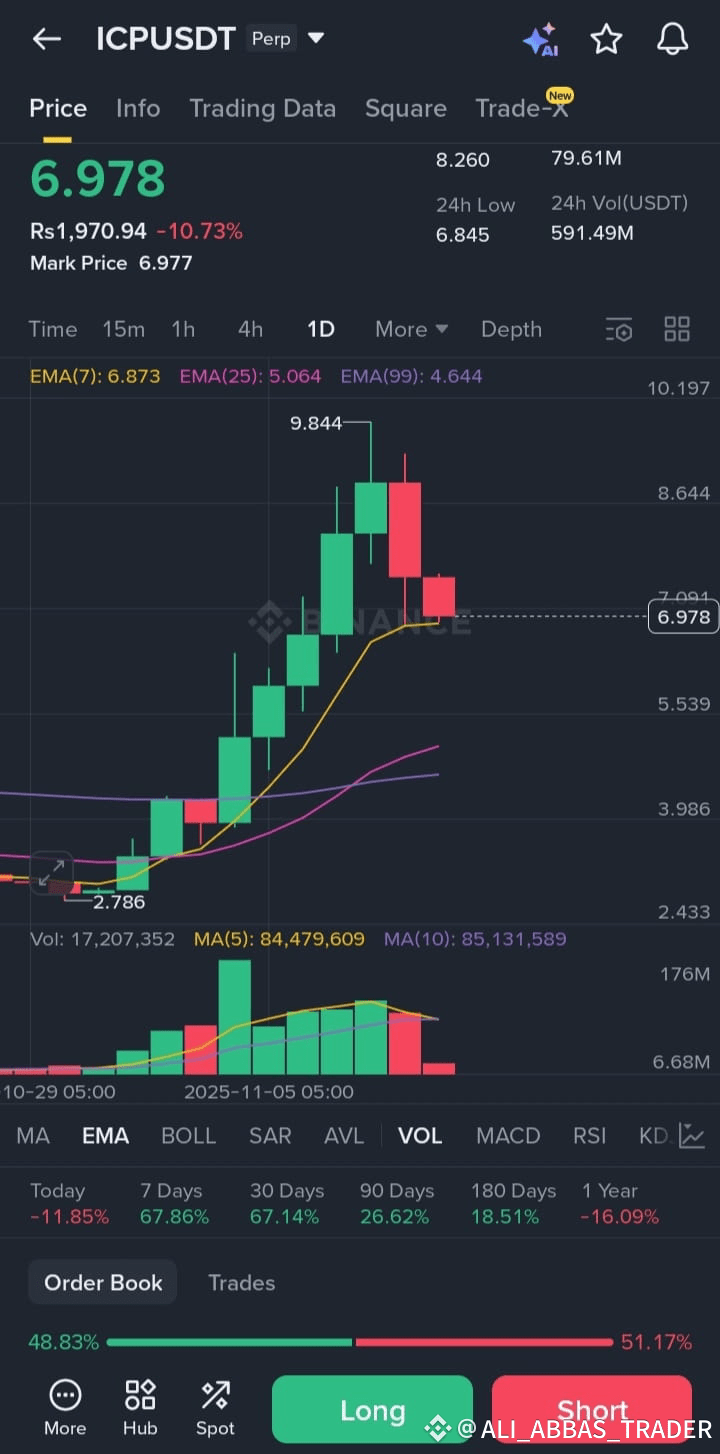
$ICP 📈 Aperçu récent des performances du marché
Le tableau ci-dessous résume les données de performance disponibles pour ICPUSDT provenant de différentes sources.
📊 Indicateurs clés : La reprise a été confirmée par un volume de trading élevé. L'RSI (Indice de Force Relative) a atteint des niveaux de surachat, suggérant un risque potentiel de repli des prix.
· 📍 Niveaux de prix importants : Le niveau de retracement de Fibonacci de 61,8 % (environ 3,223 $) a agi comme un support clé. La zone **3,30 $–3,49 $** a été identifiée comme une zone de résistance à court terme à surveiller.
· 📉 Structure du marché : L'action des prix a montré une forte baisse suivie d'une forte inversion, indiquant que les acheteurs sont intervenus à des niveaux de prix inférieurs.
#CPIWatch
Le tableau ci-dessous résume les données de performance disponibles pour ICPUSDT provenant de différentes sources.
📊 Indicateurs clés : La reprise a été confirmée par un volume de trading élevé. L'RSI (Indice de Force Relative) a atteint des niveaux de surachat, suggérant un risque potentiel de repli des prix.
· 📍 Niveaux de prix importants : Le niveau de retracement de Fibonacci de 61,8 % (environ 3,223 $) a agi comme un support clé. La zone **3,30 $–3,49 $** a été identifiée comme une zone de résistance à court terme à surveiller.
· 📉 Structure du marché : L'action des prix a montré une forte baisse suivie d'une forte inversion, indiquant que les acheteurs sont intervenus à des niveaux de prix inférieurs.
#CPIWatch