


📈 BTC/USDT Weekly Chart Analysis
"I conducted a thorough analysis of the BTC/USDT weekly chart and observed a highly significant technical pattern. My findings suggest a critical point for the market's long-term trajectory, backed by technical, fundamental, and news-based assessments."
1. 📊 Technical Assessment (My Observation)
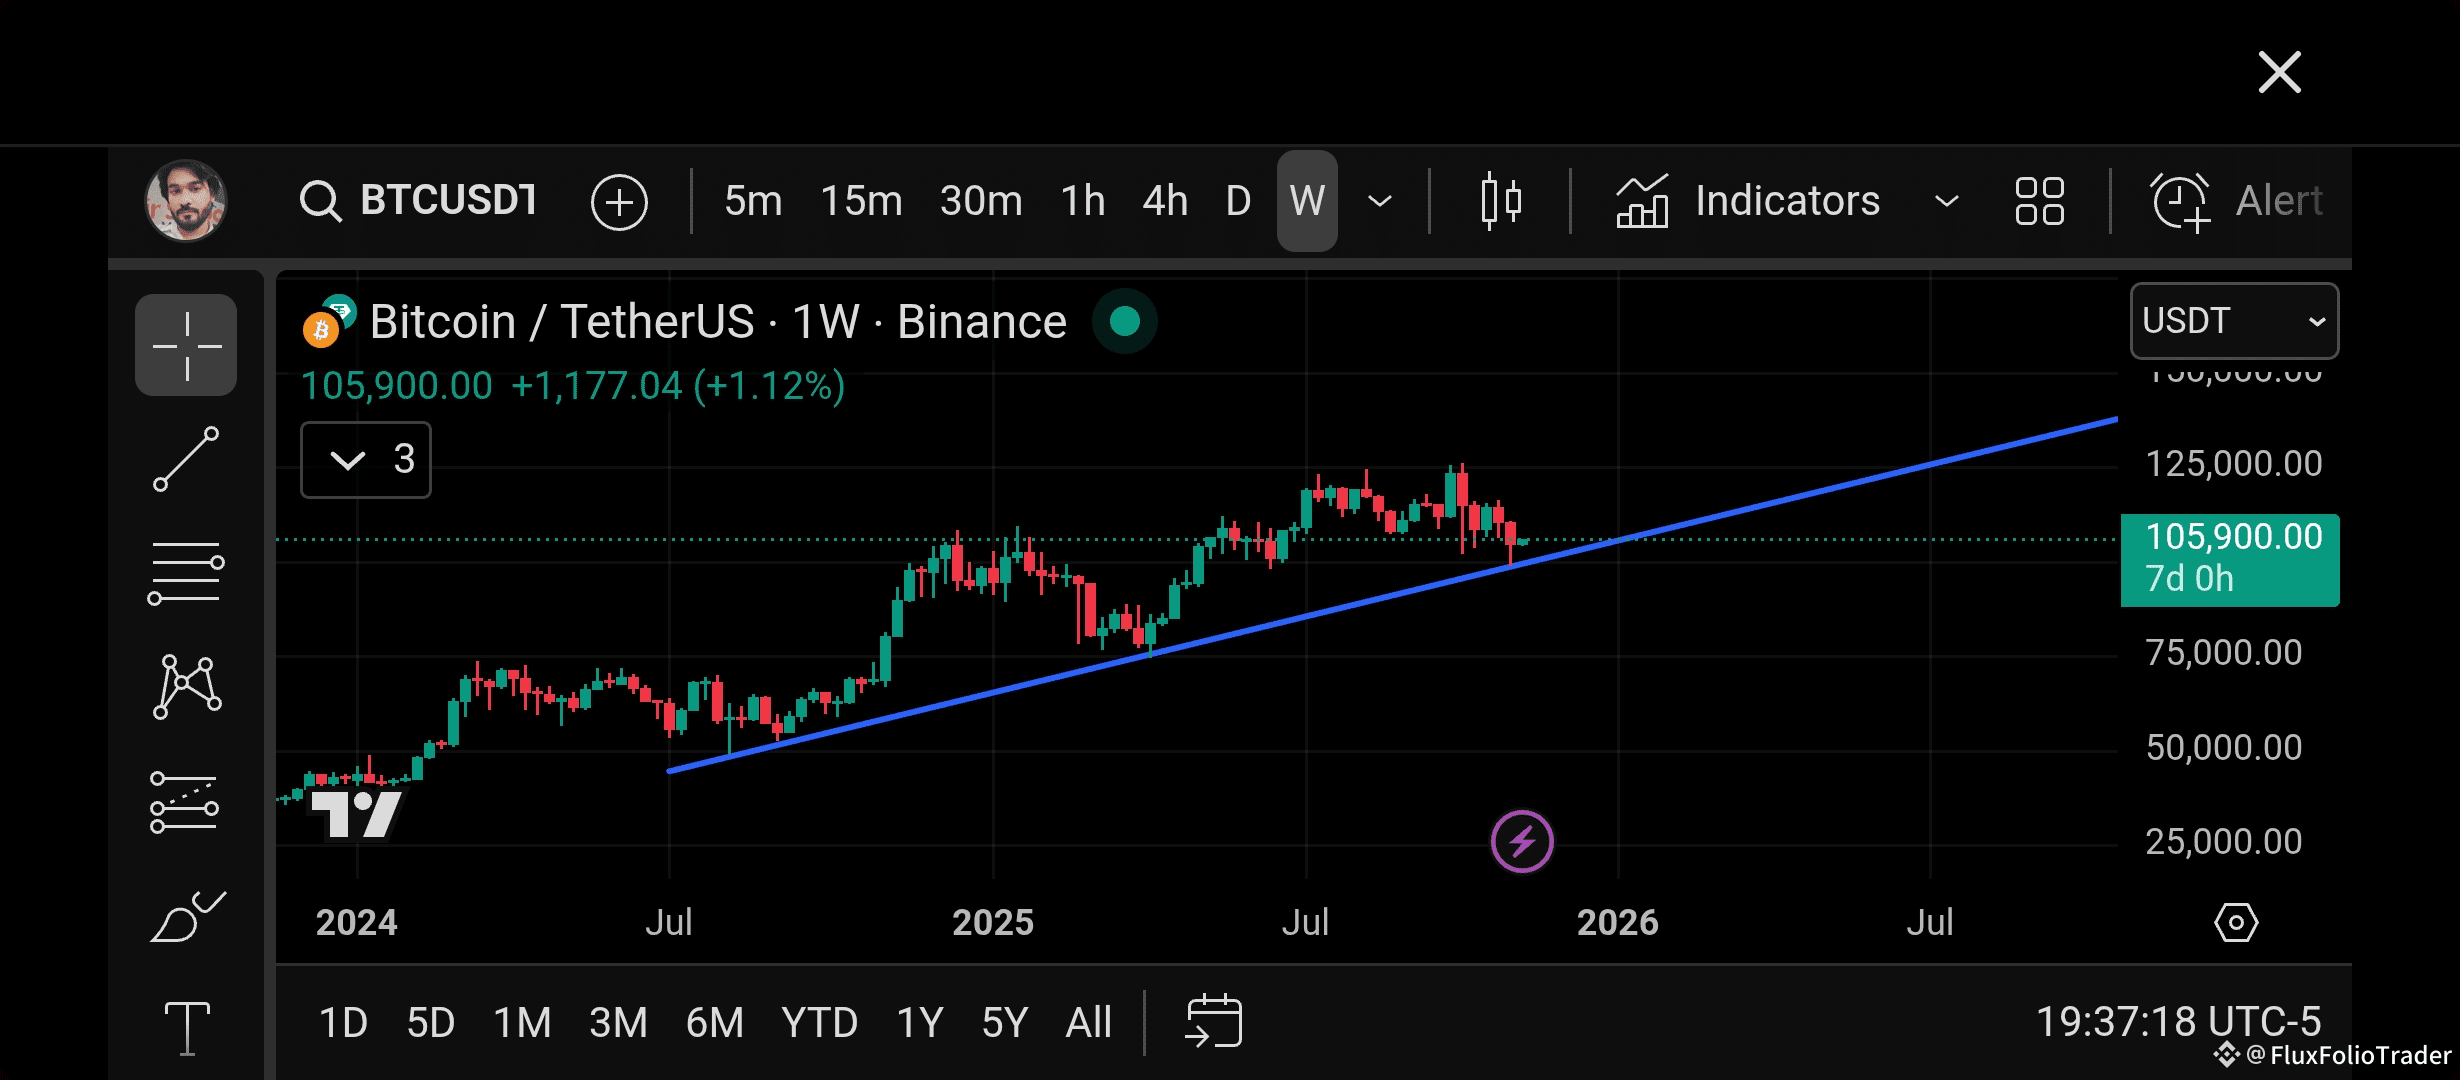
My focus is on the long-term Uptrend Trendline visible on the weekly timeframe:
Trendline Significance: As seen in the chart, the market has consistently failed to break this ascending trendline over the past year. Each touchpoint resulted in a strong Rejection (bounce), followed by a notable price pump.
Current Position: The current price action (around $105,900) is testing this exact trendline, suggesting it is acting as a major Dynamic Support Zone.
Conclusion: The long-term bullish bias remains intact as long as the weekly candle does not close below this trendline.
2. 🎯 Technical Scenarios
Bullish Scenario (Continuation): If history repeats, a successful rejection from this trendline will confirm the existing uptrend. This would likely target the previous psychological and technical resistance level around $125,000. A decisive break above $125,000 would open the path towards a new All-Time High (ATH) and potentially higher targets, possibly towards the $150,000 range.
Bearish Scenario (Invalidation Risk): The primary risk is a confirmed weekly close below the trendline. This would invalidate the long-term bullish structure and signal a sharp reversal or deeper correction, requiring a complete reassessment of the buying strategy.
3. 📰 Fundamental & Macro Influencers
For a comprehensive outlook, the following fundamental drivers must be considered:
Institutional Inflows (ETFs): Continuous positive net inflows into US Spot Bitcoin ETFs remain a major fundamental tailwind, driving institutional demand and supporting the current price action.
Post-Halving Dynamics: Historically, the period following the Bitcoin Halving event sets the stage for the next major bull run. The ongoing supply squeeze reinforces a long-term bullish outlook.
On-Chain Data: Data suggests that long-term investors (HODLers) are accumulating and holding their BTC, leading to a reduced supply available on exchanges, which is fundamentally supportive of higher prices.
4. ⚖️ Final Trading Thesis
My analysis confirms that Bitcoin is at a critical juncture. The technical support is powerful, and the underlying fundamental drivers are strong.
Will the market deliver a new ATH? Based on the reliable trendline support and macro environment, the probability of a significant rebound and eventually surpassing the previous high is strong.
Actionable Insight: The area around the trendline is an optimal risk-to-reward zone for long positions, with the weekly candle close below the trendline serving as the strict stop-loss/invalidation point.
 BTCUSDTPerp84,793.8+0.30%
 ETHUSDTPerp2,691.77+0.69%
 BNBUSDTPerp786.01+2.46%