


A Technical Look at the Recent Surge
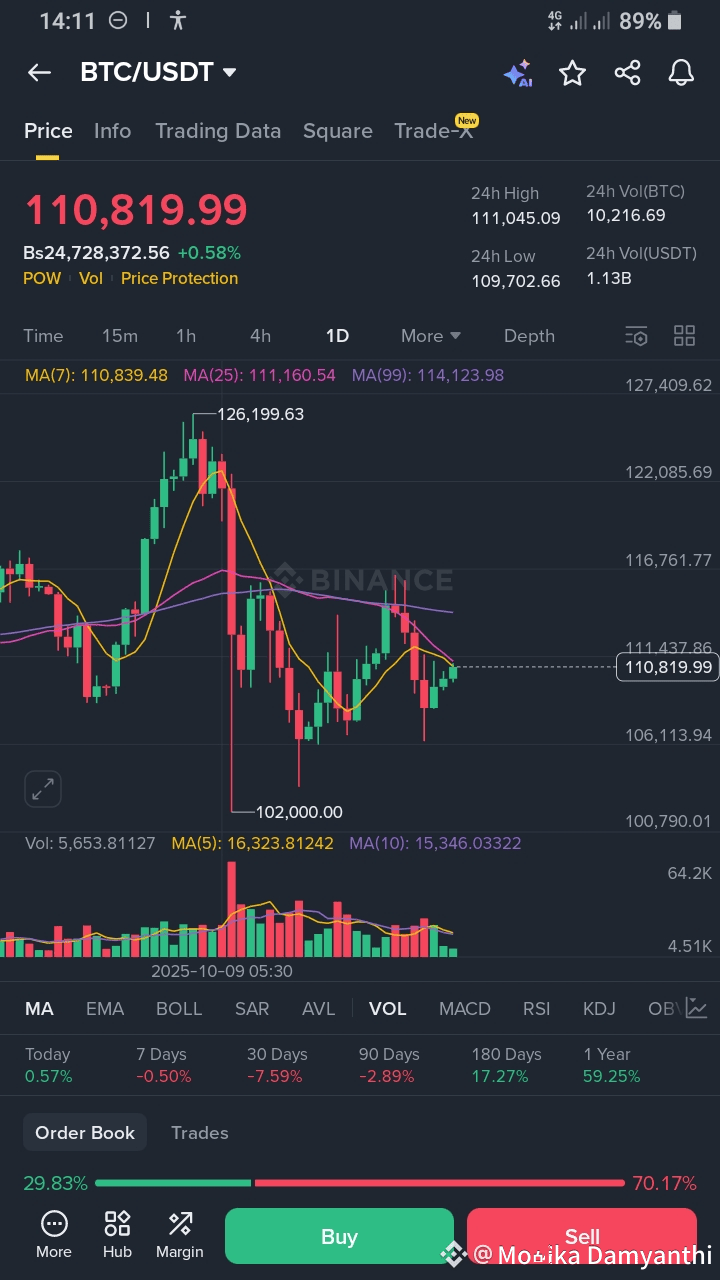
The Bitcoin market has demonstrated remarkable resilience and upward momentum in the recent trading period. Based on the BTC/USDT 1-day (1D) Candlestick Chart, the current price action suggests a clear path toward the next significant resistance level: the $115,000 psychological and technical barrier.
Candlestick and Moving Average (MA) Insights
The current price of Bitcoin is oscillating around $110,819.99. A closer look at the chart reveals several bullish signals that support a strong short-to-medium-term upward trend:
* Moving Average Crossover/Support: The price is actively trading above the critical MA(7) - $110,839.48. While the current price is just slightly below this line, the recent green candles show buyers are fighting to hold this support level.
* Near-Term Targets: The crucial test for the bullish continuation lies in breaking and holding above the MA(25) at $111,160.54. A decisive daily close above this 25-period average would strongly signal the resumption of the uptrend.
* Volume Confirmation: The recent green candles are often accompanied by higher trading volume (as seen in the volume bars below the chart), indicating that the buyers are entering the market with conviction, which is essential for a sustainable breakout.
The Path to $115,000
Based on the technical structure, the breakout scenario for $115,000 involves two key steps:
* Consolidation and Breakout (The $111,000 Zone):
* The immediate goal is for the price to comfortably move past the $111,437.88 horizontal resistance shown on the chart.
* Sustaining momentum above the MA(25) and the major MA(99) at $114,123.98 will be the final hurdle before the target. The MA(99) acts as a significant long-term resistance.
* Target Reached (The $115,000 Mark):
* A successful breakout above the MA(99) would clear the path for a rapid move to test the $115,000 level. This level is a crucial area of supply, which previously acted as both resistance and support.
> Key Takeaway: The current price action is highly constructive. As long as Bitcoin maintains strong support above the $109,702.66 (24h Low) and successfully clears the $111,160 area, the technical environment remains favorable for an advance towards $115,000.
>
Potential Risk (Invalidation)
Traders should monitor the strong support level around $102,000.00 (as marked by a recent swing low on the chart). A sustained drop and close below this $102,000 level would invalidate the immediate bullish outlook and suggest a deeper correction.
| Metric | Value | Interpretation |
|---|---|---|
| Current Price | $110,819.99 | Buyers are defending this range. |
| Immediate Resistance (MA 25) | $111,160.54 | Crucial level for trend continuation. |
| Long-Term Resistance (MA 99) | $114,123.98 | Last major hurdle before target. |
| Bullish Target | $115,000 | The next significant psychological/technical goal. |
| Invalidation/Strong Support | $102,000.00 | A break below this would signal a major risk. |
Disclaimer: This article is for informational purposes only and does not constitute financial or investment advice. Cryptocurrency trading is highly volatile and risky. Always do your own research (DYOR) before making any investment decisions.
#KITEBinanceLaunchpool #FOMCMeeting #BTC走势分析 $BTC #WriteToEarnUpgrade #BuiltonSolayer
