1) Current market overview
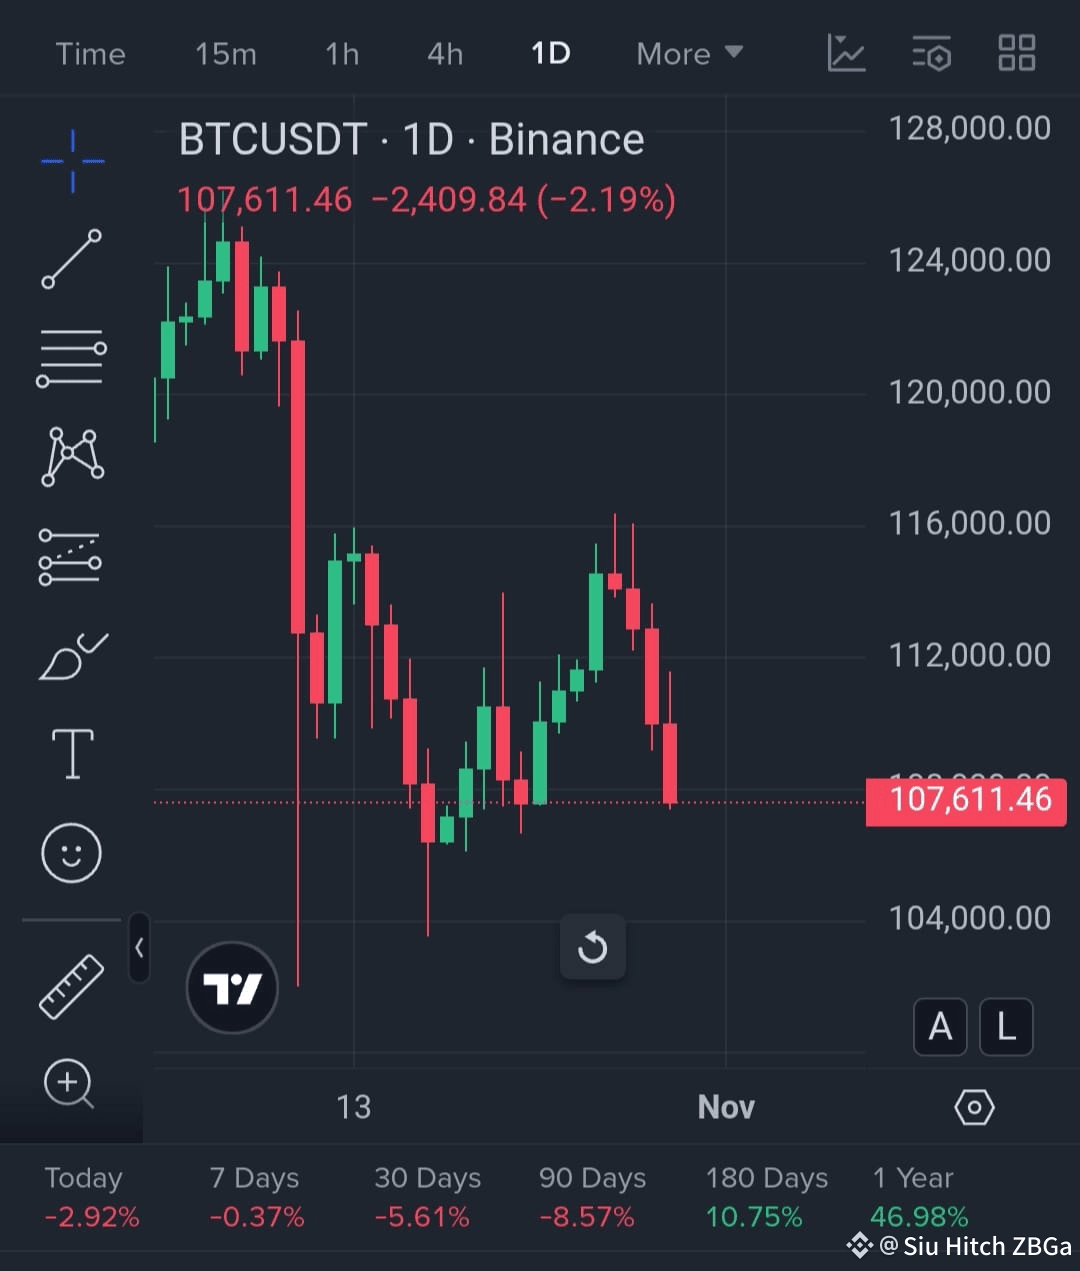
Pair / price shown: BTC/USDT ≈ $107,611 (displayed).
24h range (on-screen): High $113,020 / Low $107,400.
Short-term trend: Downside bias — the last several daily candles show lower highs and a recent red daily candle closing near the day’s low. Price has dropped from recent local highs (~116k area) into the 107k area.
Volatility & volume (visible): 24h BTC vol ≈ 29,487 BTC / 24h USDT vol ≈ $3.25B → still high liquidity; intraday volatility is meaningful (large daily range shown).
Momentum (inferred): Bearish momentum — sellers driving price lower; daily candle structure suggests sellers have control right now.
---
2) Technical analysis (based on the chart image)
Support & resistance (approximate, visually inferred):
Immediate support: ~$104k area (recent swing lows visible on chart).
Secondary support / psychological: $100k round number.
Immediate resistance: ~$112k–$116k (recent swing highs and cluster of wicks).
Major resistance: ~$120k+ (prior higher cluster visible left of chart).
Moving averages (MA50/MA100/MA200):
I can’t see MAs on the screenshot. Inference: Because price has recently declined from mid-100ks and is currently below recent short-term highs, the price is likely trading below the short-term MA (MA50) — implying short-term bearishness. (To be precise, load MAs on your chart.)
RSI, MACD, Volume analysis:
Exact RSI/MACD values are not visible. Based on price action:
RSI (inferred): likely moving toward neutral-to-oversold on daily (but not necessarily deeply oversold) due to a few consecutive down days.
MACD (inferred): likely showing declining momentum / a potential bearish cross or shrinking histogram.
Volume: 24h volume is large (liquidity present). If recent down days occur on rising volume, that confirms stronger selling pressure; if on low volume, it’s weaker — check the volume bars.
Trendlines / Fib / patterns:
Trendline: Short-term descending trendline from recent highs is intact (lower highs → sellers).$
$BTC
#BTCReserveStrategy
Pair / price shown: BTC/USDT ≈ $107,611 (displayed).
24h range (on-screen): High $113,020 / Low $107,400.
Short-term trend: Downside bias — the last several daily candles show lower highs and a recent red daily candle closing near the day’s low. Price has dropped from recent local highs (~116k area) into the 107k area.
Volatility & volume (visible): 24h BTC vol ≈ 29,487 BTC / 24h USDT vol ≈ $3.25B → still high liquidity; intraday volatility is meaningful (large daily range shown).
Momentum (inferred): Bearish momentum — sellers driving price lower; daily candle structure suggests sellers have control right now.
---
2) Technical analysis (based on the chart image)
Support & resistance (approximate, visually inferred):
Immediate support: ~$104k area (recent swing lows visible on chart).
Secondary support / psychological: $100k round number.
Immediate resistance: ~$112k–$116k (recent swing highs and cluster of wicks).
Major resistance: ~$120k+ (prior higher cluster visible left of chart).
Moving averages (MA50/MA100/MA200):
I can’t see MAs on the screenshot. Inference: Because price has recently declined from mid-100ks and is currently below recent short-term highs, the price is likely trading below the short-term MA (MA50) — implying short-term bearishness. (To be precise, load MAs on your chart.)
RSI, MACD, Volume analysis:
Exact RSI/MACD values are not visible. Based on price action:
RSI (inferred): likely moving toward neutral-to-oversold on daily (but not necessarily deeply oversold) due to a few consecutive down days.
MACD (inferred): likely showing declining momentum / a potential bearish cross or shrinking histogram.
Volume: 24h volume is large (liquidity present). If recent down days occur on rising volume, that confirms stronger selling pressure; if on low volume, it’s weaker — check the volume bars.
Trendlines / Fib / patterns:
Trendline: Short-term descending trendline from recent highs is intact (lower highs → sellers).$
$BTC
#BTCReserveStrategy