
it may go down further before the next uptrend


Publier


Kripto Kurdu
·
--
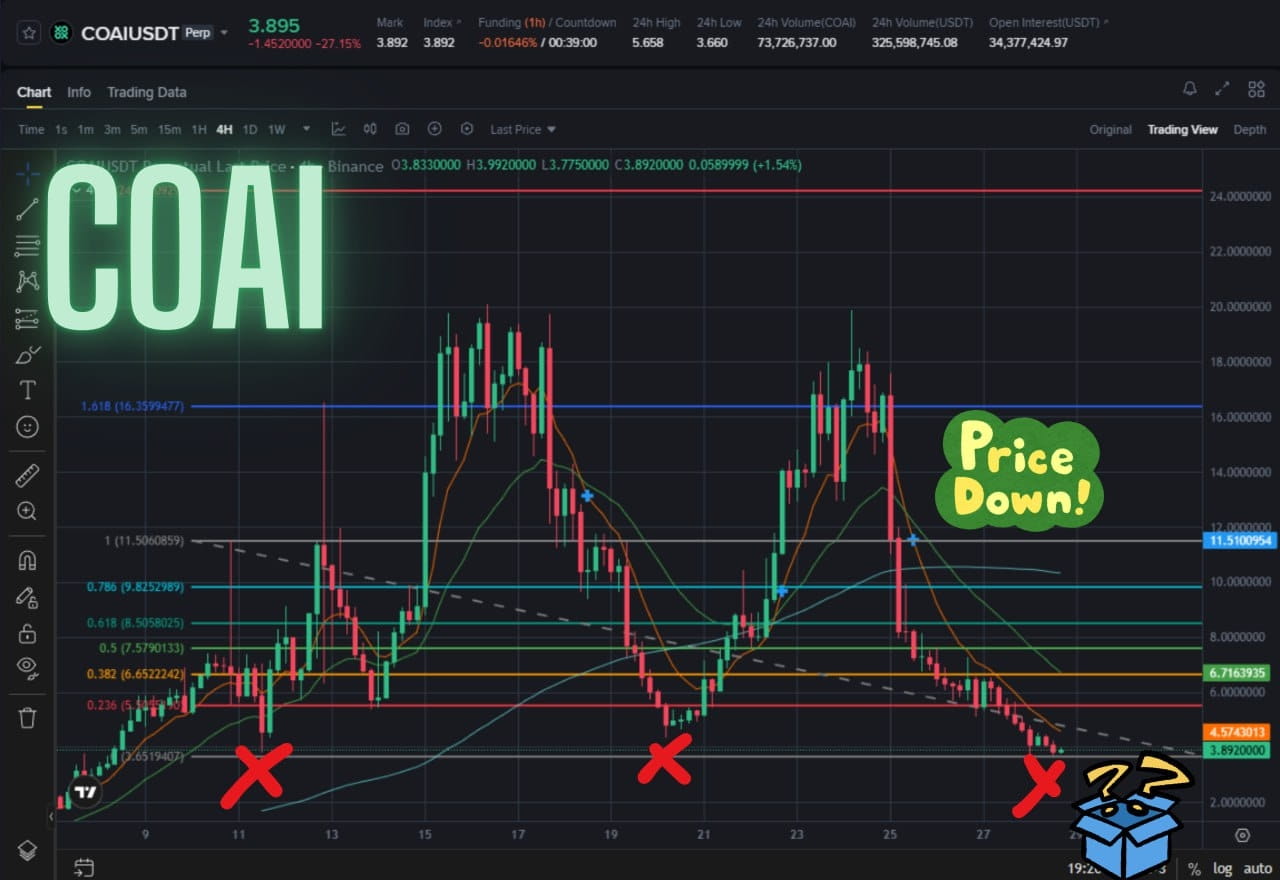
$COAI Critical Support Test
Following a series of consecutive upward attempts, the $COAI chart has experienced a sharp pullback and is now seeking support in the 3.8–4.0 USDT range.
- It has touched a point similar to previous low areas (marked with X).
- Based on Fibonacci levels, the 3.8–4.5 range stands out as a critical threshold.
- Volume and volatility indicate an intensifying battle between buyers and sellers in this zone.
👉 If this zone holds, a short-term rebound could be on the cards. However, if support breaks, the door could open for a deeper correction.#COAİ
Do you think COAI will recover from here, or will the “Price Down” trend continue? 🚨
Following a series of consecutive upward attempts, the $COAI chart has experienced a sharp pullback and is now seeking support in the 3.8–4.0 USDT range.
- It has touched a point similar to previous low areas (marked with X).
- Based on Fibonacci levels, the 3.8–4.5 range stands out as a critical threshold.
- Volume and volatility indicate an intensifying battle between buyers and sellers in this zone.
👉 If this zone holds, a short-term rebound could be on the cards. However, if support breaks, the door could open for a deeper correction.#COAİ
Do you think COAI will recover from here, or will the “Price Down” trend continue? 🚨
Avertissement : ce contenu inclut des opinions de tiers. Il ne constitue pas un conseil. Binance Ai peut être utilisée, sans garantie de résultat. Consultez les CG.