$BTC Analysis: April 18, 2026
Bitcoin has staged a major comeback this week, finally breaking out of a ten-week consolidation range. After a brutal start to 2026 where prices dipped to $60,000, the bulls have reclaimed the narrative.
1. Visual Price Snapshot
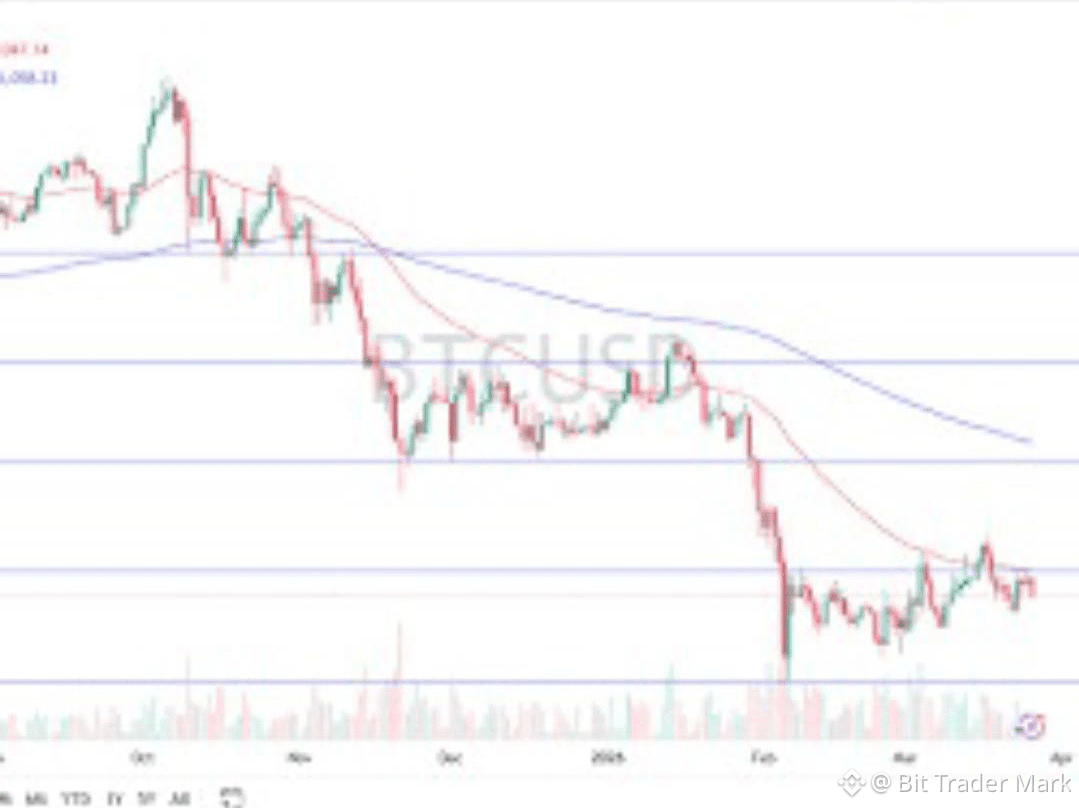
The chart below illustrates the "recovery arc" from the February lows to today’s breakout.
Note: This image represents the current market sentiment and technical structure of Bitcoin's 2026 recovery.
2. Technical Analysis: The Breakout
The Resistance Flip: For nearly two months, Bitcoin struggled to stay above $75,000. On Thursday, it decisively cleared this "ceiling," reaching as high as $78,337.
Moving Averages: BTC has jumped back above its 100-day moving average. In technical terms, this is a "regime change"—moving from a bearish corrective phase back into a bullish trend.
The Liquidations: The move was accelerated by a short squeeze. Roughly $537 million in bearish bets were liquidated in 24 hours, acting as fuel for the price jump.
The Bottom Line
$BTC is looking stronger than it has all year. However, with "Realized Profit" metrics hitting their highest levels since February, don't be surprised if we see a brief dip back to $74,000 to "retest" the old resistance before making a run at the $80,000 psychological barrier.
#IranRejectsSecondRoundTalks
#AltcoinRecoverySignals?
#ARKInvestReducedPositionsinCircleandBullish
Bitcoin has staged a major comeback this week, finally breaking out of a ten-week consolidation range. After a brutal start to 2026 where prices dipped to $60,000, the bulls have reclaimed the narrative.
1. Visual Price Snapshot
The chart below illustrates the "recovery arc" from the February lows to today’s breakout.
Note: This image represents the current market sentiment and technical structure of Bitcoin's 2026 recovery.
2. Technical Analysis: The Breakout
The Resistance Flip: For nearly two months, Bitcoin struggled to stay above $75,000. On Thursday, it decisively cleared this "ceiling," reaching as high as $78,337.
Moving Averages: BTC has jumped back above its 100-day moving average. In technical terms, this is a "regime change"—moving from a bearish corrective phase back into a bullish trend.
The Liquidations: The move was accelerated by a short squeeze. Roughly $537 million in bearish bets were liquidated in 24 hours, acting as fuel for the price jump.
The Bottom Line
$BTC is looking stronger than it has all year. However, with "Realized Profit" metrics hitting their highest levels since February, don't be surprised if we see a brief dip back to $74,000 to "retest" the old resistance before making a run at the $80,000 psychological barrier.
#IranRejectsSecondRoundTalks
#AltcoinRecoverySignals?
#ARKInvestReducedPositionsinCircleandBullish